

Abstract
BACKGROUND AND PURPOSE: Proton MR spectroscopy (MRS) detectability of brain glutamate/glutamine (Glx) is increased in hypoxic-ischemic insults and is implicated in the neuronal injury and death that follows. Our aim was to correlate the proton MRS detectability of α-CH protons of Glx (α-Glx) with the Sarnat stage of neonatal hypoxic-ischemic encephalopathy (HIE).
METHODS: Initial and follow-up proton MRS studies at 1.9 T were performed in 28 neonates aged 1 to 7 days (seven healthy control subjects and 21 with HIE: 10 mild, nine moderate, and two severe) and in 12 neonates aged 13 to 17 days (12 with HIE: eight mild, three moderate, and one severe), respectively. Both point-resolved spectroscopy (PRESS) and stimulated-echo acquisition mode (STEAM) sequences were used. The spectral volume of interest was in the basal ganglia, thalami, and adjoining regions. The detectability of α-Glx was assessed by two different parameters: the detection rate of the α-Glx peak and the peak-area ratio of α-Glx to creatine and phosphocreatine.
RESULTS: On both the initial and follow-up PRESS studies, all the neonates with moderate and severe HIE showed an α-Glx peak, compared with one healthy control subject in the initial study and one neonate with mild HIE in both the studies. They also demonstrated a significantly higher peak-area ratio of α-Glx/(creatine and phosphocreatine) on both the initial and follow-up studies. The peak-area ratios in neonates with HIE positively correlated with the Sarnat stage of HIE on both the initial and follow-up studies. Neonates with moderate and severe HIE also showed a consistently higher α-Glx peak on both the initial and follow-up studies with the STEAM sequence.
CONCLUSION: Proton MRS detectability of α-Glx is increased in moderate and severe HIE and correlates with the Sarnat stage of HIE.
The basic underlying pathophysiological cause of hypoxic-ischemic encephalopathy (HIE) is a tissue oxygen deficiency brought about by hypoxemia, ischemia, or asphyxia neonatorum (1). Previous animal and human studies involving the use of microdialysis and immunocytochemical techniques have clearly indicated that with ischemia, hypoxic-ischemic insults, or seizures, glutamate, a major excitatory amino acid neurotransmitter in the brain (2), increases rapidly in the extracellular spaces and glial cells in the brain and decreases concomitantly in the neuronal cells owing to energy failure (3–9). In addition, other studies suggest that it is the increased glutamate in the extracellular spaces of the brain that plays an important role in neuronal injury and death, as well as in the epileptogenesis and seizure expression induced by ischemia and hypoxemia (10–12). Consequently, glutamate is intimately involved in the pathogenesis of HIE (13).
MR spectroscopy (MRS) is a noninvasive method that can be used to measure the in vivo concentrations of intracerebral metabolites, such as glutamate/glutamine (Glx), N-acetylaspartate (NAA), lactate (Lac), choline-containing compounds (Cho), creatine and phosphocreatine (Cr + PCr), and myo-inositol (M-Ino) (14–17). It has been documented that Glx in human brain can be detected with both short- and long-echo proton MRS pulse sequences (15, 18, 19). Studies in superfused guinea pig brain slices (20, 21) at long TEs using high magnetic field MRS systems show that under normal conditions, only 70% to 80% of the total intracerebral glutamate concentration can be detected when using proton MRS. The remaining 20% to 30% lies in the intraneuronal neurotransmitter vesicles or mitochondria, which compromises its proton MRS detectability (20, 21). After a severe metabolic insult (eg, aglycemic anoxia), however, all the intracerebral glutamate becomes detectable (20). Recently, a proton MRS study in patients with hypoxic encephalopathy after near-drowning also showed an increased detectability of the Glx peak on brain proton MRS (22).
Although several proton MRS studies have been performed in neonatal HIE (23–29), to the best of our knowledge, no study has been done to correlate the severity of HIE with the detectability of Glx on brain proton MRS. This proton MRS study was performed to investigate the correlation between the Sarnat stage of HIE and the brain proton MRS detectability of the peak of the α-CH protons of Glx (α-Glx) using both point-resolved spectroscopy (PRESS) (30) and stimulated-echo acquisition mode (STEAM) (31, 32) sequences. Follow-up proton MRS was performed to monitor the time frame of the increased detectability of Glx as well. Although there are three CH groups in Glx molecules that can be detected by proton MRS (α-CH, β-CH2, and γ-CH2), in this study the changes of Glx in HIE were assessed by the evaluation of the α-Glx peak at 3.75 ppm.
Methods
Subjects
Twenty-eight neonates participated in this study, which was approved by the institutional review board of our hospital. They were divided into four groups on the basis of the presence and severity of HIE. Group I was composed of seven healthy neonates who were recruited specifically as control subjects for this study. Group II consisted of 10 neonates with mild HIE (Sarnat stage 1: hyperalertness and hyperexcitability). Nine neonates with moderate HIE (Sarnat stage 2: lethargy, hypotonia, and suppressed primitive reflexes) formed group III. Group IV consisted of two neonates with severe HIE (Sarnat stage 3: stupor, flaccidity, and absent primitive reflexes) (33). The diagnosis and grading of the Sarnat stage of HIE was made by two pediatricians independently and was based on the clinical signs and the presence of a history of asphyxia (1, 33). In all cases, prescribed supportive treatment was started immediately after the clinical diagnosis of HIE was made (1), before the initial proton MRS study.
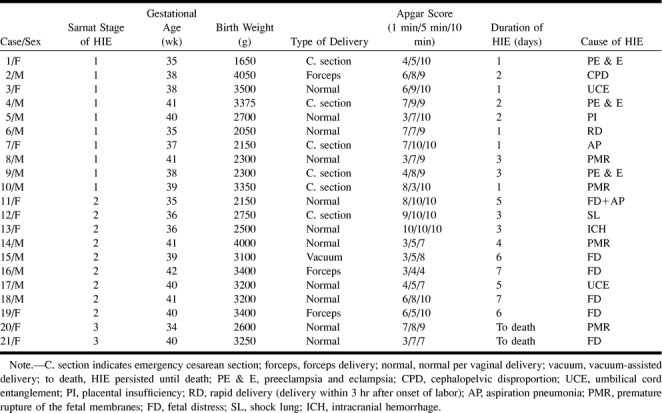
The clinical features of group I neonates were as follows: the mean gestational age at time of birth was 39.3 weeks, mean birth weight was 3386 g, the mean Apgar scores at 1, 5, and 10 minutes after birth were 9.4, 10.0, and 10.0, respectively. All the group 1 neonates were delivered normally per vaginal delivery. The clinical characteristics of neonates with HIE are provided in Table 1. Gestational ages (in weeks) of all the neonates were obtained from maternal dates, antenatal sonography, and by a postpartum physical examination of the neonates.
TABLE 1:
Clinical characteristics of neonates with hypoxic-ischemic encephalopathy (HIE)
Data Acquisition
Proton MRS data were acquired using a 1.9-T Elscint Gyrex MR imaging/MRS scanner with a circularly polarized head coil (Elscint, Haifa, Israel). Before the start of the MRS study, the following images were acquired for MRS localization and imaging diagnosis: gradient-echo images in three planes at 25/6/1 (TR/TE/excitations) with a flip angle of 25° and a section thickness of 7 mm; whole-head axial T1-weighted spin-echo images (620/12/1) with a section thickness of 5 mm; and whole-head axial T2-weighted fast spin-echo images (4400/96eff/1) with an echo train length of 12 and a section thickness of 5 mm. MR imaging and MRS were performed during natural sleep in healthy control subjects, except in the case of one neonate, who was sedated with 10% chloral hydrate. All neonates with HIE were under sedation induced by 10% chloral hydrate during the performance of MR imaging and MRS. The neonates were monitored throughout the imaging procedures by a pediatrician and with an MR-compatible pulse oximeter (In vivo 4500 MR imaging, In vivo Research, Orlando, FL). Pure oxygen breathing was maintained throughout the scanning procedure by an MR-compatible oxygen delivery system.
In our study, the single spectral volume of interest in all neonates was chosen in the regions of the basal ganglia, thalami, and the adjoining centra semiovales, and in a portion of the third and lateral ventricles. Since the basal ganglia and thalami are most sensitive to the effects of acute anoxia, as indicated by earlier studies performed in primates and human newborns with severe perinatal asphyxia (34–37), this single voxel can reflect the global disturbances in HIE. The section thickness was 20 mm and the anterior-to-posterior and right-to-left dimensions were 30 × 30 mm (Fig 1). The multiplanar anatomic MR images obtained before the start of the MRS study were valuable in acquiring data from identical spectral volumes in each neonate on both the initial and follow-up proton MRS studies.
fig 1.
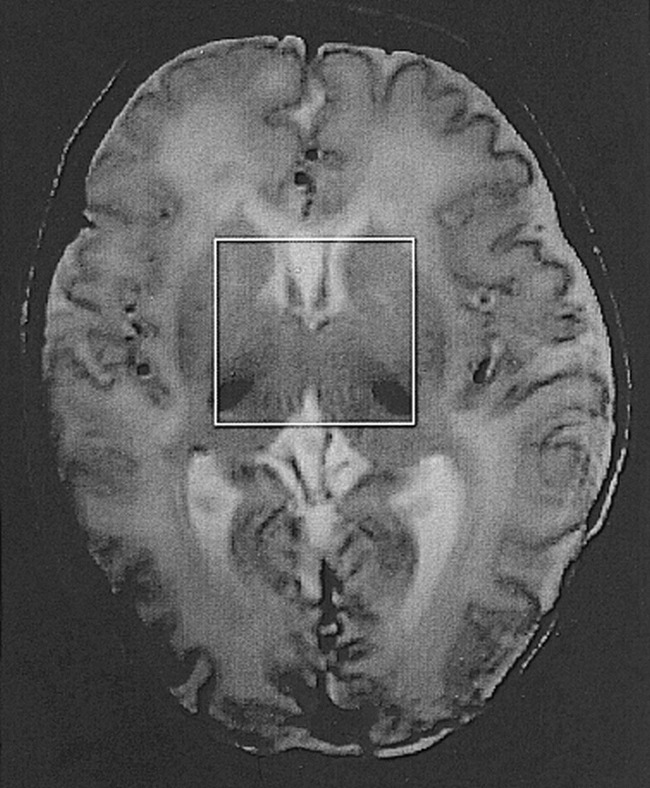
Axial T2-weighted fast spin-echo MR image (4400/96eff/1) shows spectral volume in the neonatal brain that was chosen for the study
The scan parameters for the PRESS sequence were 2000/135/250. The scan parameters for the STEAM sequence were 2000/24/250, with a middle time of 63 milliseconds. The spectral bandwidth and number of samples for both sequences were 2000 Hz and 1024 points, respectively. The magnetic field was carefully shimmed within the selected volume, which resulted in a full width at half height of the unsuppressed water peak of less than 0.1 ppm in all subjects. After shimming, water suppression calibration scans were obtained with three cycles of a chemical-shift selective water suppression sequence (CHESS × 3) (38). This procedure was accomplished by changing the tip angle of the CHESS × 3 pulse sequence until the water signal was minimized. The nominal bandwidth of the CHESS × 3 radio-frequency pulse was ±48 Hz (±0.6 ppm). This narrow bandwidth can avoid suppression of the resonance peak of the α-Glx at 3.75 ppm. The spectral acquisition with both the PRESS and STEAM sequences was then performed with a CHESS × 3 water suppression sequence using the predefined tip angle, thereby minimizing the water signal. The total examination time was approximately 50 minutes.
Because the T2 relaxation time of Glx is difficult to measure and thus unknown (20, 39), the initial and follow-up proton MRS studies were acquired with the long-TE PRESS and short-TE STEAM sequences in the same session to be certain that Glx could be detected. In both initial and follow-up studies, the same MR and MRS sequences and parameters were used.
Initial proton MRS with the STEAM sequence and follow-up proton MRS with both the PRESS and STEAM sequences were not performed in some neonates, owing to either their withdrawal from further participation in the study by their parents or their poor general condition.
The initial proton MRS study was performed in all subjects using the PRESS sequence. The initial proton MRS studies were also performed with the STEAM sequence in two of seven subjects in group I, in nine of 10 in group II, in three of nine in group III, and in one of two in group IV.
With the PRESS sequence, the follow-up proton MRS study was performed in eight of 10 subjects in group II, in three of nine in group III, and in one of two in group IV. The STEAM sequence was performed in five of 10 subjects in group II, in two of nine in group III, and in one of two in group IV.
Metabolite Quantification
The water-suppressed spectra acquired with both the PRESS and STEAM sequences were compensated for phase shifts due to eddy currents by reference to an unsuppressed water spectrum with Elscint MRS postprocessing software. A line broadening of 2 Hz and a zero-filling from 1024 to 2048 data points were applied. The signal of the free induction decay were then Fourier-transformed. Phased spectra were displayed with zero-order phase correction in all spectra. On all the proton MRS studies, the prominent NAA peak at 2.0 ppm was used as an internal chemical shift reference (16, 17). The spectra exhibited peaks of Cho at 3.2 ppm, of (Cr + PCr) at 3.02 and 3.90 ppm, of M-Ino at 3.5 ppm (16, 17), and of α-Glx at 3.75 ppm (15, 19, 40). The peaks of the β- and γ-CH2 protons of Glx (β- and γ-Glx) were observed within a range of 2.0 to 2.5 ppm (22, 29, 40). Water resonance was approximately at 4.7 ppm. For relative quantification of the metabolites detected with proton MRS, the areas under the resonance peaks of the metabolites were measured. This was accomplished by computer integration of the peaks on the spectra acquired with the PRESS pulse sequence. The measurements were given as peak-area ratios of α-Glx, NAA, and Cho to (Cr + PCr), because the peak of (Cr + PCr) at 3.02 ppm is an accepted internal amplitude reference (22, 24, 26, 27). The detectability of α-Glx was assessed by two different parameters: the detection rate of the α-Glx peak and the peak-area ratio of the α-Glx to (Cr + PCr). The measurements were not performed on the spectra obtained with the short-TE STEAM sequence because the baseline was not uniform.
Statistical Methods
Statistical analysis was performed using Statview 5.0 statistical software (Abacus Concepts, Berkeley, CA). The data were described using median/range. Nonparametric tests were used because the data were not normally distributed. Fisher's exact tests among groups I, II, III, and IV were performed for the detection rate of the α-Glx peak on the initial and follow-up proton MRS studies with both the PRESS and STEAM sequences. Unpaired Mann-Whitney U tests were carried out for the differences of the peak-area ratios of α-Glx, NAA, and Cho to (Cr + PCr) among groups I, II, and III + IV on the initial proton MRS study and between groups II and III + IV on the follow-up proton MRS study. For the purpose of the Fisher's exact test and the U test, groups III and IV were combined owing to the small number of patients with severe HIE. Spearman rank correlations were performed to correlate the Sarnat stage of HIE in groups II, III, and IV with the peak-area ratios of α-Glx, NAA, and Cho to (Cr + PCr) measured on the initial and follow-up PRESS proton MRS studies. Results were judged significant at the P < .05 level.
Results
Initial Proton MRS Studies (in Healthy Control Subjects and in Neonates in the First Week of HIE)
Proton MRS Acquired with the PRESS Sequence
A peak of α-Glx at 3.75 ppm was observed in one of seven neonates in group I, in one of 10 in group II, in all nine in group III, and in both subjects in group IV. The detection rate of the peak was significantly higher in group III + IV than in groups I and II (P < .05). The peaks of NAA, Cho, and (Cr + PCr) were clearly seen in all the neonates. The typical spectra obtained in healthy control subjects and in neonates with mild, moderate, and severe HIE are shown in Figs 2A, 3A, 4A, and 5A, respectively.
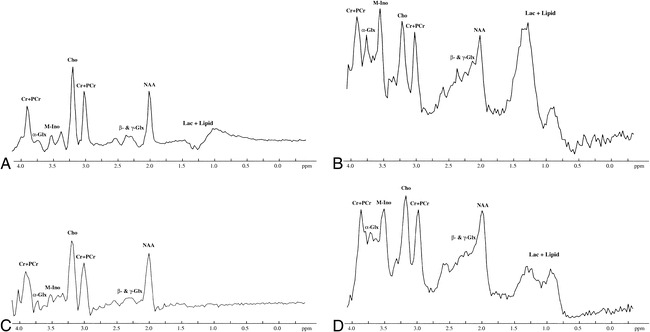
fig 2.
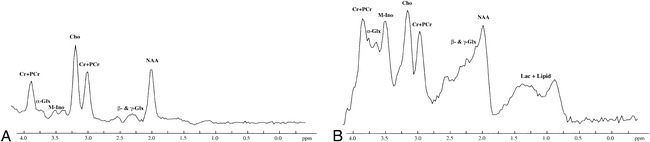
A and B, Brain proton MRS in a healthy neonate obtained at 4 days of age. Both PRESS (2000/135/250) (A) and STEAM (2000/24/250) (B) proton MRS studies show the peaks of NAA at 2.0 ppm, β- and γ-Glx at 2.0 to 2.5 ppm, Cho at 3.2 ppm, (Cr + PCr) at 3.02 and 3.90 ppm, and M-Ino at 3.5 ppm. There is a barely visible peak of α-Glx at 3.75 ppm. The peaks of Lac + Lipid at 0.75 to 1.75 ppm are visible on STEAM proton MRS study. NAA indicates N-acetylaspartate; β- and γ-Glx, β- and γ-CH2 protons of Glx; Cr + PCr, creatine and phosphocreatine; Cho, choline-containing compounds; M-Ino, myo-inositol; α-Glx, α-CH protons of Glx; Lac + Lipid, lactate and lipid
Proton MRS Acquired with the STEAM Sequence
The peak of α-Glx was observed in all subjects who underwent STEAM proton MRS (two of two in group I, nine of nine in group II, three of three in group III, and one of one in group IV). The relative height of the α-Glx peak at 3.75 ppm compared with the (Cr + PCr) peak at 3.02 ppm was consistently higher in all group III and group IV neonates than that obtained in neonates in groups I and II. The typical spectra obtained in healthy control subjects and in neonates with mild, moderate, and severe HIE are shown in Figs 2B, 3B, 4B, and 5B, respectively. The peaks of NAA, Cho, and (Cr + PCr) were clearly seen in all neonates, except in the case of one neonate who had severe HIE and an undefined NAA peak (Fig 5B).
fig 5.
Initial and follow-up brain proton MRS studies in a neonate with severe HIE performed at 7 and 14 days of age, respectively. The peaks of Cho and (Cr + PCr) are clearly visible in all the MRS studies. The NAA peak is easily detected on PRESS proton MRS. However, in STEAM proton MRS studies, it is not well defined and is decreased in height. M-Ino is clearly visible on both the initial and follow-up STEAM proton MRS studies, but is only barely seen on the PRESS proton MRS studies.
A, Initial PRESS proton MRS study (2000/135/250) shows a high peak of α-Glx at 3.75 ppm.
B, Initial STEAM proton MRS study (2000/24/250) shows a remarkable α-Glx peak at 3.75 ppm.
C and D, Follow-up PRESS (2000/135/250) (C) and STEAM (2000/24/250) (D) proton MRS studies show that the height of the α-Glx peak at 3.75 ppm is decreased compared with that obtained on the initial PRESS and STEAM proton MRS studies. Other peaks are similar on both the initial and follow-up PRESS and STEAM proton MRS studies. For abbreviations, see figure 1.
Measurements of Peak-Area Ratios
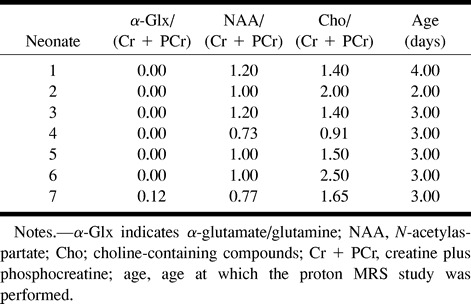
The peak-area ratios of α-Glx, NAA, and Cho to (Cr + PCr) obtained in all subjects in groups I, II, III, and IV on the initial PRESS proton MRS studies are listed in Tables 2 and 3. The level of the peak-area ratio of α-Glx/(Cr + PCr) in group III + IV (median/range = 0.38/2.63, n = 11) was significantly higher than that obtained in groups I (median/range = 0.00/0.12, P = .0005, n = 7) and II (median/range = 0.00/0.33, P = .0003, n = 10). The difference in the level of this ratio was not significant between groups I (median/range = 0.00/0.12, n = 7) and II (median/range = 0.00/0.33, n = 10) (P = .9223). The level of this ratio in neonates with HIE (groups II, III, and IV) positively correlated with the Sarnat stage of HIE (Spearman rank correlation, ρ = .89, P < .0001). The difference in the level of the peak-area ratio of NAA/(Cr + PCr) among group I (median/range = 1.00/0.47, n = 7), group II (median/range = 1.00/2.06, n = 10), and group III + IV (median/range = 1.00/1.10, n = 11) was not significant (P > .05). The difference in the level of the peak-area ratio of Cho/(Cr + PCr) among group I (median/range = 1.50/1.59, n = 7), group II (median/range = 1.71/3.00, n = 10), and group III + IV (median/range = 1.50/1.27, n = 11) was also not significant (P > .05). There was no significant correlation between the peak-area ratios of NAA and Cho to (Cr + PCr) and Sarnat stage of HIE among the neonates with HIE on the initial proton MRS studies.
TABLE 2:
The peak-area ratios of α-Glx, NAA, and Cho to (Cr + PCr) on the initial PRESS proton MRS studies in healthy normal control subjects
Follow-up Proton MRS Studies (after the First Week of HIE)
Proton MRS Acquired with the PRESS Sequence
The peak of α-Glx was visible in one of eight neonates in group II, in all three neonates in group III, and in the only neonate in group IV. The detection rate of the α-Glx peak was significantly higher in the neonates in group III + IV than in those in group II (P < .05). The typical spectra obtained in neonates with mild, moderate, and severe HIE are shown in Figs 3C, 4C, and 5C, respectively. The peaks of NAA, Cho, and (Cr + PCr) were clearly seen in all neonates.
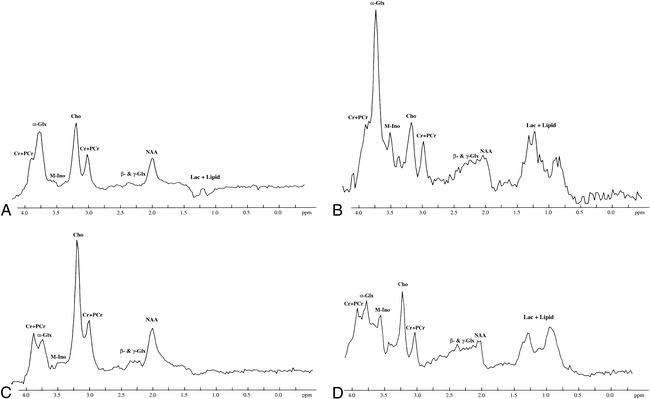
fig 3.
Initial and follow-up brain proton MRS studies in a neonate with mild HIE performed at 3 and 13 days of age, respectively. The peaks of NAA, Cho, (Cr + PCr), and M-Ino are clearly visible in all the MRS studies.
A, Initial PRESS proton MRS study (2000/135/250) shows a barely visible peak of α-Glx at 3.75 ppm.
B, Initial STEAM proton MRS study (2000/24/250) shows the apparent peak of α-Glx at 3.75 ppm.
C, Follow-up PRESS proton MRS study (2000/135/250) shows no apparent changes as compared with the initial PRESS proton MRS study.
D, Follow-up STEAM proton MRS study (2000/24/250) shows the decrease in the heights of the peaks of α-Glx at 3.75 ppm and M-Ino at 3.5 ppm as compared with those on the initial STEAM proton MRS. There are no apparent changes in the heights of the other peaks. For abbreviations, see figure 1.
Proton MRS Acquired with the STEAM Sequence
The peak of α-Glx was seen in three of the five neonates in group II, in both neonates in group III, and in the only neonate in group IV. The detection rate of the α-Glx peak was not significant among the three groups (P > .05). The relative height of the α-Glx peak at 3.75 ppm to the (Cr + PCr) peak at 3.02 ppm was consistently higher in all group III + IV neonates as compared with group II neonates. The typical spectra obtained in neonates with mild, moderate, and severe HIE are shown in Figs 3D, 4D, and 5D, respectively. The peaks of NAA, Cho, and (Cr + PCr) were clearly seen in all neonates, except in the case of one who had severe HIE and an undefined NAA peak (Fig 5D).
Measurements of Peak-Area Ratios
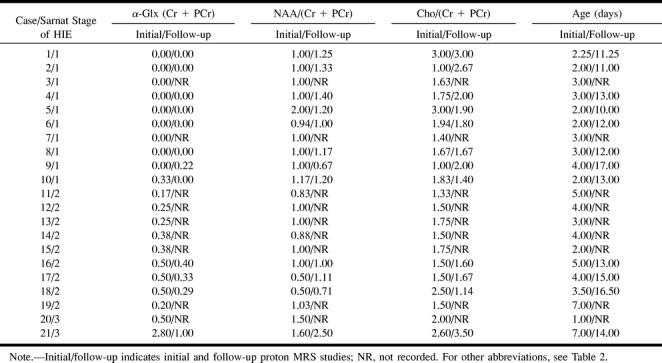
The peak-area ratios of α-Glx, NAA, and Cho to (Cr + PCr) in all subjects of all three groups on the follow-up PRESS proton MRS studies are enumerated in Table 3. The level of the peak-area ratio of α-Glx/(Cr + PCr) in group III + IV (median/range = 0.37/0.71, n = 4) continued to be significantly higher than that observed in group II (median/range = 0.00/0.22, P = .0066, n = 8) on the follow-up studies. The level of this ratio in neonates with HIE (groups II and III + IV) positively correlated with the Sarnat stage of HIE (Spearman rank correlation, ρ = .944, P = .0017). The difference in the level of the peak-area ratio of NAA/(Cr + PCr) between group II (median/range = 1.20/0.73, n = 8) and group III + IV (median/range = 1.06/1.79, n = 4) was not significant (P > .05). The difference in the level of the peak-area ratio of Cho/(Cr + PCr) between group II (median/range = 1.95/1.60, n = 8) and group III + IV (median/range = 1.64/2.36, n = 4) was also not significant (P > .05). There was no significant correlation between the peak-area ratios of NAA and Cho to (Cr + PCr) and the Sarnat stage of HIE among the neonates with HIE on the follow-up proton MRS studies.
TABLE 3:
The peak area ratios of α-Glx, NAA, and Cho to (Cr + PCr) on the initial and follow-up PRESS proton studies in neonates with hypoxic-ischemic encephalopathy (HIE)
Discussion
Our study shows that neonates with mild HIE had either no increase in the detectability of α-Glx or an insignificant increase as compared with the healthy control neonates. In contrast, the proton MRS detectability of α-Glx was increased significantly in neonates with both moderate and severe HIE. The increase of α-Glx persisted for at least 2 weeks after the onset of HIE, as indicated by both the initial and follow-up proton MRS studies. Further, the level of the α-Glx/(Cr + PCr) peak-area ratio from brain proton MRS also correlated positively with the Sarnat stage of HIE. Since the height and peak-area ratio of α-Glx peak is proportional to the number of the α-Glx protons, which in turn is proportional to the number of Glx molecules in the region of interest of the brain, the detectability of α-Glx actually reflects the changes of Glx in the brain. These findings are in agreement with previous studies using microdialysis and immunocytochemical techniques (4, 41, 42).
Under physiological conditions, glutamate is released by nerve terminals into the synapse through a process called exocytosis, following which it binds to postsynaptic glutamate receptors. A fraction of the released glutamate then undergoes uptake by transporters in the adjacent glial processes, while the uptake of the residual glutamate is mediated through the presynaptic or postsynaptic neuronal transporters. The glutamate reabsorbed by glial cells is effectively converted to glutamine by the enzyme glutamine synthetase or metabolized to oxoglutarate and aspartate by other enzymes, such as glutamate dehydrogenase and aspartate aminotransferase (5). Glutamine is then transferred intraneuronally, where it acts as a substrate in the synthesis of glutamate.
The tissue level of glutamate, as recorded by biochemical methods in the hippocampus, is largely unchanged after a transient ischemic insult (41, 42), and the intravesicular or intramitochondrial glutamate is invisible by proton MRS (20 21). In cerebral ischemia or hypoxemia, vesicle exocytosis of glutamate is inhibited while transporters on neuronal somata, dendrites, and axon terminals probably show a reversed uptake due to the breakdown of the ion gradients (4). The residual glutamate uptake in glial cells causes an accumulation of glutamate within them, since glutamine synthetase is shut down as a result of the depletion of ATP and consequent energy failure. This leads to glutamate increase in the extracellular spaces and glial cells and a concomitant decrease in the neuronal cells (including that in the neurotransmitter vesicles or mitochondria) in the brain (4), thereby enhancing the proton MRS detectability of glutamate. These changes of Glx in the brain tissue compartments may explain the observation of a higher α-Glx peak on brain proton MRS in our study in neonates with moderate and severe HIE as compared with neonates with mild HIE and healthy control subjects, since neonates with moderate and severe HIE have more severe energy failure. These changes of Glx in the brain may also explain the observation of the high peak-area ratio of α-Glx/(Cr + PCr) in the neonates in group III + IV as compared with that seen in the neonates in groups I and II, and the correlation of the Sarnat stage of HIE with peak-area ratio of α-Glx/(Cr + PCr). The increased detectability of α-Glx or the peak-area ratio of α-Glx/(Cr + PCr) on proton MRS therefore may reflect a redistribution of the intracerebral Glx in various brain tissue compartments due to hypoxemia and ischemia.
It is known that with ischemia, hypoxic-ischemic insults, or seizures, the change in glutamate concentration caused by its redistribution in the different compartments of brain tissue is much greater than that of glutamine (4, 13). In our study, however, we measured the Glx complex as a whole, because glutamate and glutamine are structurally very similar and cannot be separated individually by presently available clinical MR imaging/MRS systems (18).
As we mentioned earlier, structurally, Glx has three kinds of protons, α-CH and β- and γ-CH2, that can be detected by proton MRS. In our study, however, Glx was measured only at its α-CH proton peak at 3.75 ppm (α-Glx) because the peaks of β- and γ-Glx were complicated by their complex phase modulation (18). Therefore, there were no defined peaks of β- and γ-Glx on the spectrum obtained with our clinical MR imaging/MRS system at 1.9-T magnetic field strength. The more severe phase modulation between β- and γ-Glx than between α- and β-Glx was due to the fact that the chemical shift difference relative to the value of spin-spin coupling constant was much smaller between β- and γ-Glx than between α- and β-Glx (40, 43, 44). Studies involving liver failure (15) and ornithine carbamoyl transferase deficiency (19) performed on other clinical MR imaging/MRS units have also demonstrated a similarly well-defined α-Glx peak and poorly defined β- and γ-Glx peaks.
For a given pulse sequence at a given magnetic field strength, the proton MRS signal intensity of a compound is determined by its proton concentration, spin saturation effect, and T2 relaxation times (45). The proton concentration of α-Glx is proportional to the number of Glx molecules in the region of interest of the brain. Although the TR of 2000 used in this study does not allow full relaxation of all the protons of the metabolites between pulses (implying that peak-area ratios do not correspond directly to the concentration ratios of the metabolites), the saturation factors (the ratio of fully relaxed to saturated spectra) for NAA, Glx, and (Cr + PCr) were not high enough to require correction of metabolite ratios for saturation, as indicated by a previous study (20). The T2 values of NAA and (Cr + PCr) are quite similar to each other under the conditions of normoxia, anoxia, and anoxia plus aglycaemia. Their values change, however, as the blood oxygenation status changes (20). Because of the complex phase modulation of the peaks of glutamate, it is difficult to measure its T2 value (20, 39). Nevertheless, the better detection of α-Glx in all groups of subjects in this study by short-TE STEAM proton MRS compared with long-TE PRESS proton MRS implies that α-Glx has a short apparent T2 relaxation time in the brain of healthy neonates and neonates with HIE (46). Based on the discussion above, we think that the changes of α-Glx detectability is mainly due to the changes of proton MRS detectable concentration of Glx in the spectral volume of interest.
The increased detectability of α-Glx on proton MRS in moderate and severe HIE and the correlation of the proton MRS detectability of α-Glx with the Sarnat stage of HIE demonstrated in this study are important in the understanding of the pathophysiology of HIE. Previous studies (4, 20, 21, 41, 42) that showed changes in glutamate concentration in the brain tissue compartments in ischemia or hypoxemia were performed largely in in vitro brain slices or in in vivo animal experiments. This human study, using a noninvasive clinical MR imaging/MRS system documents, changes of the Glx in brain tissue compartments in neonatal HIE. In addition, this study shows, for the first time, that the proton MRS detectability of Glx increases directly with the Sarnat stage of HIE, implying that the brain proton MRS–detectable concentration increases with Sarnat stage of HIE. This is consistent with the concept documented by previous studies (13) showing that glutamate plays an important role in the pathogenesis of HIE in neonates.
Glutamate antagonists (eg, ketamine and dizocilpine) are available (47) and have been shown to have protective effects against the glutamate redistribution-induced neurodegeneration in hypoxemia or ischemia (47, 48) and the development of seizures (49, 50) in animal and in vitro models. The increased detectability of α-Glx in HIE with proton MRS and the positive correlation between the Sarnat stage of HIE and the peak-area ratio of α-Glx/(Cr + PCr) on proton MRS found in this human study suggest that, at therapeutic levels, glutamate antagonists may play a significant role in the prevention and treatment of HIE and consequently limit the long-term complications of HIE. Another important application of this study in the treatment of HIE with glutamate antagonists is that proton MRS can be used to estimate the therapeutic window of the antagonists because it can measure and monitor distribution changes of the Glx in various brain tissue compartments.
It is worthwhile to mention that the focus of this study was not the measurement of the Lac peak. In order to clearly separate the Lac peak from the peaks of Lip, PRESS spectra with TE values of both 135 and 270 are often needed (51, 52). Because the general condition of neonates with moderate and severe HIE who participated in this study was very poor, it was impractical to perform an additional PRESS proton MRS scan with a TE of 270 in these patients, since a longer scanning time would be required. Therefore, the measurement of the area under the Lac peak was not specifically performed in the present study. It also should be noted that the correlation of the peak-area ratio of α-Glx to (Cr + PCr) with long-term outcome was not included. This kind of study is now in progress.
Conclusion
This in vivo human study shows that the proton MRS detectability of α-Glx is increased in brains of neonates with moderate and severe HIE. Our study documents, for the first time, the existence of a positive correlation between the proton MRS detectability of α-Glx and the Sarnat stage of HIE. Further, it also suggests that proton MRS can be used to monitor the changes in the distribution of Glx in various brain tissue compartments in HIE. These findings may have important implications for understanding the pathophysiology of HIE and in the development of an effective therapeutic strategy toward preventing or limiting the immediate and long-term sequelae of HIE.
fig 4.
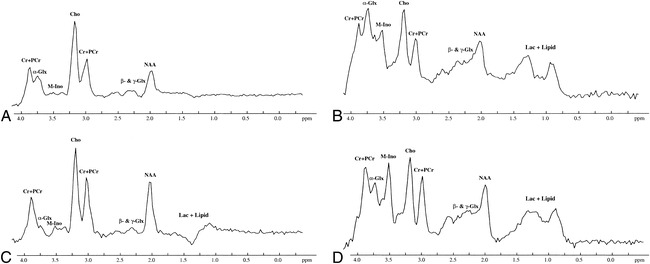
Initial and follow-up brain proton MRS studies in a neonate with moderate HIE performed at 4 and 15 days of age, respectively. The peaks of NAA, Cho, and (Cr + PCr) are clearly visible in all the MRS studies. M-Ino is clearly visible in both the initial and follow-up STEAM proton MRS studies, but is only barely seen on the PRESS proton MRS studies.
A, Initial PRESS proton MRS study (2000/135/250) shows an apparent α-Glx peak at 3.75 ppm.
B, Initial STEAM proton MRS study (2000/24/250) shows a remarkable α-Glx peak.
C and D, Follow-up PRESS (2000/135/250) (C) and STEAM (2000/24/250) (D) proton MRS studies show that the height of the α-Glx peak at 3.75 ppm is decreased as compared with that obtained on the initial proton MRS studies with both the PRESS and STEAM proton MRS sequences. Other peaks are similar on both the initial and follow-up PRESS and STEAM proton MRS studies. For abbreviations, see figure 1.
Footnotes
Supported by The Youth Science Foundation, The Ministry of Health of The People's Republic of China.
Address reprint requests to Yonglin Pu, MD, PhD, Research Imaging Center, University of Texas Health Science Center at San Antonio, 7703 Floyd Curl Dr, San Antonio, TX 78284.
References
- 1.Rivkin MJ. Hypoxic-ischemic brain injury in the term newborn: neuropathology, clinical aspects and neuroimaging. Clin Perinatol 1997;24:607-625 [PubMed] [Google Scholar]
- 2.Cotman CW, Iversen LL. Excitatory amino acids in the brain: focus on NMDA receptors. Trends Neurosci 1987;10:263-265 [Google Scholar]
- 3.Cataltepe O, Towfighi J, Vannucci RC. Cerebrospinal fluid concentrations of glutamate and GABA during perinatal cerebral hypoxia-ischemia and seizures. Brain Res 1996;709:326-330 [DOI] [PubMed] [Google Scholar]
- 4.Ottersen OP, Laake JH, Reichelt W, Haug FM, Torp R. Ischemic disruption of glutamate homeostasis in brain: quantitative immunocytochemical analyses. J Chem Neuroanat 1996;12:1-14 [DOI] [PubMed] [Google Scholar]
- 5.Erecinska M, Silver IA. Metabolism and role of glutamate in mammalian brain. Prog Neurobiol 1990;35:245-296 [DOI] [PubMed] [Google Scholar]
- 6.Philis JW, O'Regan MH. Mechanisms of glutamate and aspartate release in the ischemic rat cerebral cortex. Brain Res 1996;730:150-164 [DOI] [PubMed] [Google Scholar]
- 7.Kanthan R, Shuaib A, Griebel R, Miyashita H. Intracerebral human microdialysis: in vivo study of acute focal ischemic model of the human brain. Stroke 1995;26:870-873 [DOI] [PubMed] [Google Scholar]
- 8.Hajek M, Do KQ, Boesiger P, Wieser HG. Increased excitatory amino acid levels in brain cysts of epileptic patients. Epilepsy Res 1997;28:245-254 [DOI] [PubMed] [Google Scholar]
- 9.Podell M, Hadjiconstantinou M. Cerebrospinal fluid gamma-aminobutyric acid and glutamate values in dogs with epilepsy. Am J Vet Res 1997;58:451-456 [PubMed] [Google Scholar]
- 10.Rothman SM, Olney JW. Glutamate and the pathophysiology of hypoxic/ischemic brain damage. Ann Neurol 1986;19:105-111 [DOI] [PubMed] [Google Scholar]
- 11.Rothman SM, Olney JW. Excitotoxicity and the NMDA receptor. Trends Neurosci 1987;10:299-302 [DOI] [PubMed] [Google Scholar]
- 12.Choi D. Methods for antagonizing glutamate neurotoxicity. Cerebrovasc Brain Metab Rev 1990;2:105-147 [PubMed] [Google Scholar]
- 13.du Plessis AJ, Johnston MV. Hypoxic-ischemic brain injury in the newborn, cellular mechanisms and potential strategies for neuroprotection. Clin Perinatol 1997;24:627-654 [PubMed] [Google Scholar]
- 14.Mason GF, Pan JW, Ponder SL, Twieg DB, Pohost GM, Hetherington HP. Detection of brain glutamate and glutamine in spectroscopic images at 4.1 T. Magn Reson Med 1994;32:142-145 [DOI] [PubMed] [Google Scholar]
- 15.McConnell JR, Antonson DL, Ong CS, et al. Proton spectroscopy of brain glutamine in acute liver failure. Hepatology 1995;22:69-74 [PubMed] [Google Scholar]
- 16.Ross B, Michaelis T. Clinical application of magnetic resonance spectroscopy. Magn Reson Q 1994;10:191-247 [PubMed] [Google Scholar]
- 17.Bachelard H, Badar-Goffer R. NMR spectroscopy in neurochemistry. J Neurochem 1993;61:412-429 [DOI] [PubMed] [Google Scholar]
- 18.Rothman DL, Hanstock CC, Petroff OAC, Novotny EJ, Prichard JW, Shulman RG. Localized 1H MRS spectra of glutamate in human brain. Magn Reson Med 1992;25:94-106 [DOI] [PubMed] [Google Scholar]
- 19.Connelly A, Cross JH, Gadian DG, Hunter JV, Kirkham FJ, Leonard JV. Magnetic resonance spectroscopy shows increased brain glutamine in ornithine carbamoyl transferase deficiency. Pediatr Res 1993;33:77-81 [DOI] [PubMed] [Google Scholar]
- 20.Kauppinen RA, Williams SR. Nondestructive detection of glutamate by 1H nuclear magnetic resonance spectroscopy in cortical brain slices from the guinea pig: evidence for changes in detectability during severe anoxic insults. J Neurochem 1991;57:1136-1144 [DOI] [PubMed] [Google Scholar]
- 21.Kauppinen RA, Pirttila TRM, Auriola SOK, Williams SR. Compartmentation of cerebral glutamate in situ as detected by 1H and 13C n.m.r. Biochem J 1994;298:121-127 [DOI] [PMC free article] [PubMed] [Google Scholar]
- 22.Kreis R, Arcinue E, Ernst T, Shonk TK, Flores R, Ross BD. Hypoxic encephalopathy after near-drowning studied by quantitative 1H-magnetic resonance spectroscopy: metabolic changes and their prognostic value. J Clin Invest 1996;97:1142-1154 [DOI] [PMC free article] [PubMed] [Google Scholar]
- 23.Huppi PS, Barnes PD. Magnetic resonance techniques in the evaluation of newborn brain. Clin Perinatol 1997;24:693-723 [PubMed] [Google Scholar]
- 24.Penrice J, Cady EB, Lorek A, et al. Proton magnetic resonance spectroscopy of brain in normal preterm and term infants, and early changes following perinatal hypoxia-ischemia. Pediatr Res 1996;40:6-14 [DOI] [PubMed] [Google Scholar]
- 25.Groenendaal F, Veenhoven RH, Van Der Grond J, Jansen GH, Witkamp TD, De Vries LS. Cerebral lactate and N-acetyl-aspartate/choline ratios in asphyxiated full-term neonates demonstrated in vivo using proton magnetic resonance spectroscopy. Pediatr Res 1994;35:148-151 [DOI] [PubMed] [Google Scholar]
- 26.Peden CJ, Rutherford MA, Sargentoni J, Cox IJ, Bryant DJ, Dubowitz LMS. Proton spectroscopy of the neonatal brain following hypoxic-ischemic injury. Dev Med Child Neurol 1993;35:502-510 [DOI] [PubMed] [Google Scholar]
- 27.Hanrahan JD, Sargentoni J, Azzopardi D, et al. Cerebral metabolism within 18 hours of birth asphyxia: proton magnetic resonance spectroscopy study. Pediatr Res 1996;39:584-590 [DOI] [PubMed] [Google Scholar]
- 28.Peden CJ, Cowan FM, Bryant DJ, et al. Proton MR spectroscopy of brain in infants. J Comput Assist Tomogr 1990;14:886-894 [DOI] [PubMed] [Google Scholar]
- 29.Cady EB, Amess P, Penrice J, Wylezinska M, Sams V, Wyatt JS. Early cerebral-metabolite quantification in perinatal hypoxic-ischemic encephalopathy by proton and phosphorus magnetic resonance spectroscopy. Magn Reson Imaging 1997;15:605-611 [DOI] [PubMed] [Google Scholar]
- 30.Bottomley PA. Spatial localization in NMR spectroscopy in vivo.. Ann N Y Acad Sci 1987;508:333-348 [DOI] [PubMed] [Google Scholar]
- 31.Frahm J, Bruhn H, Gyngell ML, Merboldt KD, Hanicke W, Sauter R. Localized high-resolution proton NMR spectroscopy using stimulated echoes: initial applications to human brain in vivo. Magn Reson Med 1989;9:79-93 [DOI] [PubMed] [Google Scholar]
- 32.Haase A, Frahm J, Matthaei D, et al. MR imaging using stimulated echoes (STEAM). Radiology 1986;160:787-790 [DOI] [PubMed] [Google Scholar]
- 33.Sarnat HBO, Sarnat MS. Neonatal encephalopathy following fetal distress: a clinical and electroencephalographic study. Arch Neurol 1976;33:696-705 [DOI] [PubMed] [Google Scholar]
- 34.Barkovich AJ. MR and CT evaluation of profound neonatal and infantile asphyxia. AJNR Am J Neuroradiol 1992;13:959-972 [PMC free article] [PubMed] [Google Scholar]
- 35.Dambska M, Dydyk L, Szreter T, Wozniewicz J, Myers RE. Topography of lesions in newborn and infant brains following cardiac arrest and resuscitation: damage to brain and hemispheres. Bio Neonate 1976;29:194-206 [DOI] [PubMed] [Google Scholar]
- 36.Leech RW, Alvordm EC Jr. Anoxic-ischemic encephalopathy in human neonatal period. Arch Neurol 1977;34:109-113 [DOI] [PubMed] [Google Scholar]
- 37.Schneider H, Ballowitz L, Schachinger H, Hanefeld F, Droszus JU. Anoxic encephalopathy with predominant involvement of basal ganglia, brain stem and spinal cord in perinatal period: report on seven newborns. Acta Neuropathol 1975;32:287-298 [DOI] [PubMed] [Google Scholar]
- 38.Ernst T, Hennig J. Improved water suppression of localized in vivo 1H spectroscopy. J Magn Reson B 1995;106:181-186 [DOI] [PubMed] [Google Scholar]
- 39.de Graaf AA, Bovee WMM. Improved quantification of in vivo1H NMR spectra by optimization of signal acquisition and processing and by incorporation of prior knowledge into spectral fitting. Magn Reson Med 1990;15:305-319 [DOI] [PubMed] [Google Scholar]
- 40.Govindaraju V, Basus VJ, Matson GB, Maudsley AA. Measurement of chemical shifts and coupling constants for glutamate and glutamine. Magn Reson Med 1998;39:1011-1013 [DOI] [PubMed] [Google Scholar]
- 41.Erecinska M, Nelson D, Wilson DF, Silver IA. Neurotransmitter amino acids in the CNS, I: regional changes in amino acid levels in rat brain during ischemia and reperfusion. Brain Res 1984;304:9-22 [DOI] [PubMed] [Google Scholar]
- 42.Hagberg H, Lehmann A, Sandberg M, Nystrom B, Jacobson I, Hamberger A. Ischemia-induced shift of inhibitory and excitatory amino acids from intra- to extra-cellular compartments. J Cereb Blood Flow Metab 1985;5:413-419 [DOI] [PubMed] [Google Scholar]
- 43.Spisni A. 1D Spectrum analysis. In: De Certaines JD, Bovee WWMJ, Podo F, eds. Magnetic Resonance Spectroscopy in Biology and Medicine. Oxford: Pergramon; 1992:31-58 [Google Scholar]
- 44.Cady EB. Clinical Magnetic Resonance Spectroscopy.. New York: Plenum; 1990:47-81 [Google Scholar]
- 45.Mathur-De Ver R, Delporte C. Relaxation times of relevant nuclei in biological systems. In: De Certaines JD, Bovee WWMJ, Podo F, eds. Magnetic Resonance Spectroscopy in Biology and Medicine. Oxford: Pergramon; 1992:77-96 [Google Scholar]
- 46.Moonen CT, von Kienlin M, van Zijl PC, et al. Comparison of single-shot localization methods (STEAM and PRESS) for in vivo proton NMR spectroscopy. NMR Biomed 1989;2:201-208 [DOI] [PubMed] [Google Scholar]
- 47.Benveniste H, Warner D. The role of glutamatergic neurotransmission in ischemic brain damage. In: Ginsberg MD, Bogousslavslky J, eds. Cerebrovascular Disease, Pathophysiology, Diagnosis and Management. Malden, MA: Blackwell Science; 1998:393-402 [Google Scholar]
- 48.Meldrum BS. Antagonism of excitatory amino acids. In: Ginsberg MD, Bogousslavslky J, eds. Cerebrovascular Disease, Pathophysiology, Diagnosis and Management. Malden, MA: Blackwell Science; 1998:682-692 [Google Scholar]
- 49.Stasheff SF, Anderson WW, Clerk S, Wilson WA. NMDA antagonists differentiate epileptogenesis from seizure expression in an in vitro model. Science 1989;245:648-651 [DOI] [PubMed] [Google Scholar]
- 50.Hu RQ, Davies JA. Glutamate receptor antagonists reduce spontaneous epileptiform activity in cortical wedge prepared from DBA/2 mice. Exp Brain Res 1997;115:311-318 [DOI] [PubMed] [Google Scholar]
- 51.Mukherji SK. Clinical Applications of MR Spectroscopy.. New York: Wiley; 1998:1-32 [Google Scholar]
- 52.Ernst T, Hennig J. Coupling effects in volume selective 1H spectroscopy of major brain metabolites. Magn Reson Med 1991;21:82-96 [DOI] [PubMed] [Google Scholar]