

Abstract
BACKGROUND AND PURPOSE: Hyperintensity in the posterior limb of the internal capsule at T2-weighted MR imaging, consistent with corticospinal tract (CST) degeneration, is described in amyotrophic lateral sclerosis (ALS). However, the lack of specific tests or biological markers hinders confirmation of the diagnosis, especially in the early stages. We investigated the CST in ALS with MR imaging.
METHODS: We examined 25 patients (14 men, 11 women; mean age, 49.1 years; range, 29–68 years) and 21 age- and sex-matched control subjects without upper motor neuron signs. According to the revised El Escorial criteria, 22 patients had definite ALS; two, probable ALS; and one, suspected ALS. Fluid-attenuated inversion recovery (FLAIR; TR/TE/TI, 11,000/140/2600) and T1-weighted spin-echo (SE)/magnetization transfer contrast-enhanced (MTC; TR/TE, 510/12) imaging was performed at 1 T. Two experienced neuroradiologists blinded to the patients’ history independently evaluated the CST.
RESULTS: T1-weighted SE MTC imaging allowed visualization of the CST in both patients and control subjects. T1-weighted SE MTC images showed hypointensity along the CST and bilateral subcortical regions of the precentral gyri in all control subjects and hyperintensity in 80% of patients with ALS (P < .05). FLAIR images showed hyperintensity in these areas in both groups, with no significant difference.
CONCLUSION: T1-weighted SE MTC imaging is sensitive and accurate in depicting CST lesions in ALS, whereas FLAIR imaging is not. T1-weighted SE MTC imaging is useful in diagnosing ALS by showing hyperintense areas along the CST, which separates patients from control subjects. This sequence should be included in the workup of patients with weakness and pyramidal signs.
Amyotrophic lateral sclerosis (ALS), also known as Lou Gehrig disease, is a chronic degenerative neurologic disease characterized by the selective involvement of the motor system. Clinically, patients present with upper motor neuron (UMN) and lower motor neuron compromise. Degeneration of the UMN in the cerebral cortex is one of the main pathologic changes in ALS. These changes lead to corticospinal tract (CST) degeneration from the precentral gyrus, passing through the internal capsule, cerebral peduncles, brain stem, and spinal cord (1, 2). Patients with ALS usually present in the 6th decade of life, and the disease invariably leads to death, usually within 3–5 years of onset (3). Men are more often affected than are women, with a ratio of 1.5:1 (1).
Hyperintense areas in the posterior limb of the internal capsule on T2-weighted MR images, consistent with CST degeneration, are described in ALS and primary lateral sclerosis (4, 5). The clinical diagnosis is believed to be correct in up to 95% of cases. However, the lack of a specific test or biologic marker for UMN compromise hinders the ability to confirm the diagnosis or to exclude other diseases, especially in the early stages of ALS (6–8).
The purpose of our study was to evaluate the signal intensity (SI) of the CST and the cortical and subcortical regions of the precentral gyrus on MR images in patients with ALS and in a sex- and age-matched control group. For this, we assessed images obtained with fluid-attenuated inversion recovery (FLAIR) and T1-weighted spin-echo (SE) magnetization transfer contrast (MTC) sequences.
Methods
Our institutional review board approved this study, and informed consent was obtained from all participants. MR imaging examinations were performed between April 2000 and October 2001. Of the initial 31 patients in the ALS group, six were excluded from analysis. One had definite ALS but also heart disease and hypertension, with extensive SI changes in the white matter that impaired evaluation of the CST. Two patients were lost to follow-up, and three had a final diagnosis other than ALS. The remaining 25 patients with ALS had a mean age of 49.1 years (range, 29–68 years). The 21 age- and sex-matched subjects in the control group had a mean age of 49.9 years (range, 26–70 years). The ALS group included 14 women and 11 men, and the control group had 11 women and 10 men. None of the control subjects had any neurologic symptoms attributable to motor neuron disease or its differential diagnoses. Exclusion criteria for the control group were signs or symptoms of cervical spinal cord compromise, severe motor weakness, or parenchymal lesions. Patients with advanced liver or cerebrovascular disease were excluded from either group.
Axial FLAIR (TR/TE/TI, 11,000/140/2600) and T1-weighted SE MTC (TR/TE, 510/12; MTC pulse on resonance) sequences were performed by using a 1T MR imaging unit (Gyroscan T10-NT; Philips, Best, the Netherlands). FLAIR (9) and T1-weighted SE MTC (10) parameters were identical to those used in previously published series.
Two neuroradiologists (A.J.R., A.C.M.M.) experienced in the interpretation of images obtained with both sequences evaluated the SI of the CST in the centrum semiovale, internal capsule, and brain stem, as well as in the cortical and subcortical regions of the precentral gyrus. SI in these locations was compared with that of the adjacent white matter. At the time of imaging, the patients with ALS had symptoms for an average of 11 months with a range of 3–30 months (Fig 1). Their final diagnoses were clinically established by using the revised El Escorial criteria (11). Both neuroradiologists were blinded to the patients’ clinical histories. They independently evaluated the SI of the CST with each sequence in isolation twice and at different times to decrease recall and to control for intraobserver variation.
Fig 1.

Time of MR imaging in relation to onset of symptoms in patients with clinically suspected ALS. Boxes indicate final clinical diagnoses according to revised El Escorial criteria.
The data were evaluated with the chi-square or Fisher exact test depending on the number of patients involved. Differences in the measured averages (e.g., for age) were compared with the Student t test. P values <.05 were considered to indicate a significant difference.
Results
Tables 1–4 list the SIs at the various CST locations on FLAIR and T1-weighted SE MTC images, as rated by the two observers. Figures 2–5 illustrate representative cases and findings in patients with ALS and control subjects.
TABLE 1:
SI findings along the CST on FLAIR imaging by observer
| Location and Group | Observer 1 |
Observer 2 |
||||||
|---|---|---|---|---|---|---|---|---|
| Hypointensity | Isointensity | Hyperintensity | P Value | Hypointensity | Isointensity | Hyperintensity | PValue | |
| Centrum semiovale | .99 | .37 | ||||||
| ALS | 0 | 3(12) | 22(88) | 1(4) | 0 | 24(96) | ||
| Control | 0 | 2(9.5) | 19(90.5) | 0 | 0 | 21(100) | ||
| Internal capsule | .99 | .99 | ||||||
| ALS | 0 | 1(4) | 24(96) | 0 | 1(4) | 24(96) | ||
| Control | 0 | 0 | 21(100) | 0 | 0 | 21(100) | ||
| Brainstem | .39 | .58 | ||||||
| ALS | 0 | 18(72) | 7(28) | 0 | 15(60) | 10(40) | ||
| Control | 0 | 19(90.5) | 2(9.5) | 0 | 16(76) | 5(24) | ||
Note.—Numbers in parentheses are percentages.
TABLE 2:
SI findings along the CST on T1 SE/MTC imaging by observer
| Location and Group | Observer 1 |
Observer 2 |
||||||
|---|---|---|---|---|---|---|---|---|
| Hypointensity | Isointensity | Hyperintensity | P Value | Hypointensity | Isointensity | Hyperintensity | P Value | |
| Centrum semiovale | <.001 | <.001 | ||||||
| ALS | 5(20) | 0 | 20(80) | 5(20) | 0 | 20(80) | ||
| Control | 21(100) | 0 | 0 | 21(100) | 0 | 0 | ||
| Internal capsule | <.001 | <.001 | ||||||
| ALS | 5(20) | 0 | 20(80) | 5(20) | 0 | 20(80) | ||
| Control | 21(100) | 0 | 0 | 21(100) | 0 | 0 | ||
| Brainstem | <.001 | <.001 | ||||||
| ALS | 8(32) | 17(68) | 0 | 10(40) | 15(60) | 0 | ||
| Control | 21(100) | 0 | 0 | 21(100) | 0 | 0 | ||
Note.—Numbers in parentheses are percentages.
TABLE 3:
FLAIR and T1 SE/MTC SI findings in precentral cortical and subcortical regions by both observers
| Precentral Gyral Location and Group | FLAIR |
T1 SE/MTC |
||||||
|---|---|---|---|---|---|---|---|---|
| Hypointensity | Isointensity | Hyperintensity | P Value | Hypointensity | Isointensity | Hyperintensity | P Value | |
| Cortical | .735 | <.001 | ||||||
| ALS | 6(24) | 19(76) | 0 | 0 | 5(20) | 20(80) | ||
| Control | 4(19) | 17(81) | 0 | 0 | 21(100) | 0 | ||
| Subcortical | .966 | <.001 | ||||||
| ALS | 0 | 19(75) | 6(24) | 5(20) | 0 | 20(80) | ||
| Control | 0 | 15(71) | 6(29) | 21(100) | 0 | 0 | ||
Note.—Numbers in parentheses are percentages.
TABLE 4:
Relationship between age and motor dark line
| Motor Dark Line | ALS | Control | Mean Age (y) | SD |
|---|---|---|---|---|
| Absent | 19(76) | 17(81) | 47.39 | 12.28 |
| Present | 6(24) | 4(19) | 56.90 | 13.44 |
Note.—Observers 1 and 2 had identical interpretations. Numbers in parentheses are percentages. P = .039.
Fig 2.

MR images of the precentral gyri.
A and B, Control subject. Cortical and subcortical precentral gyral isointensity on FLAIR image (arrows in A) and precentral subcortical hypointensity on T1-weighted SE MTC image (arrows in B) .
C, Patient with definite ALS. Pathologic hyperintensity (arrows) in the cortical and subcortical regions of the precentral gyri on T1-weighted SE MTC image.
Fig 3.

MR images of the CST in the centrum semiovale.
A and B, Control subject. Hyperintensity on FLAIR image (arrows in A) and hypointensity on T1-weighted SE MTC image (arrows in B) in the region of the CST in the centrum semiovale.
C–E, Patient with definite ALS. FLAIR image is unremarkable (C). Pathologic hyperintensity in the regions of the centrum semiovale, periventricular regions on T1-weighted SE MTC images (arrows in D and E).
Fig 4.

MR images of the CST in the internal capsule.
A and B, Control subject. Hyperintensity on FLAIR image (arrows in A) and hypointensity on T1-weighted SE MTC image (arrows in B) in the region of the CST in the internal capsule.
C, Patient with definite ALS. Pathologic hyperintensity (arrows) in the same region on a T1-weighted SE MTC image.
Fig 5.
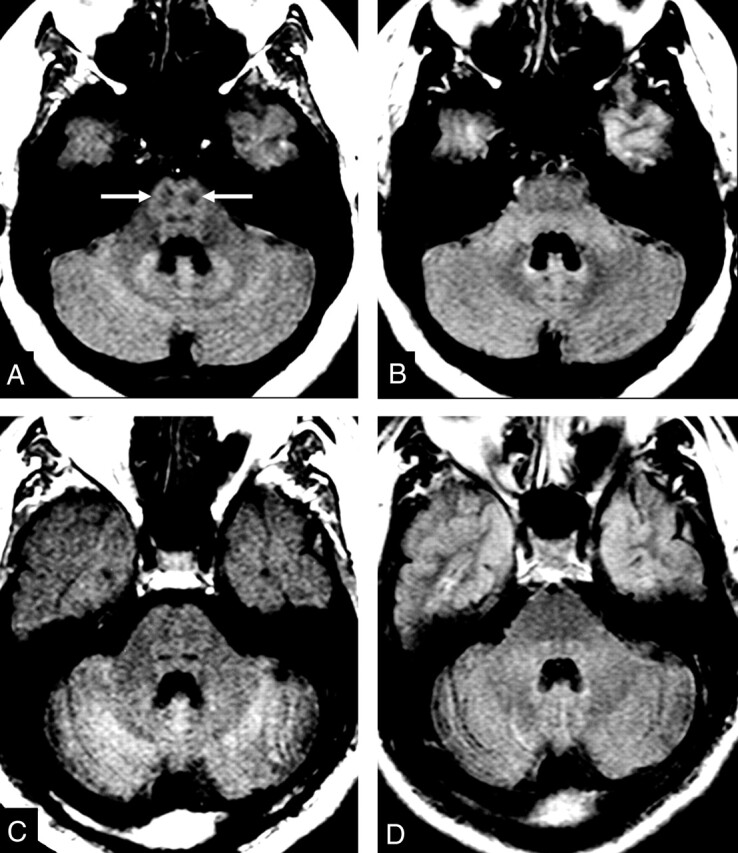
MR images of the CST in the brain stem.
A and B, Control subject. Hypointensity in the region of the CST in the brain stem on T1-weighted SE MTC image (arrows in A). CST is not visible on FLAIR image (B).
C and D, Patient with definite ALS. Abnormal lack of hypointensity in the brain stem on T1-weighted SE MTC image (C). FLAIR image does not show any abnormality (D).
There was no statistical difference in SI grading in the CST in any of the segments with either FLAIR or T1-weighted SE MTC imaging (Tables 1–4), as determined by both observers. Both readers generated identical diagnoses regarding the presence or absence of CST compromise, suggesting the diagnosis of ALS with T1-weighted SE MTC imaging findings. In 20 patients, both observers correctly identified ALS on the basis of abnormally high SI in the CST on T1-weighted SE MTC findings, and all of the 20 had presented with definite ALS on clinical grounds (Tables 2 and 3). SI changes in the CST at T1-weighted SE MTC imaging were bilateral and symmetrical in all cases, regardless of the eventual unilateral preponderance of clinical compromise. On T1-weighted SE MTC images, none of the 21 control subjects showed SI changes in the CST, and only five of the patients with ALS had no SI changes in the CST (two definite ALS cases, two probable ALS cases, and one suspected ALS case).
T1-weighted SE MTC imaging was more sensitive in the supratentorial compartment, from the precentral cortex to the internal capsule (80% sensitivity for each observer), as opposed to the brain stem (68–60% sensitivity for observers 1 and 2). T1-weighted SE MTC imaging had a sensitivity of 80% and a specificity of 100% for the diagnosis of ALS in this highly selected group of patients (Tables 2 and 3).
Discussion
The diagnosis of ALS is based on the revised El Escorial criteria, which use only MR imaging results to rule out other diseases that may simulate ALS or hinder its diagnosis (11). Recent advances in MR imaging, such as magnetization transfer and spectroscopy, have created opportunities to improve the evaluation of patients with ALS, especially for those undergoing clinical trials (12, 13).
Degeneration of the entire CST occurs in approximately 47% of necropsy specimens from ALS patients (1); however, the demonstration of such abnormalities is limited on routine MR images (14, 15).
The precentral gyrus is the anatomic origin of most of the CST fibers. At imaging, the precentral and postcentral gyri may be identified on images by some landmarks, such as the adjacent sulci (16). We observed slightly decreased SI of the cortex of the precentral and postcentral gyri on FLAIR images in relation to the remainder of the cortex in patients and control subjects; this difference allowed their identification regardless of anatomic landmarks. Karaarslan and Arslan (17) reported that the perirolandic cortex generally has a low SI in the neurologically normal brain on turbo FLAIR images.
Different groups have pointed out that a dark line along the posterior rim of the precentral gyrus (motor dark line) on T2-weighted and FLAIR images may indicate ALS and serve as a marker of disease progression (18–20). This pattern is not specific to ALS and can be found in healthy people and in those with other degenerative diseases (9, 21, 22).
Zhang et al (19) considered the motor dark line one of the major findings in patients with ALS and obtained better sensitivity in clinically verified ALS. However, our study showed no relation between the dark line along the posterior rim of the precentral gyrus and ALS on FLAIR images. Six patients with ALS (24%) and four control subjects (19%) had a motor dark line. That we observed the same pattern of this motor dark line in both the control subjects and ALS patients helps to confirm the lack of specificity of this finding.
Another important finding is the precentral subcortical hyperintensity on T2-weighted and FLAIR images (19, 20, 23). This is probably owing to ALS-related degenerative changes and contributes to the diagnosis of ALS in some studies (9, 19, 24). It is considered one of the major findings in patients with ALS (19). However, our analysis of FLAIR images did not allow a correct diagnosis of ALS.
Our results differ from those Zhang et al (19) reported probably because of differences between our samples. In our opinion, patient age and the stage of disease can interfere with results. Subcortical FLAIR hyperintensity in the precentral region can be found in healthy subjects and in patients with ALS, mainly in those clinically more affected; this is probably caused by a loss of myelinated fibers following motor neuron degeneration (20, 23).
According to Cheung et al (25), hyperintensity in the posterior third of the internal capsule is not seen on proton density–weighted images in healthy subjects. Peretti-Viton et al (26) showed no relationship between T2 hyperintensity and ALS. Some authors reported it in healthy individuals (27, 28), and Hecht et al (9) recommended caution in the evaluation of FLAIR images because they observed CST hyperintensity in both patients with ALS and control subjects. Gawne-Cain et al (29) studied the range of white matter appearances on FLAIR images obtained in healthy persons and showed increased SI in the CST region at the level of the internal capsule in all subjects; this change extended up toward the centrum semiovale and down to the pons.
In our study, both ALS patients and control subjects had hyperintensity in the CST on FLAIR images. Additionally, subcortical FLAIR hyperintensity was present in the same patients with the motor dark line; we consider these findings related to but nonspecific for ALS. They may represent pathologic changes, but they cannot be considered specific FLAIR signs of UMN compromise.
In several disease states, the magnetization transfer rate (MTR) may indicate the presence of structural changes in the tissue, even when SI changes are absent with conventional sequences (30, 31). Some authors have used MTR and showed that it was significantly smaller in the internal capsule of patients with ALS, implying the presence of tissue damage (32, 33). The quantitative technique of MTR measurement requires time-consuming postprocessing, and it is difficult to reproduce in clinical practice. In addition, the lack of focal SI changes in the CST on routine MR images impairs the placement of regions of interest, increasing the effect of volume averaging.
The decrease in MTR may be slight in experimental edematous lesions and substantial in the focal demyelinating multiple sclerosis lesions (34–36). It can be a helpful tool for studying ALS because edema and demyelination, especially in the early stages, are some of the pathologic findings caused by this disease (37). Additionally, the presence of lipid-laden macrophages and the accumulation of intra-axonal neurofilaments can also contribute to shortening of the T1 relaxation time (37–39).
To our knowledge, no prior reports describe the MTR of the subcortical precentral region, but one may presume that it may be decreased in ALS, since the precentral region is the origin of the CST. In a preliminary report, da Rocha et al (10) described increased SI in the CST in the centrum semiovale of five patients with ALS on T1-weighted SE MTC imaging. Few reports of T1 hyperintensity in the internal capsule in ALS exist (9, 38). Waragai et al (38) described this finding in five patients with ALS and paraparesis. As far as we know, this is the first report on the qualitative evaluation of the CST SI with an MT technique. Both observers were consistently able to distinguish patients with ALS from control subjects on the basis of visual inspection of the SI of the CST alone. In all control subjects, both observers could delineate the CST region on T1-weighted SE MTC images as a definite hypointensity from the subcortical white matter of the precentral gyrus to the brain stem. Conversely, hyperintensity in the same regions of the CST on T1-weighted SE MTC images was significantly associated with ALS. This pattern had a sensitivity of 80% in the diagnosis of ALS in our sample, and both observers were less accurate in the evaluation of the CST at the brain stem level.
The specificity of T1-weighted SE MTC imaging was 100%, and there were no false-positive results. Our false-negative findings occurred most commonly in patients with less severe compromise. Our only case of suspected ALS (based on revised El Escorial criteria) was considered normal on the basis of T1-weighted SE MTC imaging findings, but the patient had no clinical signs of UMN compromise.
At T1-weighted SE MTC imaging, the association of bilateral and symmetric hyperintensity of the CST, mainly in supratentorial segments, is typical of ALS. We believe that these alterations in the CST and in the subcortical regions of the precentral gyrus allow correct diagnosis on the basis of MR imaging findings. Our study lacks histopathologic correlation and did not allow us to identify the histologic basis for T1-weighted SE MTC hyperintensity in the CST.
We believe that CST hyperintensity on T1-weighted SE MTC images is not necessarily related to severe CST compromise. In fact, only one of our patients had paraparesis. In our opinion, the centrum semiovale and the precentral subcortical and cortical regions are the best locations in which to look for T1-weighted SE MTC hyperintensity, because they represent the largest transverse section of the CST in the central nervous system.
Differences in reported accuracies of various MR images may be related to differences in the number of patients evaluated, their stage of disease, and their individual rates of disease progression. It is important to acknowledge the progressive nature of ALS to understand the different imaging patterns with the various MR imaging sequences. Future research may even show different T1-weighted SE MTC patterns during the course of ALS. Our results suggest that the MR imaging detection of structural changes in the CST may become useful as a gauge of disease progression and possibly as a marker for monitoring the effects of different treatments in ALS. MR imaging is considered useful in the diagnosis of ALS by excluding other diseases. The addition of a T1-weighted SE MTC sequence may contribute to the early correct diagnosis of ALS, allowing the timely initiation of therapy or the patient’s admission to clinical trials (40). We believe that this sequence should be included in the workup of any patient with weakness and pyramidal signs. This technique might also be useful in assessing other neurologic diseases, including those affecting the CST; however, this assertion should be further evaluated.
Conclusion
T1-weighted SE MTC imaging shows distinctive SI patterns in the CST of both patients with ALS (who have increased SI) and control subjects (who have decreased SI). These patterns allow the anatomic delineation of the CST region and the detection of SI changes in all encephalic segments of the CST. Increased T1-weighted SE MTC SI along the CST has high sensitivity and specificity—80% and 100%, respectively, in our sample—and contributes to the detection of UMN compromise in ALS. This sequence may help in the early diagnosis of some cases, although possible differences in T1-weighted SE MTC SI patterns between early and advanced cases still have to be studied.
The SI of the CST on FLAIR images does not contribute to the diagnosis of ALS, because it was neither specific nor sensitive. Neither the motor dark line nor subcortical precentral hyperintensity on FLAIR imaging were useful for this purpose.
References
- 1.Brownwell B, Oppenheimer DR, Hughes JT. The central nervous system in motor neuron disease. J Neurol Neurosurg Psychiatry 1970;33:338–357 [DOI] [PMC free article] [PubMed] [Google Scholar]
- 2.Davidson CD. Amyotrophic lateral sclerosis: origin and extent of the upper motor neuron lesion. Arch Neurol 1941;46:1039–1056 [Google Scholar]
- 3.Havercamp LJ, Appel V, Appel SH. Natural history of amyotrophic lateral sclerosis in a database population: validation of a scoring system and a model for survival prediction. Brain 1995;118:707–719 [DOI] [PubMed] [Google Scholar]
- 4.Goodin DS, Rowley HA, Olney RK. Magnetic resonance imaging in amyotrophic lateral sclerosis. Ann Neurol 1988;23:418–420 [DOI] [PubMed] [Google Scholar]
- 5.Martí-Fabregas J, Pujol J. Selective involvement of the pyramidal tract on magnetic resonance imaging in primary lateral sclerosis. Neurology 1990;40:1799–1800 [DOI] [PubMed] [Google Scholar]
- 6.Rowland LP. Diagnosis of amyotrophic lateral sclerosis. J Neurol Sci 1998;160:S6–S24 [DOI] [PubMed] [Google Scholar]
- 7.Brooks BR. Diagnostic dilemmas in amyotrophic lateral sclerosis. J Neurol Sci 1999;165:S1–S9 [DOI] [PubMed] [Google Scholar]
- 8.Rowland LP, Shneider NA. Amyotrophic lateral sclerosis. N Engl J Med 2001;344:1688–1700 [DOI] [PubMed] [Google Scholar]
- 9.Hecht MJ, Fellner F, Fellner C, Hilz MJ, Heuss D, Neundörfer B. MRI-FLAIR images of the head show corticospinal tract alterations in ALS patients more frequently than T2-, T1- and proton-density-weighted images. J Neurol Sci 2001;186:37–44 [DOI] [PubMed] [Google Scholar]
- 10.da Rocha AJ, Maia Junior ACM, Nogueira RG, Lederman HM. Magnetic findings in amyotrophic lateral sclerosis using a spin echo magnetization transfer sequence. Preliminary report. Arq Neuropsiquiatr 1999;57:912–915 [DOI] [PubMed] [Google Scholar]
- 11.Brooks BR, Miller RG, Swash M, Munsat TL. El Escorial revisited: revised criteria for the diagnosis of amyotrophic lateral sclerosis. Amyotroph Lateral Scler Other Motor Neuron Disord 2000;1:293–299 [DOI] [PubMed] [Google Scholar]
- 12.Gelinas D. Effects of the early diagnosis of amyotrophic lateral sclerosis on the patient: advantages [Suppl]. Amyotroph Lateral Scler Other Motor Neuron Disord 2001;1:S73–S74 [DOI] [PubMed] [Google Scholar]
- 13.Dib Michel. Amyotrophic lateral sclerosis: progress and prospects for treatment. Drugs 2003;63:289–310 [DOI] [PubMed] [Google Scholar]
- 14.Guermazi A. Is the high signal intensity in the corticospinal tract a sign of degeneration? AJNR Am J Neuroradiol 1996;17:801–802 [PMC free article] [PubMed] [Google Scholar]
- 15.Comi G, Rovaris M, Leocani L. Neuroimaging in amyotrophic lateral sclerosis. Eur J Neurol 1999;6:629–637 [DOI] [PubMed] [Google Scholar]
- 16.Naidich TP, Blum JT, Firestone MI. The parasagittal line: an anatomical landmark for axial imaging. AJNR Am J Neuroradiol 2001;22:885–895 [PMC free article] [PubMed] [Google Scholar]
- 17.Karaarslan E, Arslan A. Perirolandic cortex of the normal brain: low signal intensity on turbo FLAIR MR images. Radiology 2003;227:538–541 [DOI] [PubMed] [Google Scholar]
- 18.Oba H, Araki T, Ohtomo K, et al. Amyotrophic lateral sclerosis: T2 shortening in motor cortex at MR imaging. Radiology 1993;189:843–846 [DOI] [PubMed] [Google Scholar]
- 19.Zhang L, Ulug AM, Zimmerman RD, Lin MT, Rubin M, Beal MF. The diagnostic utility of FLAIR imaging in clinically verified amyotrophic lateral sclerosis. J Magn Reson Imaging 2003;17:521–527 [DOI] [PubMed] [Google Scholar]
- 20.Hecht MJ, Fellner F, Fellner C, Hilz MJ, Neundorfer B, Heuss D. Hyperintense and hypointense MRI signals of the precentral gyrus and corticospinal tract in ALS: a follow-up examination including FLAIR images. J Neurol Sci 2002;199:59–65 [DOI] [PubMed] [Google Scholar]
- 21.Iwasaki Y, Ikeda K, Shiojima T, Tagaya M, Kurihara T, Kinoshita M. Clinical significance of hypointensity in the motor cortex on T2-weighted images. Neurology 1994;44:1181. [DOI] [PubMed] [Google Scholar]
- 22.Imon Y, Yamagushi S, Katayama S, et al. A decrease in cerebral cortex intensity on T2-weighted with ageing images of normal subjects. Neuroradiology 1998;40:76–80 [DOI] [PubMed] [Google Scholar]
- 23.Bowen BC, Pattany PM, Bradley WG, et al. MR imaging and localized proton spectroscopy of the precentral gyrus in amyotrophic lateral sclerosis. AJNR Am J Neuroradiol 2000;21:647–658 [PMC free article] [PubMed] [Google Scholar]
- 24.Thorpe JW, Moseley IF, Hawkes CH, MacManus DG, McDonald WI, Miller DH. Brain and spinal cord MRI in motor neuron disease. J Neurol Neurosurg Psychiatry 1996;61:314–317 [DOI] [PMC free article] [PubMed] [Google Scholar]
- 25.Cheung G, Gawal MJ, Cooper PW, Farb RI, Ang LC. Amyotrophic lateral sclerosis: correlation of clinical and MR imaging findings. Radiology 1995;194:263–270 [DOI] [PubMed] [Google Scholar]
- 26.Peretti-Viton P, Azulay JP, Trefouret S, et al. MRI of the intracranial corticospinal tracts in amyotrophic and primary lateral sclerosis. Neuroradiology 1999;41:744–749 [DOI] [PubMed] [Google Scholar]
- 27.Mirowitz S, Sartor K, Gado M, Torack R. Focal signal-intensity variations in the posterior limb of the internal capsule: normal MR findings and distinction from pathologic findings. Radiology 1989;172:535–539 [DOI] [PubMed] [Google Scholar]
- 28.Hajnal JV, Brjant DJ, Kasuboski L, et al. Use of fluid attenuated inversion recovery (FLAIR) pulse sequences in MRI of the brain. J Comput Assist Tomogr 1992;16:841–844 [DOI] [PubMed] [Google Scholar]
- 29.Gawne-Cain ML, Silver NC, Moseley IF, Miller DH. Fast FLAIR of the brain: the range of appearances in normal subjects and its application to quantification of white-matter disease. Neuroradiology 1997;39:243–249 [DOI] [PubMed] [Google Scholar]
- 30.de Souza NM, Hajnal JV, Baudouin CJ. Potential for increasing conspicuity of short-T1 lesions in the brain using magnetization transfer imaging. Neuroradiology 1995;37:278–283 [DOI] [PubMed] [Google Scholar]
- 31.Loevner LA, Grossman RI, Cohen JA, Lexa JL, Kessler D, Kobson DL. Microscopic disease in normal-appearing white matter on conventional MR images in patients with multiple sclerosis: assessment with magnetization transfer measurements. Radiology 1995;196:511–515 [DOI] [PubMed] [Google Scholar]
- 32.Kato Y, Matsumura K, Kinosoda Y, Narita Y, Kusuhara S, Nakagawa T. Detection of pyramidal tract lesions in amyotrophic lateral sclerosis with magnetization-transfer measurements. Am J Neurol 1997;18:1541–1547 [PMC free article] [PubMed] [Google Scholar]
- 33.Tanabe JL, Wermathen M, Miller R, Gelinas D, Weiner MW, Rooney WD. Reduced MTR in the corticospinal tract and normal T2 in amyotrophic lateral sclerosis. Magn Reson Imaging 1998;16:1163–1168 [DOI] [PMC free article] [PubMed] [Google Scholar]
- 34.Mehta RC, Pike GB, Enzmann DR. Measure of magnetization transfer in multiple sclerosis demyelinating plaques, white matter ischemic lesions, and edema. AJNR Am J Neuroradiol 1996;17:1051–1055 [PMC free article] [PubMed] [Google Scholar]
- 35.Dousset V, Grossmann RI, Ramer KN, et al. Experimental allergic encephalomyelitis and multiple sclerosis: lesion characterization with magnetization transfer imaging. Radiology 1992;182:483–491 [DOI] [PubMed] [Google Scholar]
- 36.Tomiak MM, Rosenblum JD, Prager JM, Metz CE. Magnetization transfer: a potential method to determine the age of multiple sclerosis lesions. AJNR Am J Neuroradiol 1994;15:1569–1574 [PMC free article] [PubMed] [Google Scholar]
- 37.Iwanaga K, Hayashi S, Oyake M, et al. Neuropathology of sporadic amyotrophic lateral sclerosis of long duration. J Neurol Sci 1997;146:139–143 [DOI] [PubMed] [Google Scholar]
- 38.Waragai M. MRI and clinical features in amyotrophic lateral sclerosis. Neuroradiology 1997;39:847–851 [DOI] [PubMed] [Google Scholar]
- 39.Okamoto K, Hirai S, Shoji M, Senoh Y, Yamazaki T. Axonal swelling in the corticospinal tract in amyotrophic lateral sclerosis. Acta Neuropathol 1990;80:222–226 [DOI] [PubMed] [Google Scholar]
- 40.Belsh JM. Diagnostic challenges in ALS [Suppl]. Neurology 1999;53:S26–S30; discussion S35–S36 [PubMed] [Google Scholar]