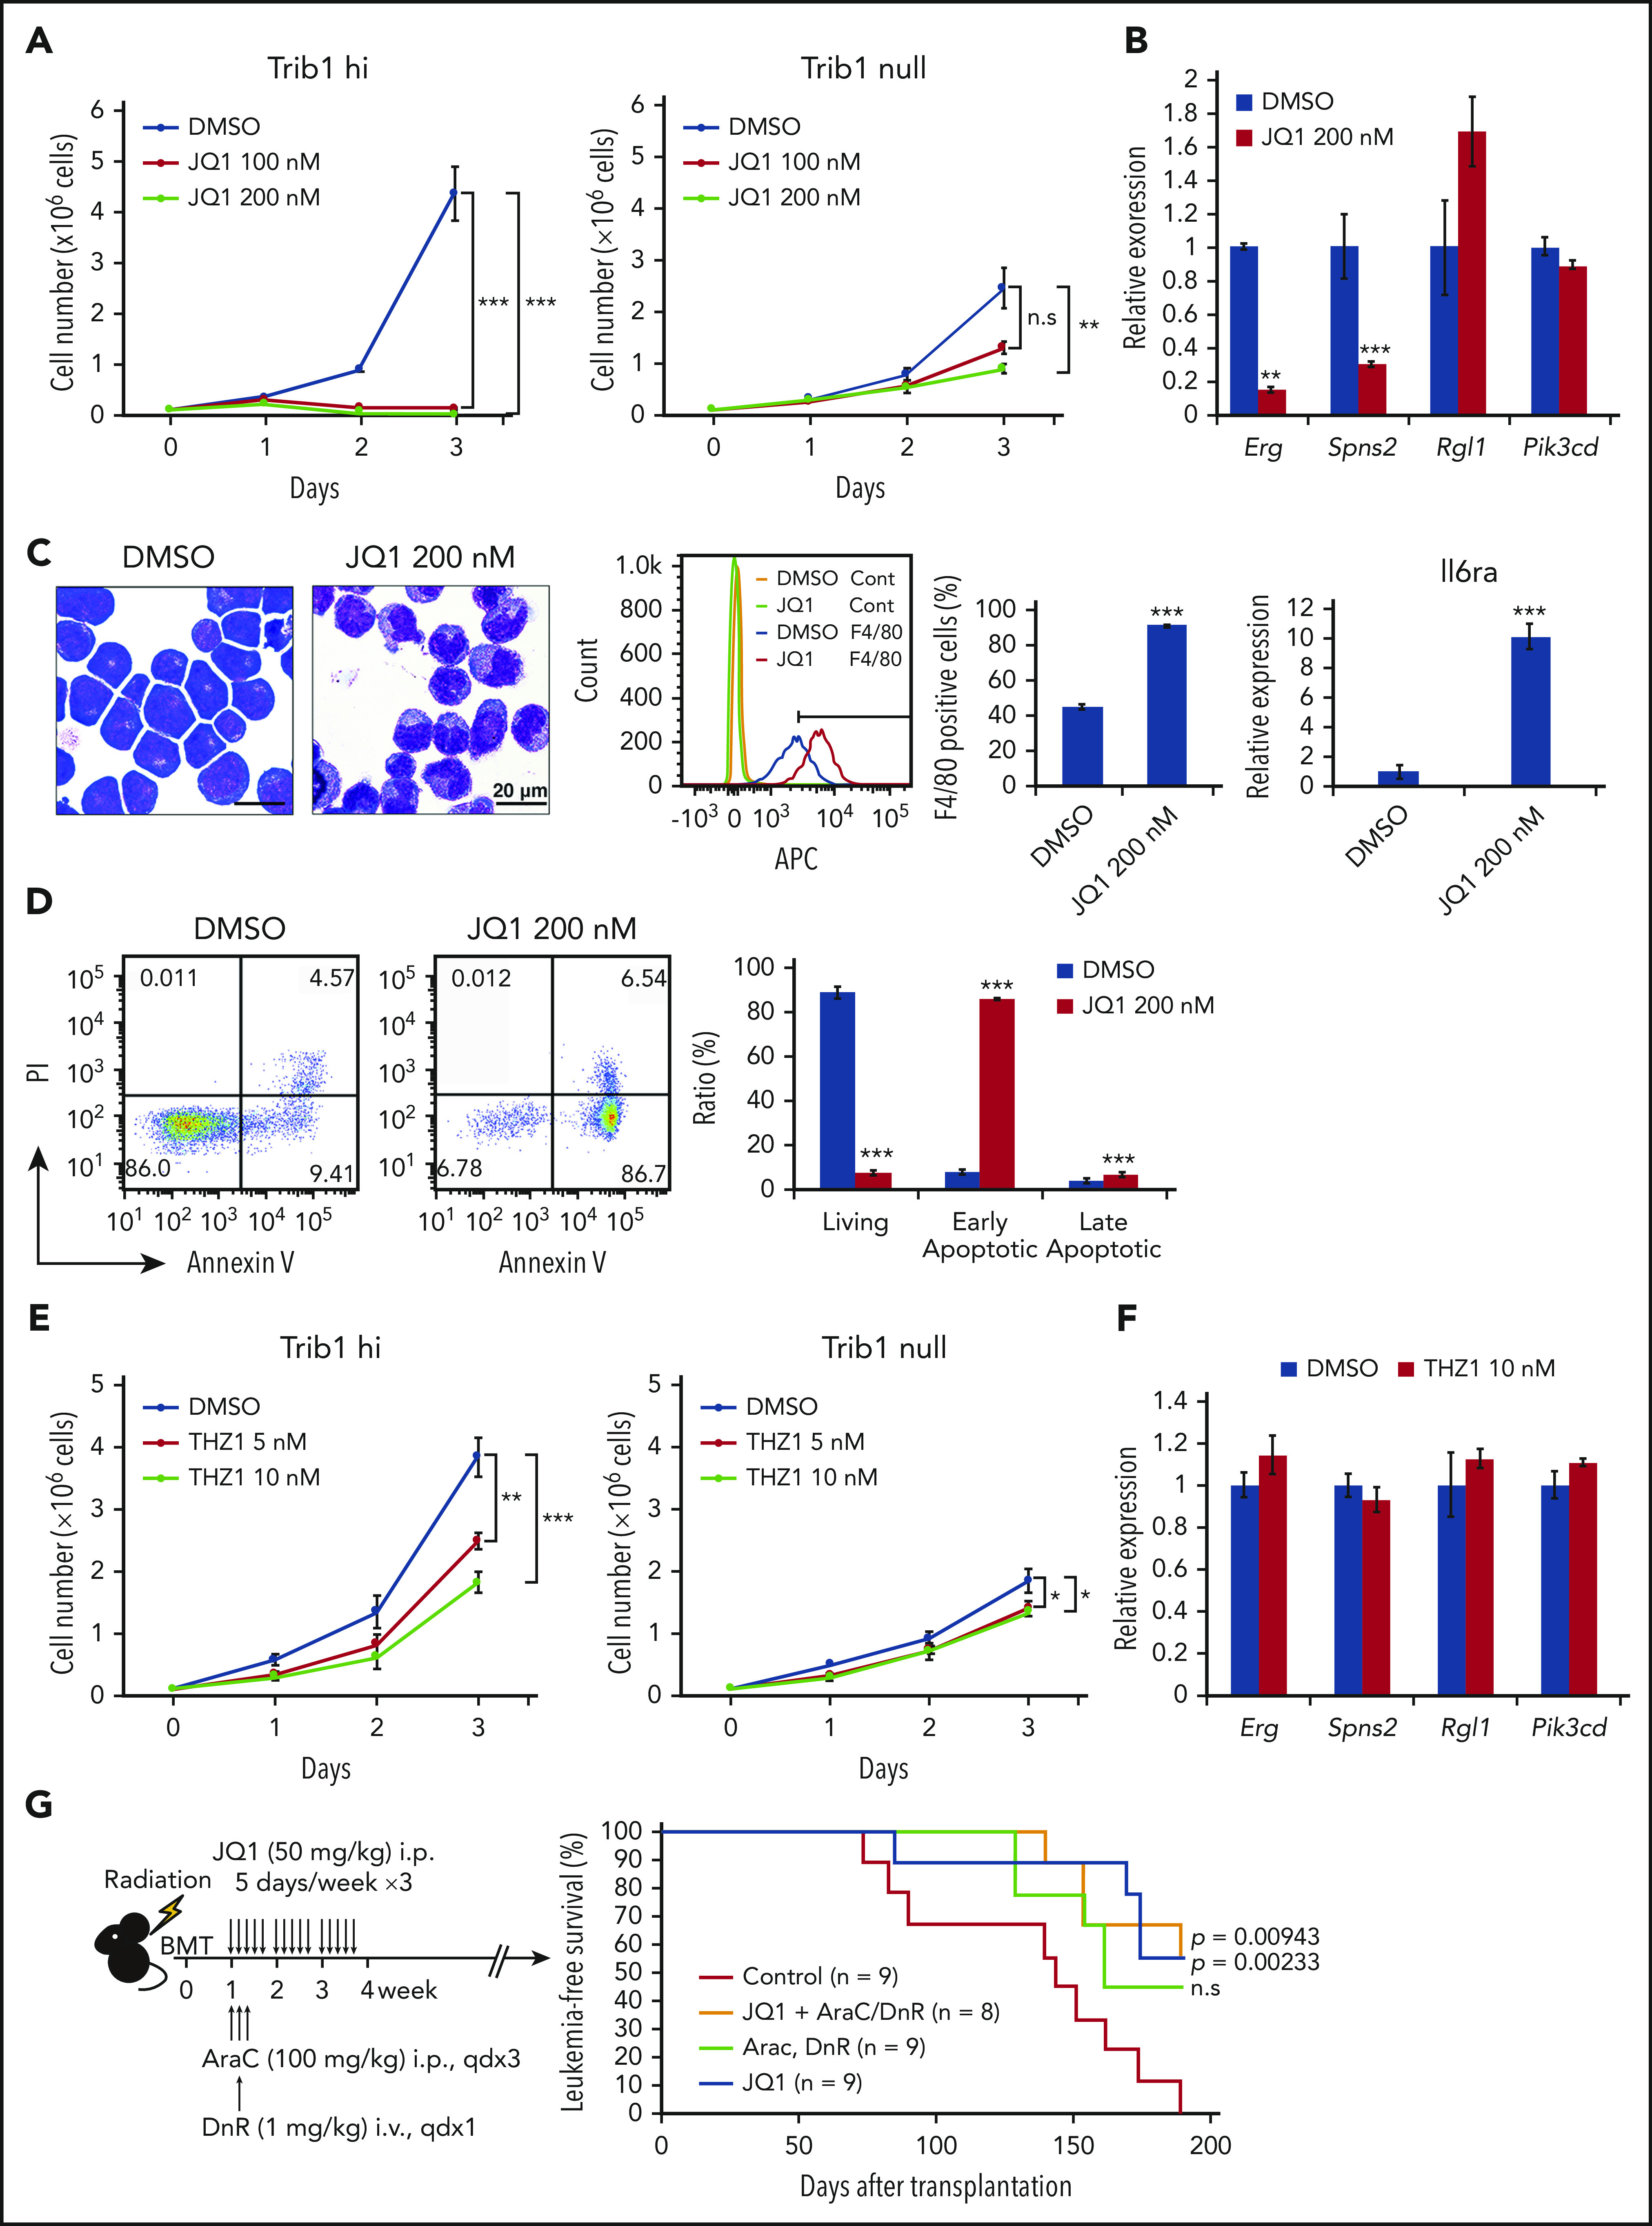
Figure 6.

JQ1 treatment inhibits the growth of Trib1 hi AML and leads to Erg downregulation. (A) Growth of Trib1 hi (left) and null (right) cells treated with JQ1 or vehicle. (B) Quantitative RT-PCR showing downregulation of Erg and Spns2 but not Rgl1 and Pik3cd expression after JQ1 treatment. (C) Monocytic differentiation of Trib1 hi cells by JQ1 treatment of 24 hours. Left, Giemsa staining; center, flow cytometric analysis for F4/80 expression. The isotype control-stained cells are indicated as yellow and green histograms. F4/80-positive fractions are quantitated as bar graphs; right, qRT-PCR for Il6ra expression. Scale bar: 20 μm. (D) Detection of early apoptosis induced by JQ1 treatment of 48 hours. Annexin V staining shows a significant increase in early apoptotic cells, as evidenced by flow cytometry (left). Bar graphs show an increase in both early and late apoptotic cells (right). (E) Growth of Trib1 hi (left) and null (right) cells treated with THZ1 or vehicle. (F) Quantitative RT-PCR shows no significant changes in target gene expression by THZ1 treatment. (G) In vivo treatment of mice bearing AML with JQ1 and with or without cytarabine (AraC) and daunorubicin (DnR). Schematic illustration of the experiment (left). Kaplan-Meier survival curves showing improvement of survival with JQ1 treatment and with or without AraC and DnR. ** P < .01, *** P < .001. BMT, bone marrow transplant; i.p., intraperitoneal; PI, propidium iodide.
