Abstract
BACKGROUND AND PURPOSE: Although rare, cerebral venous thrombosis (CVT) is being diagnosed more frequently owing to improved imaging techniques. The venous infarcts caused by CVT in 50% of patients are largely reversible and differ from arterial stroke. Our purpose was to study the time-dependent changes of venous infarcts on MR images and to define the variables that influence lesion volume in humans.
METHODS: MR images and venous angiograms were evaluated in 15 consecutive patients with venous infarcts due to CVT of sinus, cortical, or internal veins. All patients were treated with intravenous dose-adjusted heparin followed by oral anticoagulation for 12 months. Reduction of signal intensity changes on T1- and T2-weighted images was correlated to the degree of recanalization, age, initial absolute lesion size, and hemorrhage.
RESULTS: Within the first 30 days, we found a significant correlation between the volume of the lesion on T1-weighted images and recanalization. However, early recanalization did not influence the final lesion volume after 12 months. Eleven patients showed complete resolution of changes on T1- and T2-weighted images. Age of the patients influenced initial absolute volume of brain damage.
CONCLUSION: In venous stroke, even large parenchymal changes can resolve completely independent from recanalization of the thrombosed veins and sinuses. A plausible hypothesis is that venous infarcts largely consist of a persistent edema and that the lesion volume is influenced by the development of collateral veins. However, further investigations are necessary to understand the underlying abnormal mechanisms.
Cerebral venous thrombosis (CVT) is a rare disease, yet in recent years has been more frequently diagnosed owing to improved imaging techniques. In about 50% of patients, CVT causes venous infarcts (1). On the basis of clinical observation, however, this brain damage seems to be largely reversible and differs from arterial stroke. The pathophysiologic characteristics of venous stroke and edema are currently not completely understood (2–4); also, to our knowledge, systematic studies on the long-term development of such lesions are not available.
In this study, we analyzed imaging data of 15 consecutive patients with venous infarcts due to cortical, internal cerebral vein, or sinus thrombosis and a follow-up of up to 23 months. Our aim was to study the time-dependent changes of venous infarcts on MR images and to define the variables that influence lesion volume in humans.
Methods
Patients
The MR imaging data of 15 consecutive patients (14 women, one man; mean age, 39 years; age range, 18–78 years) with CVT and brain parenchymal damage were reviewed. Demographic data of the patient cohort are summarized in the Table.
Patient demographic data, affected sinuses and veins, and reduction of lesion volume at follow-up
| Patient No./Age (y)/Sex | Location of Thrombosis | Recanalization on First Follow-up | Follow-up Time (mo) | Parenchymal Damage | Hemorrhage | Reduction of Lesion Volume (%) Compared to Initial Study |
|||||
|---|---|---|---|---|---|---|---|---|---|---|---|
| T1-Weighted |
T2-Weighted |
||||||||||
| O1 | O2 | O3 | O1 | O2 | O3 | ||||||
| 1/27/F | Cortical veins | – | 9 | Parietal | No | 100 | 100 | 100 | 100 | 100 | 100 |
| 2/44/F | SSS, TS | No | 6 | Frontoparietal | Yes | 82 | 100 | – | 29 | 100 | – |
| 3/43/F | ST | No | 9 | Occipital, cerebellar | Yes | 100 | 100 | 100 | 93 | 100 | 100 |
| 4/29/F | SSS | No | 9 | Frontal | No | – | – | 100 | – | – | 100 |
| 5/18/F | SSS, ST | No | 9 | Occipital | No | – | 100 | 100 | – | 100 | 100 |
| 6/56/F | SSS, ST | No | 6 | Cerebellar | Yes | 68 | 96 | – | 89 | 94 | – |
| 7/26/F | Cortical veins | – | 8 | Parietal | No | – | 100 | 100 | – | 100 | 100 |
| 8/35/F | SSS, ST | No | 10 | Frontoparietal | No | 43 | 90 | 100 | 23 | 59 | 100 |
| 9/33/F | SSS, ST, SS | Yes | <1 | Frontal, occipital | No | 100 | – | – | 100 | – | – |
| 10/39/F | ICV, SR | Yes | 4 | Thalamus | No | – | 100 | – | – | 100 | – |
| 11/30/F | ST | Yes | 11 | Occipital, cerebellar | No | 100 | 100 | 100 | 100 | 100 | 100 |
| 12/37/F | SSS, ST | No | 16 | Temporal | Yes | 45 | – | 80 | 30 | – | 62 |
| 13/66/M | SSS, ST, SS | No | 18 | Parietal, occipital | Yes | 63 | – | 60 | 73 | – | 74 |
| 14/78/F | ICV | Yes | 23 | Basal ganglia | No | 50 | 100 | 100 | 64 | 100 | 100 |
| 15/29/F | ST | Yes | 10 | Cerebellar | No | 54 | – | 72 | 54 | – | 72 |
Note.—SSS indicates superior sagittal sinus; TS, transverse sinus; SS, sigmoid sinus; ICV, inner cerebral veins; SR, straight sinus; O1–3, observation periods after initial MR imaging (O1, days 1–30; O2, days 90–240; O3, >240 days).
Initial diagnosis was confirmed by venous MR angiography in 13 patients, digital subtraction angiography (DSA) in two patients, CT angiography in two cases, and either combined MR angiography and DSA or CT angiography and DSA in two cases. At follow-up, all patients received an MR imaging examination that included MR angiography. The follow-up intervals were defined as 30 days or less (median, 16 days; range, 2–30 days; 11 of 15 patients), 90–240 days (median, 180 days; range, 90–240 days; ten patients), and more than 240 days (median, 300 days; range, 270–690 days; eleven patients). All patients were treated with intravenous weight-adjusted heparin (partial thromboplastin time, 70–90 seconds) followed by oral anticoagulation for up to 12 months.
Imaging
MR imaging and venous MR angiography were performed with a 1.5T MR unit (Signa Horizon; GE Medical Systems, Milwaukee, WI).
The venous MR angiography protocol consisted of a spoiled gradient-echo sequence (2D time of flight) with a section thickness of 1.5 mm (flip angle 50°, band-width 15.63, FOV 26 cm) and a caudal presaturation of arterial flow from the neck arteries. Images were three-dimensionally reconstructed by using maximum intensity projection.
The T2-weighted imaging protocol comprised proton- and T2-weighted turbo spin-echo sequences ([TR/TE/NEX] 4657/15, 135/1; turbo factor, 8; sections, 20; acquisition time, 2.01 minutes). The T1-weighted imaging protocol comprised a turbo spin-echo sequence (600/20/2, 20 sections).
The lesion size was determined by planimetration of the respective area of the lesion on T2- and T1-weighted images and multiplication of the measured area by section with the respective section distance, by two independent and blinded observers (S.T., T.G.). There was no intersection gap.
Total recanalization of dural sinuses was defined as a reduction of luminal narrowing of less than 50% in all initially thrombosed vessels, otherwise the MR angiographic appearance was rated as not recanalized. Cortical vein thromboses were excluded from this part of the analysis, because recanalization of cortical veins cannot be reliably assessed with MR imaging.
Hemorrhage was diagnosed when the signal intensity on the T1-weighted image was hyperintense.
Statistical Evaluation
The software tool ImageJ (National Institutes of Health) was used for planimetration of the lesion volumes on T1- and T2-weighted images. In addition to the measurement of absolute lesion volumes, patients were dichotomized for the defined follow-up intervals into a group with reduction of lesion volume to less than 10% or to a group with 10% or greater of the lesion volume on admission. Follow-up time was categorized as defined above.
The associations of T1 and T2 lesion volumes, lesion volume reduction, and hemorrhage with recanalization and age were analyzed by using a Spearman rank correlation test. The relationships between time as a categorical variable and the number of patients with a residual lesion volume of 10% or greater, or less than 10% of the initial size, as well as between time and recanalization, were investigated by using a χ2 test with Yates correction. Lesion size was compared with a nonparametric U test. A level of probability of P < .05 was considered significant. Interobserver reliability of the volume measurements was investigated by the method of Bland and Altman. Agreement on recanalization was examined by using the intraclass correlation coefficient.
Results
Recanalization
The distribution of affected sinuses and veins is summarized in the Table. The intraclass correlation coefficient for agreement on total recanalization by two blinded observers was good at 0.86 (95% confidence interval [CI] 0.80–0.89, P < .001). After a mean follow-up time of 291 days (median, 270 days; range, 22–690 days), complete recanalization of dural sinuses was observed in seven patients (47%). Over the three defined observation periods, recanalization rates showed a nonsignificant trend to increase (P = .223). Age had no significant influence on recanalization rate.
Parenchymal Lesions
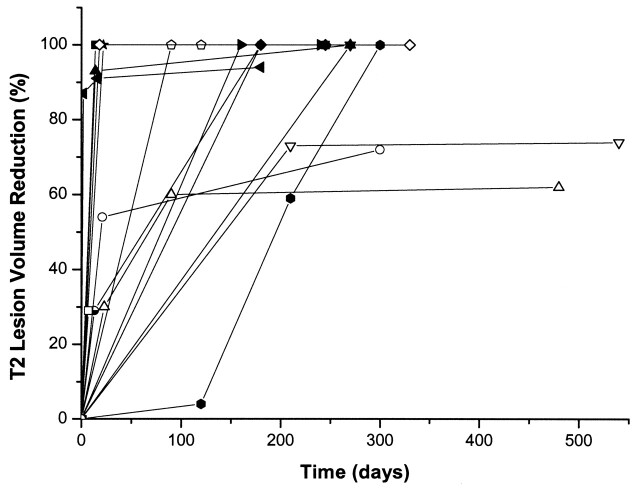
All parenchymal damages were located in the corresponding draining territories of the affected sinuses or veins. In 11 patients (73%), complete resolution of the initial signal intensity changes could be demonstrated. The time course of the lesion volumes and reduction respectively are summarized in the Table and Fig 1. Examples are given in Figures 2–6. Mean initial T1 lesion volume was 3.7 cm3 (median, 2.6 cm3; range, 0.1–10.1 cm3). The 2-SD CI for T1 lesion volume measurements by two independent observers was ±6.6 cm3. The number of patients with a residual T1 lesion volume of less than 10% decreased significantly over time (χ2 = 7.118, P < .05) and was associated with recanalization during the first 30 days after admission (Spearman ρ = 0.82, P < .01), whereas no correlation between late recanalization and reduction of infarct volume was observed. Recanalization within the first 30 days significantly influenced absolute lesion size during the first 30 days of observation (Spearman ρ = 0.75, P < .05); however, early recanalization was not predictive for the absolute lesion size nor the number of patients with 10% or less lesion size compared with admission beyond 240 days.
Fig 1.
Time course of the T2 lesion volume reduction in the individual patients.
Fig 2.
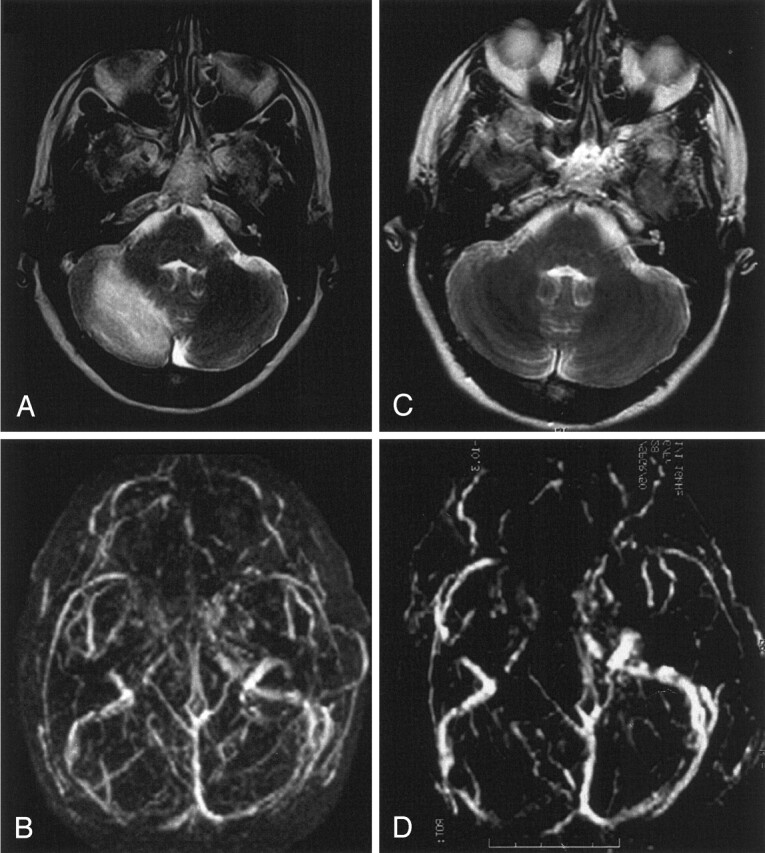
Venous cerebellar infarct due to transverse sinus thrombosis in a 56-year-old woman with partial obstruction of the superior sagittal sinus and partial thrombosis of the transverse sinuses.
A and B, T2-weighted MR image (A) and 3D time-of-flight MR angiogram (B) obtained on admission show the venous cerebellar infarct and transverse sinus thrombosis, respectively.
C and D, Follow-up MR images obtained after 6 months. Despite persistent partial obstruction of the transverse sinus (D), near complete resolution is noted of the volume of the T2 lesion (C).
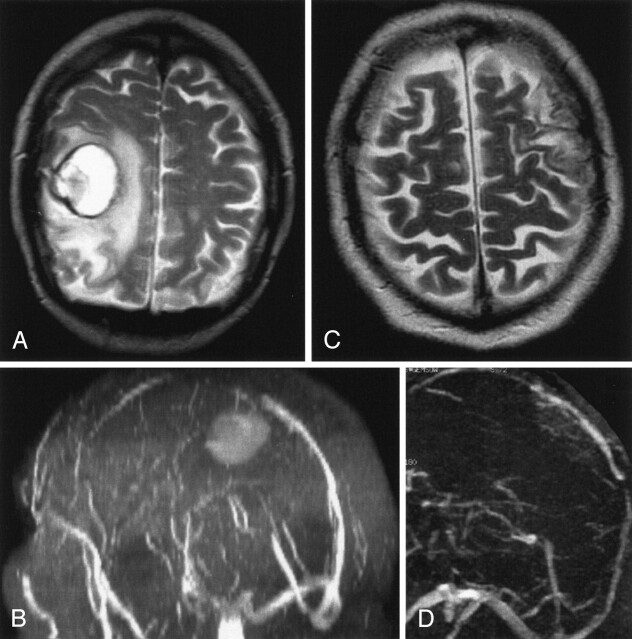
Fig 6.
Hemorrhagic venous infarct due to thrombosis of the superior sagittal sinus in a 66-year-old man.
A and B, T2-weighted MR image (A) and MR angiogram (B) show a parenchymal lesion due to a superior sagittal sinus thrombosis. The patient also had a second infarct (not shown).
C and D, Follow-up MR images show recanalization of the superior sagittal sinus (D) and decrease of total lesion volume by 74% (C).
Mean initial T2 lesion volume was 15 cm3 (median, 7.8 cm3; range, 1.1–81.2 cm3). The 2-SD CI for T2 lesion volume measurements by two independent observers (S.T., T.G.) was ±41.4 cm3. Within 30 days, T2 lesion volume decreased by 75.9 ± 29.3%, and after 240 days by 89 ± 24.7%. After more than 240 days, a reduction by 89.6 ± 16.7% was observed. However, contrary to the T1-weighted images, the reduction in the number of patients with a residual lesion volume of more than 10% during the observation periods was not significant. Neither initial absolute lesion size nor the number of patients with a residual lesion size of 10% or less compared with admission showed a correlation with the degree of recanalization, though the corresponding values seemed to increase over time.
T1 lesions were significantly smaller (P < .01) and resolved faster than T2 lesions: within 30 days, a mean reduction of 89.1% was observed, and at up to 240 days a further reduction of 4.8% was observed. After more than 240 days, 99% of the initial lesion had vanished in this group.
In four patients, we found mild signs of hemorrhage corresponding to hemorrhagic transformation in arterial stroke; in one patient a hemorrhage of 3 cm in diameter was present. Hemorrhage had no significantly relevant effect on absolute lesion size on T1- or T2-weighted images (Spearman ρ = 0.66, P < .05). Furthermore, we found a significant inverse relationship between hemorrhagic transformation and recanalization within 30 days (Spearman ρ = −0.77, P < .05).
Age correlated with a large absolute initial lesion volume on T2-weighted images (Spearman ρ = 0.78, P < .01). It had no significantly relevant influence on recanalization rate or resolution of lesions on T1- or T2-weighted images.
Discussion
Recent case series of CVT report an excellent clinical outcome despite venous infarcts (5–7). Furthermore, in clinical experience a dramatic reduction of lesion size over time on imaging studies seems not to be rare in CVT. This emphasizes that venous infarcts are quite different from arterial stroke. However, so far systematic studies on the time course of such lesions are lacking.
In this study, we examined the time course of signal intensity changes on MR images associated with CVT, taking into consideration the degree of recanalization as well as the age of the patients and the fact of hemorrhagic transformation to understand better the pathophysiologic mechanisms of edema and infarction in patients with venous occlusion. After photochemical occlusion of cortical veins in a rat model, Nakase and co-workers (3) observed a decrease of regional cerebral blood flow (rCBF) followed by irreversible brain damage in cases of reduction by 40% of baseline or less. In line with these findings, in perfusion-weighted MR imaging an increased mean transit time was found in humans with acute CVT, whereas cerebral blood volume was normal, indicating a reduction in rCBF (8). This might induce an energy failure (9). However, a disruption of the blood-brain barrier that results in vasogenic edema and hemorrhagic transformation due to increased venous pressure is frequently discussed as an etiologic factor for the development of venous infarcts (1).
These widely accepted pathophysiologic explanations imply that brain edema in CVT is closely related to a reduced venous drainage. It may be expected that its resolution directly depends on the restitution of flow in the thrombosed sinus.
In our study, however, recanalization was found to be correlated with a reduction of signal intensity changes on T1-weighted MR images only during the first 30 days. For T2-weighted MR images, a comparable trend could be observed, without significance, however. The recanalization rate found in this study (47%) complies with rates found by others (5, 10, 11). Bosch and co-workers (6), however, concluded from a study of 12 patients with CVT that lesions on T2-weighted MR images persist for as long as 6 months independently from recanalization. Regarding the interobserver agreement on recanalization of dural sinuses, our results comply with previously published data with use of a similar method (11).
Further reasons may exist for brain parenchymal changes, which are independent from impaired venous outflow and would explain the possibility of complete resolution despite persistent sinus occlusion.
Whether hemorrhage influences the size of MR imaging changes has not yet been examined. Hemorrhagic transformation coincided with large initial lesion size on the T2-weighted images and persistent venous occlusion. This supports the hypothesis of a high venous and capillary pressure with leakage of blood in the brain parenchyma as an underlying abnormal mechanism (12).
In the rat, age increases the rate and size of venous infarcts suggesting a greater vulnerability of the aged brain (13). In accordance with these experimental findings, we observed a significant relationship between age and early T2 lesion volume, but no association with the recanalization rate.
In experimental sinus thrombosis, only the propagation of the thrombus into cortical veins resulted in venous infarctions (14, 15). In humans, the lack of correlation between the site and extent of dural sinus thrombosis with the size of brain lesions and the clear relationship with cortical and medullary vein thrombosis on the other hand supports this hypothesis (16).
By means of T1-weighted images, the thrombus itself can be identified (17) and signs of hemorrhage can be assessed (2). But systematic examinations have not yet been reported. Corresponding to our results, in a rabbit model of cortical vein ligation, venous infarcts have been found smaller on T1- than on corresponding T2-weighted images (18). In the acute phase, hyperintense-appearing lesions seem to change to iso- or hypointense in the chronic phase (19).
In the context of veno-occlusive disease, hyperintensities on T2-weighted images usually represent reversible edema (1, 20). In a study of 12 patients, Forbes and co-workers (21) found a peak in signal intensity on T2-weighted images approximately 2 days after symptom onset. In our patients, the initial size of signal intensity change on T2-weighted images reduced to 24% within the first 30 days; on day 240, signal intensity reduction was nearly completed.
Whereas changes on T2-weighted images do not enable distinction between areas with cellular damage and the surrounding edematous region (22), on diffusion-weighted (DW) MR images the change is thought to represent cytotoxic brain edema. In the few DW imaging studies of human CVT, diminished as well as elevated apparent diffusion coefficients (ADCs) have been reported (23), possibly indicating an early cytotoxic edema closely followed by vasogenic edema (4, 22). However, whether a specific threshold of ADC decrease exists for permanent neurologic injury is uncertain (2, 9, 24). Our own findings and previous literature reports indicate that signal intensity changes on T1-, T2-, and diffusion-weighted MR images cannot be simply extrapolated from arterial stroke.
In arterial infarction, large initial changes on T2-weighted images and diffusion disorders correspond quite well with final infarct volume (25), and they are associated with permanent parenchymal injury. In contrast, as demonstrated in our study, complete restitution of T1 and T2 abnormalities in venous stroke is frequent. One explanation is that vasogenic edema seems to be predominant in venous stroke. Slight decrease of ADC values contrasts with the clear ADC decrease usually observed in the acute phase of arterial infarction, possibly indicating a missing extensive cytotoxic edema being responsible for the good outcome of venous stroke (26).
Vasogenic edema appears earlier in CVJ (1 hour) than in arterial infarction (4–6 hours) (4), and corresponding T2 changes decrease slower than in arterial stroke (22). Further investigations are necessary to understand the dynamics and to answer the question as to whether the same thresholds for functional and structural impairment concerning perfusion exist for both types of stroke. Other protective mechanisms in veno-occlusive stroke, such as creation of new collateral pathways and neovascularizations, should be taken into account.
Our study has limitations, above all the relatively small number of patients. Nevertheless, it emphasizes the fact that even large parenchymal changes can resolve completely independent from recanalization of the thrombosed veins and sinuses. Further experimental studies are necessary to investigate this phenomenon, considering the indication of thrombolytic or antithrombotic drugs.
Conclusion
In venous stroke, even large parenchymal changes can resolve completely independent from recanalization of the thrombosed veins and sinuses. A plausible hypothesis is that venous infarcts largely consist of persistent edema and that the lesion volume is influenced by development of collateral veins. However, further investigations are necessary to understand the underlying abnormal mechanisms.
Fig 3.
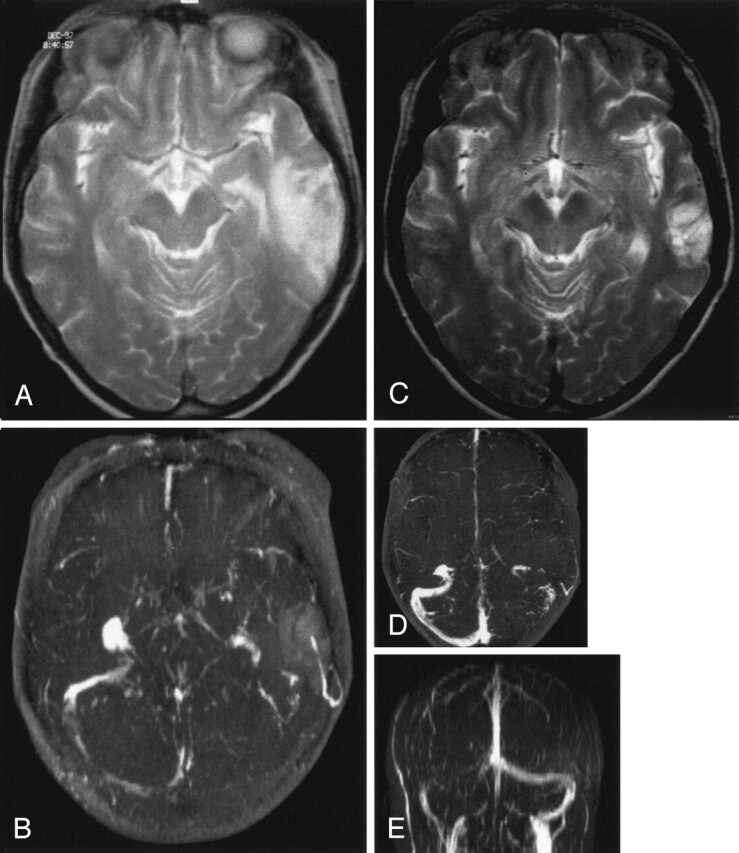
Venous temporal infarct in a 37-year-old woman.
A and B, T2-weighted MR image (A) and 3D time-of-flight MR angiogram (B) obtained on admission show a venous infarct in the temporal lobe due to thrombosis of the transverse sinus. Thrombosis of the superior sagittal sinus caused no infarct.
C–E, Follow-up MR images obtained after 12 months show that despite persistent occlusion of the transverse sinus (D and E) and only partial recanalization of the superior sagittal sinus, the volume of the venous infarct decreased substantially (C) at follow-up.
Fig 4.
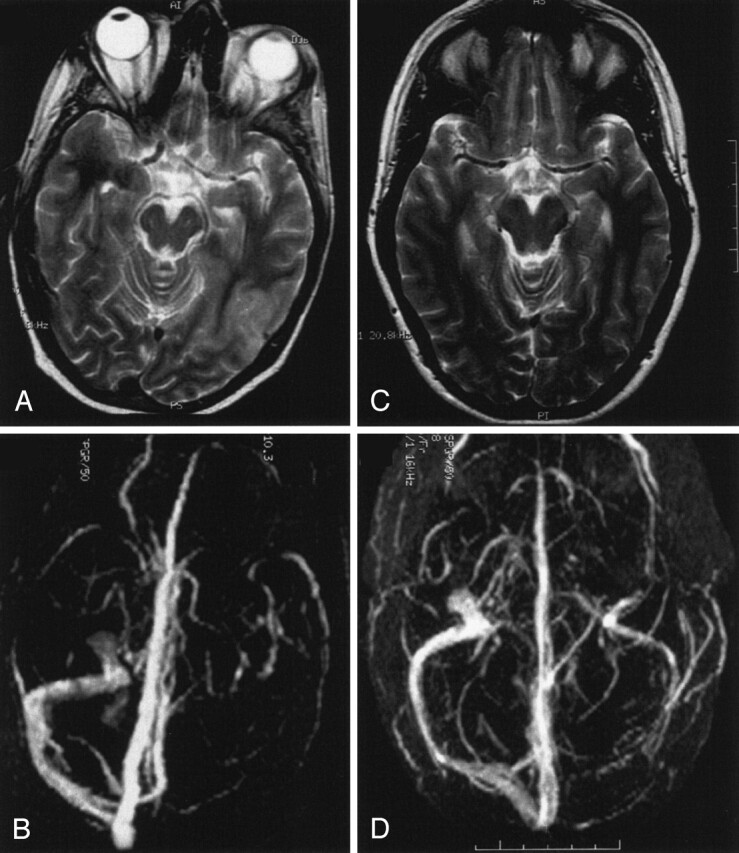
Venous infarct in the temporo-occipital region in a 43-year-old woman.
A and B, T2-weighted MR image (A) and 3D time-of-flight MR angiogram (B) obtained on admission. The MR angiogram shows a thrombosis of the transverse sinus.
C and D, Follow-up MR images obtained after 3 months show total resolution of the parenchymal lesion (C) despite persistent occlusion of the transverse sinus (D).
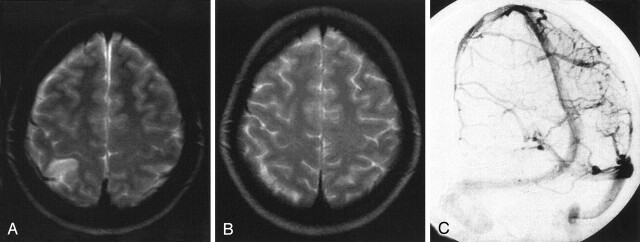
Fig 5.
Venous infarct due to cortical vein thrombosis in a 27-year-old woman.
A, T2-weighted MR image obtained on admission shows the venous infarct due to cortical vein thrombosis.
B, Conventional angiography on admission shows a right parietal cortical vein thrombosis.
C, Follow-up T2-weighted MR image obtained after 3 months shows total resolution of the initial lesion. In this case, no analysis regarding recanalization was performed.
References
- 1.Tsai FY, Wang AM, Matovich VB, et al. MR staging of acute dural sinus thrombosis: correlation with venous pressure measurements and implications for treatment and prognosis. AJNR Am J Neuroradiol 1995;16:1021–1029 [PMC free article] [PubMed] [Google Scholar]
- 2.Ducreux D, Oppenheim C, Vandamme X, et al. Diffusion-weighted imaging patterns of brain damage associated with cerebral venous thrombosis. AJNR Am J Neuroradiol 2001;22:261–268 [PMC free article] [PubMed] [Google Scholar]
- 3.Nakase H, Heimann A, Kempski O. Alterations of regional cerebral blood flow and oxygen saturation in a rat sinus-vein thrombosis model. Stroke 1996;27:720–727 [DOI] [PubMed] [Google Scholar]
- 4.Röther J, Waggie K, van Bruggen N, de Crespigny AJ, Moseley ME. Experimental cerebral venous thrombosis: evaluation using magnetic resonance imaging. J Cereb Blood Flow Metab 1996;16:1353–1361 [DOI] [PubMed] [Google Scholar]
- 5.Baumgartner RW, Studer A, Arnold M, Georgiadis D. Recanalisation of cerebral venous thrombosis. J Neurol Neurosurg Psychiatry 2003;74:459–461 [DOI] [PMC free article] [PubMed] [Google Scholar]
- 6.Bosch J, Rovira A, Alvarez-Sabin J, Capellades J, Abilleira S, Sumalla J. Value of cranial MRI in the follow-up of dural sinus thrombosis [in Spanish]. Rev Neurol 1998;26:971–973 [PubMed] [Google Scholar]
- 7.Brucker AB, Vollert-Rogenhofer H, Wagner M, et al. Heparin treatment in acute cerebral sinus venous thrombosis: a retrospective clinical and MR analysis of 42 cases. Cerebrovasc Dis 1998;8:331–337 [DOI] [PubMed] [Google Scholar]
- 8.Doege CA, Tavakolian R, Kerskens CM, et al. Perfusion and diffusion magnetic resonance imaging in human cerebral venous thrombosis. J Neurol 2001;248:564–571 [DOI] [PubMed] [Google Scholar]
- 9.Peeters E, Stadnik T, Bissay F, Schmedding E, Osteaux M. Diffusion-weighted MR imaging of an acute venous stroke: case report. AJNR Am J Neuroradiol 2001;22:1949–1952 [PMC free article] [PubMed] [Google Scholar]
- 10.Strupp M, Covi M, Seelos K, Dichgans M, Brandt T. Cerebral venous thrombosis: correlation between recanalization and clinical outcome—a long-term follow-up of 40 patients. J Neurol 2002;249:1123–1124 [DOI] [PubMed] [Google Scholar]
- 11.Stolz E, Trittmacher S, Rahimi A, et al. Influence of recanalization on outcome in dural sinus thrombosis: a prospective study. Stroke 2004;35:544–547 [DOI] [PubMed] [Google Scholar]
- 12.Villringer A, Mehraein S, Einhäupl KM. Pathophysiological aspects of cerebral sinus venous thrombosis (SVT). J Neuroradiol 1994;21:72–80 [PubMed] [Google Scholar]
- 13.Otsuka H, Nakase H, Nagata K, Ueda K, Kempski O, Sakaki T. Effect of age on cerebral venous circulation disturbances in the rat. J Neurosurg 2000;93:298–304 [DOI] [PubMed] [Google Scholar]
- 14.Ungersbock K, Heimann A, Kempski O. Cerebral blood flow alterations in a rat model of cerebral sinus thrombosis. Stroke 1993;24:563–569 [DOI] [PubMed] [Google Scholar]
- 15.Fries G, Wallenfang T, Hennen J, et al. Occlusion of the pig superior sagittal sinus, bridging and cortical veins: multistep evolution of sinus-vein thrombosis. J Neurosurg 1992;77:127–133 [DOI] [PubMed] [Google Scholar]
- 16.Bergui M, Bradac GB, Daniele D. Brain lesions due to cerebral venous thrombosis do not correlate with sinus involvement. Neuroradiology 1999;41:419–424 [DOI] [PubMed] [Google Scholar]
- 17.Bianchi D, Maeder P, Bogousslavsky J, Schnyder P, Meuli RA. Diagnosis of cerebral venous thrombosis with routine magnetic resonance: an update. Eur Neurol 1998;40:179–190 [DOI] [PubMed] [Google Scholar]
- 18.Secrist RD, Traynelis V, Schochet SS Jr. MR imaging of acute cortical venous infarction: preliminary experience with an animal model. Magn Reson Imaging 1989;7:149–153 [DOI] [PubMed] [Google Scholar]
- 19.Kurokawa Y, Sohma T, Tsuchita H, Kitami K, Suzuki S, Ishiguro M. Findings of magnetic resonance imaging in cerebral venous occlusion: difference from hemorrhagic infarction. Comput Med Imaging Graph 1990;14:425–429 [DOI] [PubMed] [Google Scholar]
- 20.Connor SE, Jarosz JM. Magnetic resonance imaging of cerebral venous sinus thrombosis. Clin Radiol 2002;57:449–461 [DOI] [PubMed] [Google Scholar]
- 21.Forbes KP, Pipe JG, Heiserman JE. Evidence for cytotoxic edema in the pathogenesis of cerebral venous infarction. AJNR Am J Neuroradiol 2001;22:450–455 [PMC free article] [PubMed] [Google Scholar]
- 22.Pierpaoli C, Righini A, Linfante I, Tao-Cheng JH, Alger JR, Di Chiro G. Histopathologic correlates of abnormal water diffusion in cerebral ischemia: diffusion-weighted MR imaging and light and electron microscopic study. Radiology 1993;189:439–448 [DOI] [PubMed] [Google Scholar]
- 23.Lövblad KO, Bassetti C, Schneider J, et al. Diffusion-weighted MR in cerebral venous thrombosis. Cerebrovasc Dis 2001;11:169–176 [DOI] [PubMed] [Google Scholar]
- 24.Manzione J, Newman GC, Shapiro A, Santo-Ocampo R. Diffusion- and perfusion-weighted MR imaging of dural sinus thrombosis. AJNR Am J Neuroradiol 2000;21:68–73 [PMC free article] [PubMed] [Google Scholar]
- 25.Rudin M, Baumann D, Ekatodramis D, Stirnimann R, McAllister KH, Sauter A. MRI analysis of the changes in apparent water diffusion coefficient, T2 relaxation time, and cerebral blood flow and volume in the temporal evolution of cerebral infarction following permanent middle cerebral artery occlusion in rats. Exp Neurol 2001;169:56–63 [DOI] [PubMed] [Google Scholar]
- 26.Corvol JC, Oppenheim C, Manai R, et al. Diffusion-weighted magnetic resonance imaging in a case of cerebral venous thrombosis. Stroke 1998;29:2649–2652 [DOI] [PubMed] [Google Scholar]


