Abstract
Summary: We present a case of multifocal enhancing lesions confined to the right cerebral hemisphere that mimicked diffuse neoplasm. MR spectroscopy revealed not only minimal elevation of the choline peak, but also marked elevation of the glutamate and glutamine peaks, findings that are more suggestive of an inflammatory process. Biopsy showed lymphocytic vasculitis, a rare variant of primary angiitis of the CNS. Following appropriate medical therapy, MR imaging demonstrated complete resolution of the lesions.
Primary angiitis of the central nervous system (PACNS), also referred to as granulomatous angiitis of the nervous system (GANS), is an extremely rare and poorly understood inflammatory disorder affecting parenchymal and leptomeningeal arteries and veins (1). An even less common subtype of PACNS is lymphocytic angiitis (also known as lymphocytic vasculitis). Although the cause of this disorder is unclear, a viral etiology, as well as an association with lymphoma, has been reported (2, 3). This entity is a diagnosis of exclusion and is characterized by CNS dysfunction that remains idiopathic after thorough clinical and laboratory evaluation. Clinical manifestations are protean and make the diagnosis difficult; however, making the diagnosis is critical because the prognosis is poor if patients are left untreated (4). To date, the mainstays of diagnosis are primarily histopathologic and, to a lesser extent, neuroimaging. We report a case of a 25-year-old woman with biopsy-proved lymphocytic vasculitis mimicking multifocal, unilateral cerebral neoplasms and discuss the MR imaging and, more important, the MR spectroscopic findings, which aided in the diagnosis.
Case Report
A 25-year-old woman presented with a greater than 2-year history of severe neurologic symptoms. The patient’s history dates back to November 2001, when she noted right frontal head pain of sudden onset. Soon thereafter, the patient developed left arm and left leg weakness. She was apparently diagnosed at an outside institution as having a stroke but was also treated for possible intracranial abscesses with intravenous antibiotics for 5–6 weeks.
The patient presented to our institution in March 2003 in a disabled condition. At this time, the patient complained of unbearable frontal headaches and had severe left-sided motor weakness on physical examination. The remainder of her physical examination was normal. She denied ever having constitutional symptoms or a history of intravenous drug use. There were no significant baseline laboratory abnormalities. The patient demonstrated HIV negativity.
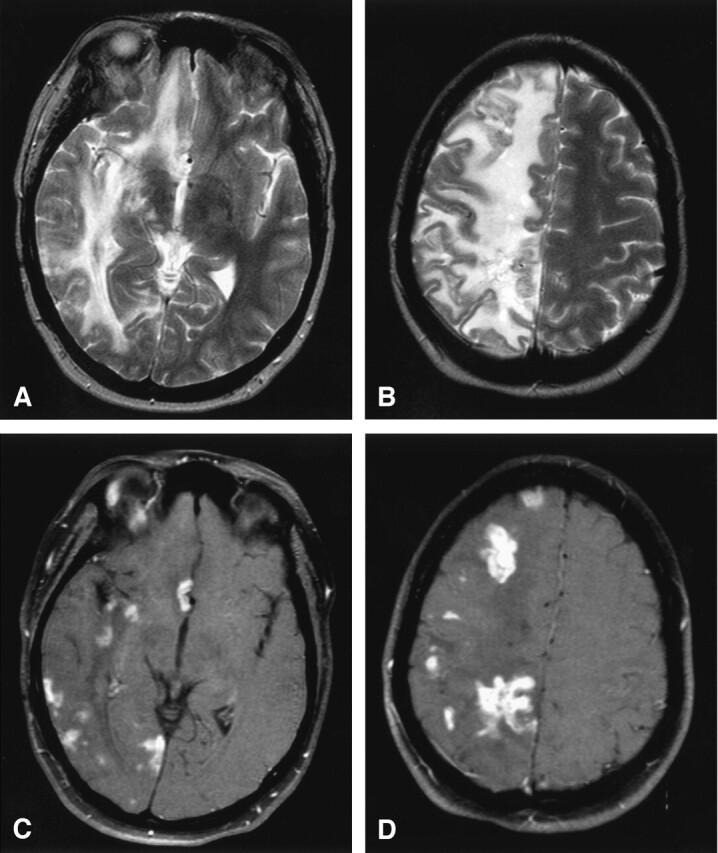
She subsequently underwent MR imaging of the brain by using a 1.5-T MR imaging unit. The MR images showed massive vasogenic edema throughout the right cerebral hemisphere with multifocal tumor-like areas of T2-prolongation that avidly enhanced on T1-weighted postgadolinium imaging. These lesions were predominantly located in a peripheral distribution with some involvement of the right basal ganglia structures. The left cerebral hemisphere, cerebellum, and brain stem were spared (Fig 1). There were no areas of restricted diffusion.
Fig 1.

Lymphocytic vasculitis, MR imaging.
A and B, Axial T2-weighted MR images reveal multifocal regions of T2 hyperintensity with surrounding diffuse vasogenic edema limited to the right cerebral hemisphere resulting in mild right to left midline shift.
C and D, Axial T1-weighted postgadolinium MR images with fat saturation depict multifocal enhancing tumefactive lesions, primarily at the subcortical gray-white matter junction and basal ganglia, throughout the right cerebral hemisphere with sparing of the left cerebral hemisphere.
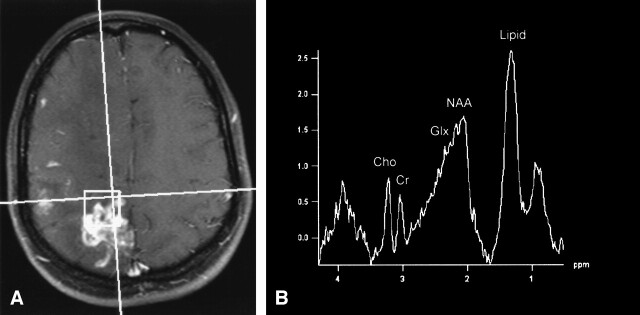
Single- and multivoxel MR spectroscopy using a point resolved spectroscopy (PRESS) protocol with short (30 ms) and long (144 ms) TE was subsequently performed. MR spectroscopy of the two largest right cerebral lesions revealed marked elevation of the glutamate and glutamine peaks (2.1–2.5 parts per million [ppm]), marked elevation of the lipid peak (0.9–1.5 ppm), mild decrease in the NAA peak (2.0 ppm) on the long TE spectra, and only minimal elevation of the choline peak (3.2 ppm) (Fig 2).
Fig 2.
Lymphocytic vasculitis, MR spectroscopy.
A, 2 × 2 × 2 cm single voxel spectroscopy performed over a right high parietal enhancing lesion.
B, Spectrum obtained with a PRESS sequence using a short echo time of 30 ms shows slight elevation of the choline peak (Cho, 3.2 ppm) compared with the creatine peak (Cr, 3.0 ppm), marked elevation of the glutamate and glutamine peaks (Glx, 2.1–2.5 ppm), and marked elevation of the lipid peak (Lipid, 0.9–1.5 ppm). NAA, n-acetylaspartate (2.0 ppm).
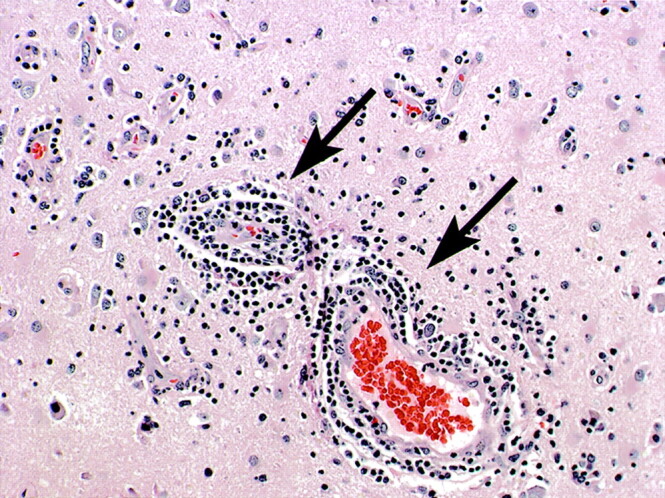
The patient underwent a right frontal craniotomy and excisional biopsy of a single enhancing right frontal lobe lesion. The biopsy results displayed extensive chronic inflammatory changes, perivascular lymphocytic infiltration, necrosis, and infarction without evidence of organisms or malignancy, features that are typical of lymphocytic vasculitis (Fig 3). CT images of the chest, abdomen, and pelvis were negative for systemic malignancy. The patient had an unremarkable collagen vascular workup. There was also no evidence of an infectious or drug-induced cause of vasculitis. The patient was considered to have primary angiitis of the CNS on the basis of her biopsy results, absence of systemic symptoms throughout her clinical course, and unrevealing laboratory results.
Fig 3.

Lymphocytic vasculitis histopathologic results. Photomicrograph of the biopsy specimen reveals multifocal regions of angiocentric and angioinvasive vascular infiltration by lymphocytes as well as necrosis, findings compatible with lymphocytic vasculitis. Hematoxylin and eosin stain.
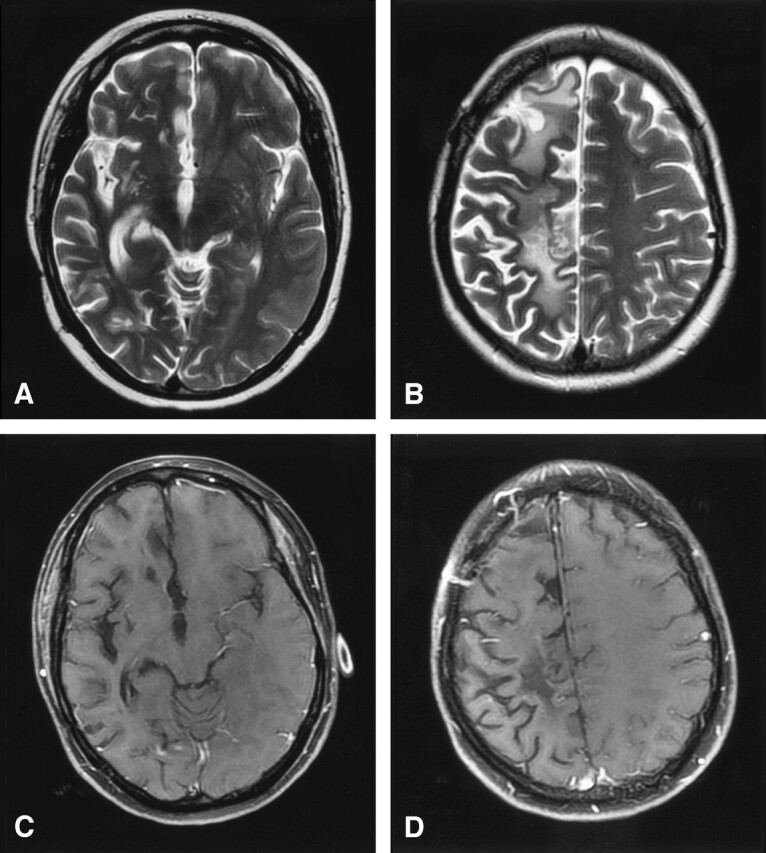
Treatment with dexamethasone and cyclophosphamide was instituted, and her symptoms improved markedly within 3 weeks. Follow-up MR imaging 5 months later showed dramatic improvement in the vasogenic edema and complete resolution of the multifocal enhancing lesions in the right cerebral hemisphere. Extensive volume loss and gliosis were noted throughout the right cerebral hemisphere (Fig 4). The patient’s headaches resolved, and she currently has only minimal residual left-sided arm and leg weakness.
Fig 4.

Lymphatic vasculitis, MR imaging post-treatment.
A and B, Axial T2-weighted images 5 months after therapy show resolution of edema and mass effect with residual foci of gliosis and extensive atrophy of the right cerebral hemisphere.
C and D, Axial T1-weighted postgadolinium images with fat saturation demonstrate interval resolution of the previously seen enhancing masses. Craniotomy defect is evident in the right frontal region from the previous biopsy.
Discussion
The diagnosis of PACNS is challenging, in part because of its rarity and in part because of the variability of its neurologic and imaging findings. The diagnosis is essential in that most patients, as in this case, respond favorably to appropriate therapy (4). If untreated, patients will deteriorate neurologically, and frequently the outcome is fatal. A positive biopsy is required to make a definitive diagnosis. In the appropriate clinical setting, however, imaging findings of CNS vasculitis on MR imaging or MR angiography or conventional angiography may suggest the diagnosis (1).
MR imaging characteristics of PACNS may be nonspecific, and routine MR imaging findings may be negative in angiographically confirmed primary or secondary CNS vasculitis (5, 6). Reports in the literature describe extremely variable MR imaging findings in PACNS, ranging from diffusely abnormal to normal (5–14). The largest series, of seven cases, demonstrated a total of 36 lesions, mainly consisting of cortical or deep white matter abnormalities (7). These lesions were characteristically bilateral, multiple, and supratentorial on MR imaging. One of the seven cases presented as a solitary T2-hyperintense mass in the left occipital lobe exerting mild mass effect on the occipital horn with no vasogenic edema. We found only two other cases of PACNS presenting as a masslike lesion on CT (15, 16). To our knowledge, there have been no case reports describing the MR spectroscopy findings in primary angiitis of the CNS.
In the present case, the patient had multiple, unilateral, tumor-like enhancing lesions associated with extensive vasogenic edema on MR imaging. It is interesting to note that all of the lesions were confined to the right cerebral hemisphere and the entire left cerebral hemisphere, cerebellum, and brain stem were normal. No areas of infarction or hemorrhage were evident. The avid enhancement pattern may be related to the vascular and perivascular inflammatory changes. Of note, there was a rapid improvement both clinically and on MR imaging shortly after the institution of appropriate therapy. Campi et al (12) report similar results in their series of six patients with PACNS who demonstrated a significant decrease in the size and number of abnormalities on MR imaging after initiating therapy.
Moreover, MR spectroscopy may be very beneficial in the evaluation of patients presenting with tumefactive lesions of the CNS. In the case presented above, MR imaging findings were initially felt to be most compatible with multifocal glioma, especially in view of the predominant unilateral distribution of disease; however, MR spectroscopy did not reveal significant elevation of the choline peak, which one would typically expect to see with an aggressive neoplastic process. The most striking abnormality noted was the marked elevation of the glutamate and glutamine peaks. There was also marked elevation of the lipid peak, a nonspecific metabolite that can be seen in many destructive processes in the brain secondary to the release of free lipids from the cell membranes. There was no significant elevation of lactate, because the lesions were not grossly necrotic—that is, there was no significant hypoxia in the regions of abnormality to result in decreased oxidative phosphorylation and the subsequent conversion to glycolysis within the cells.
In our experience, this spectroscopic pattern of marked elevation of the glutamate/glutamine metabolites has been associated with inflammatory processes of the CNS and is not typically seen with aggressive neoplastic disorders. Although there is no specific confirmatory evidence in the literature to support this contention or a specific known mechanism for the elevation of these metabolites in inflammatory conditions, we propose the following hypothesis. Glutamate and glutamine are known to function as neurotransmitters, although this is only a very small fraction of the total concentration of these metabolites in the brain. These molecules are primarily found in astrocytes, and therefore the observed peaks in the MR spectra mainly act as an astrocytic marker (17). Whereas in the normal MR spectrum the quantity of glutamate exceeds that of glutamine (10 mmol/L vs. 5 mmol/L, respectively), whenever there is elevation of these metabolites the increase is primarily due to an increase in glutamine. This is because glutamate, when in excess, is actually a neurotoxic substance. Therefore, when an increase in glutamate occurs, glutamine synthetase is activated, which converts glutamate to glutamine, a substance that is nontoxic to the brain. In inflammatory conditions, cell breakdown of both neural and glial elements occurs, as well as an associated adjacent astrocytic response, leading to the local accumulation of many metabolites and likely accounting for this high concentration of glutamine (and glutamate). Other molecules certainly are present and may even add to the increased peaks observed in the MR spectrum at 2.1–2.5 ppm, although no other spectral components are known to exist at this location in sufficient quantity to be representative of this elevated peak. As such, at the present time, we can only assume that these peaks are representative of glutamine and glutamate. That not withstanding, the important observation is that elevation of these peaks suggests an inflammatory etiology even though the imaging pattern was more consistent with a neoplastic process. Further research is warranted, in particular at higher field strength where these overlapping spectral peaks can be resolved more accurately, possibly resulting in a more definitive diagnostic spectral pattern for inflammatory conditions and the specific relative concentration and spectral location of the metabolites produced by this disorder.
Footnotes
Presented at the 42nd annual meeting of the American Society of Neuroradiology, June 8, 2004, Seattle, WA.
References
- 1.Vollmer TL, Guarnaccia J, Harrington W, et al. Idiopathic granulomatous angiitis of the central nervous system: diagnostic challenges. Arch Neurol 1993;50:925–930 [DOI] [PubMed] [Google Scholar]
- 2.Greco FA, Kolins J, Rajjoub RK, Brereton HD. Hodgkin’s disease and granulomatous angiitis of the central nervous system. Cancer 1976;38:2027–2032 [DOI] [PubMed] [Google Scholar]
- 3.Rosen CL, DePalma L, Morita A. Primary angiitis of the central nervous system as a first presentation in Hodgkin’s disease: a case report and review of the literature. Neurosurgery 2000;46:1504–1508 [DOI] [PubMed] [Google Scholar]
- 4.Koo EH, Massey EW. Granulomatous angiitis of the central nervous system: protean manifestation and response to treatment. J Neurol Neurosurg Psychiatry 1988;51:1126–1133 [DOI] [PMC free article] [PubMed] [Google Scholar]
- 5.Imbesi SG. Diffuse cerebral vasculitis with normal results on brain MR imaging. AJR Am J Roentgenol 1999;173:1494–1496 [DOI] [PubMed] [Google Scholar]
- 6.Wasserman BA, Stone JH, Hellmann DB, Pomper MG. Reliability of normal findings on MR imaging for excluding the diagnosis of vasculitis of the central nervous system. AJR Am J Roentgenol 2001;177:455–459 [DOI] [PubMed] [Google Scholar]
- 7.Greenan TJ, Grossman RI, Goldberg HI. Cerebral vasculitis: MR imaging and angiographic correlation. Radiology 1992;182:65–72 [DOI] [PubMed] [Google Scholar]
- 8.Negishi C, Sze G. Vasculitis presenting as primary leptomeningeal enhancement with minimal parenchymal findings. AJNR Am J Neuroradiol 1993;14:26–28 [PMC free article] [PubMed] [Google Scholar]
- 9.Shoemaker EI, Lin ZS, Rae-Grant AD, Little B. Primary angiitis of the central nervous system: unusual MR appearance. AJNR Am J Neuroradiol 1994;15:331–334 [PMC free article] [PubMed] [Google Scholar]
- 10.Finelli PF, Onyiuke HC, Uphoff DF. Idiopathic granulomatous angiitis of the CNS manifesting as diffuse white matter disease. Neurology 1997;49:1696–1699 [DOI] [PubMed] [Google Scholar]
- 11.Cloft HJ, Phillips CD, Dix JE, et al. Correlation of angiography and MR imaging in cerebral vasculitis. Acta Radiol 1999;40:83–87 [DOI] [PubMed] [Google Scholar]
- 12.Campi A, Benndorf G, Filippi M, et al. Primary angiitis of the central nervous system: serial MRI of brain and spinal cord. Neuroradiology 2001;43:599–607 [DOI] [PubMed] [Google Scholar]
- 13.Ay H, Sahin G, Saatci I, et al. Primary angiitis of the central nervous system and silent cortical hemorrhages. AJNR Am J Neuroradiol 2002;23:1561–1563 [PMC free article] [PubMed] [Google Scholar]
- 14.Singh S, John S, Joseph TP, Soloman T. Primary angiitis of the central nervous system: MRI features and clinical presentation. Australas Radiol 2003;47:127–134 [DOI] [PubMed] [Google Scholar]
- 15.Valavanis A, Friede R, Schubiger O, Hayek J. Cerebral granulomatous angiitis simulating brain tumor. J Comput Assist Tomogr 1979;3:536–538 [DOI] [PubMed] [Google Scholar]
- 16.Johnson M, Maciunas R, Dutt P, et al. Granulomatous angiitis masquerading as a mass lesion: magnetic resonance imaging and stereotactic biopsy findings in a patient with occult Hodgkin’s disease. Surg Neurol 1989;31:49–53 [DOI] [PubMed] [Google Scholar]
- 17.Danielsen ER, Ross B. The clinical significance of metabolites. In: Danielsen ER, Ross B eds. Magnetic resonance spectroscopy diagnosis of neurological diseases. New York: Marcel Dekker;1999. :23–43


