

Abstract
BACKGROUND AND PURPOSE: Dynamic contrast-enhanced MR imaging may be used to quantify tissue fractional blood volume (fBV) and microvascular permeability. We tested this technique in patients with brain tumors to assess whether these measurements correlate with tumor histologic grade.
METHODS: Twenty-two patients with newly diagnosed gliomas underwent MR imaging followed by surgery. Imaging consisted of one pre- and six dynamic postcontrast 3D spoiled gradient-recalled acquisition in the steady state data sets after administration of a single dose (0.1 mmol/kg) of contrast material. Signal intensity changes in blood and tissue were kinetically analyzed using a bidirectional two-compartment model, yielding estimates of fBV (mL/cm3) and microvascular permeability (mL/100 cm3 per minute). Stained tumor specimens were scored on a four-point scale (1 = low grade, 4 = high grade).
RESULTS: Histologic examination revealed one grade 1, eight grade 2, seven grade 3, and six grade 4 tumors. fBV values ranged from 0.5% to 13.7%. Permeability values ranged from −0.4 to 18.8, with a strong correlation (r = 0.83) to tumor grade. Despite some overlap between the permeability values of specific tumors from different grades, differences in the mean were statistically significant. There was a weak correlation (r = 0.39) between estimated fBV and tumor grade, and no statistically significant difference among fBV values in any of the groups.
CONCLUSION: This relatively simple method of analysis provides quantitative estimates of fBV and microvascular permeability in human brain tumors, with the permeability being predictive of pathologic grade. The technique can be easily implemented on clinical scanners and may prove useful in the assessment of tumor biology and in therapeutic trials.
Enhancement of the brain with the use of intravenously administered small-molecular-weight gadolinium-based contrast agents, as typically observed on clinical MR images, is the result of a combination of tissue vascularity, or the fractional blood volume (fBV), and accumulation of contrast agent in the tissue interstitium consequent to transendothelial diffusion. The rate of such transendothelial diffusion of contrast medium is a reflection of the integrity of the microvessel wall (1–3) (Fig 1).
fig 1.

A, Schematic representation of two capillaries containing contrast agent. The healthy capillary with an intact BBB (left) is not permeable to the contrast agent, which remains intravascular. A diseased capillary with a disrupted BBB may become permeable to the agent, leading to accumulation of contrast agent outside the vessel (right).
B, Because the contrast agent causes relaxation rate enhancement to water in its environment, initial tissue relaxation rate enhancement reflects the fraction of the tissue containing blood vessels (since the contrast agent is, at least initially, confined to the intravascular compartment). The ratio of initial enhancement in tissue to enhancement in a region of 100% blood (eg, the sagittal sinus) will then yield the fBV. Over time, if the contrast agent leaks out of the vessel into the extravascular space of the tissue, the relaxation rate will rise progressively. The rate of increase in relaxation rate is proportional to the permeability of the capillary wall to the contrast agent.
Commonly, tumors are characterized by neovascularization and increased angiogenic activity (4–6). As a consequence, tumors may have a higher proportion of immature, and thus hyperpermeable, vessels. It has been demonstrated in several animal models (7, 8) that dynamic, contrast-enhanced MR imaging with a macromolecular contrast agent can be used to quantify microvascular permeability in tumors and that permeability increases with increasing tumor malignancy (9, 10). It has also been shown, in a model of human breast tumor, that permeability reduction in response to antiangiogenic pharmaceutical therapy, as determined from MR studies, correlates with decreased tumor growth rate (11). Recently, it has been further shown, in a model of human brain tumor in athymic rats, that dynamic contrast-enhanced MR studies can be analyzed similarly to quantify blood volume and microvascular permeability and to quantitatively monitor antiangiogenic therapy (12).
The purpose of this study was to implement a clinically usable method to quantify those microvascular parameters in human brain tumors and to assess whether these quantitative characterizations of the tumor microvasculature correlate with histologic grade.
Methods
Patients
Twenty-two patients with gliomas were included in the study. Nine patients were male and 13 were female; ages ranged from 14 to 79 years. All patients underwent surgical biopsy or tumor removal within 7 days after the MR examination.
Histologic Examination
Tumor specimens were stained with hematoxylin-eosin and were graded qualitatively by a pathologist, who was blinded to the imaging findings, and classified into four groups: grade 1 (eg, low-grade dysembryoplastic neuroepithelial tumor); grade 2 (eg, astrocytoma, oligodendroglioma, or mixed oligo-astrocytoma); grade 3 (eg, anaplastic astrocytoma or oligodendroglioma); and grade 4 (eg, high-grade glioblastoma multiforme).
MR Imaging
MR examinations were performed on a 1.5-T unit. A sagittal T1-weighted scout scan was obtained to localize the tumor and to appropriately place the dynamic series. For microvascular measurements, an axial 3D spoiled gradient-recalled acquisition in the steady state (SPGR) sequence was obtained with the following parameters: 8.3/1.5/1 (TR/TE/excitations); flip angle, 30°; matrix, 256 × 128 × 28; section thickness, 3 mm; field of view, 24 cm; and acquisition time, 26 seconds per volume of 28 slices. This 3D data set was acquired seven times, once before and six times immediately after intravenous bolus administration of a single dose of contrast material(0.1 mmol/kg gadodiamide). The contrast agent was administered either by hand injection or with a power injector (Medrad, MA) with a flow of 2 mL/s.
Data Analysis
Signal intensity values measured over time in regions of interest (ROIs) in blood and tumor tissue were analyzed using the MRVision display/analysis software (The MRVision Co, Menlo Park, CA). The blood data were usually measured from the sagittal sinus; however, if the mass effect of the tumor compressed the sinus, another relatively large vascular reference was chosen. The tumor was divided into different areas (eg, rim versus core, infiltrating tumor, etc) and ROIs were measured in those different tumor portions. ROIs were selected from the last postcontrast image: a semiautomated threshold-based technique was used to identify the pixels in the tumor that had the 10% to 20% highest signal intensity in that image (which resulted from a combination of high blood volume and high microvascular permeability). Thus, the ROIs were selected with an irregular contour to cover the whole of the chosen area, without the constraints of a particular geometry.
The signal intensity changes (ΔSI = SIpost − SIpre) were calculated for the different ROIs for each postcontrast time point, and their time course was used for subsequent kinetic analysis. Signal intensity changes were recognized only as an approximation of gadolinium tracer concentration, as has been observed previously (13–15). Nonetheless, by use of a relatively low dose and a relatively short TE (14) and by maximizing sensitivity to small Δ1/T1 changes (16), approximate linearity was maintained.
The kinetic analysis used was a bidirectional two-compartment model based on the equations of Tofts et al (17) and others (eg, [18]), which yields estimates of fractional tissue blood volume (BV) (mL/ cm3) and microvascular permeability, expressed as the transendothelial transfer constant kPS (mL/100 cm3 per minute).
In detail, the blood decay of the signal intensity was fitted to a biexponential function
 |
yielding the parameters A1, A2, b1, and b2. Those four parameters were inserted in the following equation:
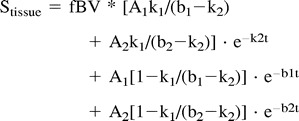 |
where k1 reflects the efflux rate (permeability) from plasma to interstitium and k2 reflects the reflux rate from interstitium back to plasma.
Nonlinear regression analysis (Kaleidagraph, Abelbeck Software) yielded fit-value estimates of fBV, k1, and k2. Microvascular permeability, kPS, was computed from k1, corrected for hematocrit, and appropriately scaled; also computed was the sum of k1 and k2, or total permeability. For subsequent correlation with the histologic tumor grade, in cases of inhomogeneous tumor tissue, the area with the highest microvascular permeability was chosen to represent the tumor.
To create spatial maps of estimates of fBV and permeability, a simplified model was used for the automated pixel-by-pixel analysis. Blood was fitted to a monoexponential function and the kinetic model was a unidirectional model (ignoring the reflux coefficient, k2) based on the equations of other investigators (18–21), which are special-case simplifications of Equation 2.
Statistical analysis of fBV and kPS was performed using ANOVA with post-hoc t-tests between histologically defined tumor groups. Furthermore, the Spearman correlation coefficient was determined between fBV and histologic grade, kPS and histologic grade, and fBV and kPS. Total permeability, k = k1 + k2, was additionally evaluated in place of kPS.
Results
The histologic evaluation of the brain tumors revealed a single grade 1 tumor (dysembryoplastic neuroepithelial tumor), eight grade 2 tumors (two astrocytomas, four oligodendrogliomas, and two mixed oligo-astrocytomas, Fig 2A), seven grade 3 tumors (six anaplastic astrocytomas and one oligodendroglioma), and six grade 4 tumors (glioblastoma multiforme, Fig 2B). Typical enhancement data from a low-grade (grade 2) and a high-grade (grade 4) tumor as well as the corresponding blood signals along with fitted curves from the kinetic model are displayed in Figure 3.
fig 2.
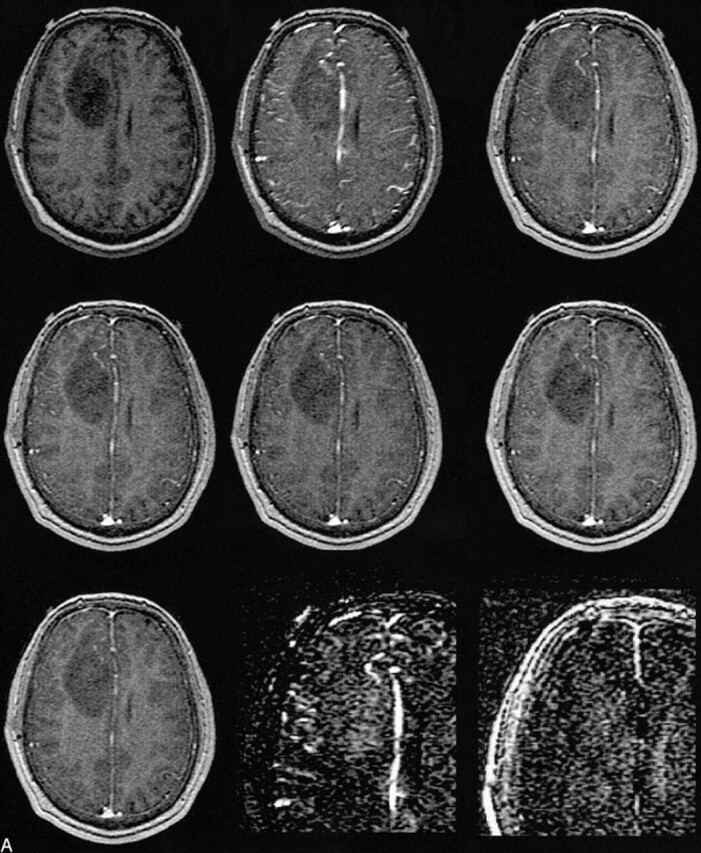
A, MR image before contrast administration (top left) and six dynamic contrast-enhanced MR images of a grade 2 oligoastrocytoma. Top center, 15 seconds; top right, 45 seconds; middle left, 75 seconds; middle center, 105 seconds; middle right, 135 seconds; and lower left, 165 seconds after contrast administration. From these seven images, spatial maps of fBV and kPS were determined: fBV (lower center) was estimated as 12.8% in the ventral, enhancing part of the tumor and as 9.3% in the more dorsal part. kPS values (lower right) were 0.31 mL/100 cm3 per minute in the tumor (compared with 0.02 mL/100 cm3 per minute in normal brain tissue)
fig 3.

A–D, Fitted curves of the ΔSI time course of a typical low-grade (A, B) and a typical high-grade (C, D) tumor. Dynamic postcontrast values for the reference vascular signal (sagittal sinus) are displayed in A and C, respectively, and for tumor curves in B and D, respectively. The equations are displayed on the graphs. The low-grade tumor (patient 8 in Table 1) has an fBV of 3.2%, k1 + k2 is 5.8, and kPS is 5.5; the high-grade tumor (patient 20 in Table 1) has an fBV of 6.7%, k1 + k2 is 13.7, and kPS is 10.8. Times are defined as the time after contrast administration that the center of k-space (mid-part of 3D acquisition) was attained.
The estimated fBV values ranged from 0.5% to 13.7% (Table 1). There was a tendency toward higher blood volumes in tumors of a higher grade, but the correlation was weak (r = .39, Fig 4A) and there was no statistically significant difference between any of the groups (Table 2).
TABLE 1:
Quantitative estimates of fBV, kPS, and total permeability, k (based on the sum of k1 and k2), for the 22 patients
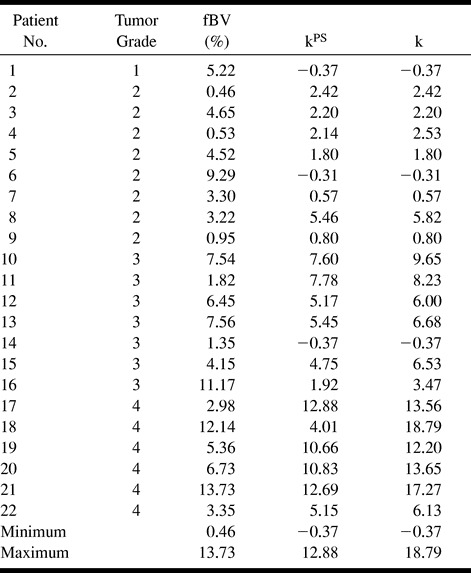
fig 4.

A–C, Correlation between fBV (A), kPS (B), and total permeability, k, (C) and histologically determined tumor grade. While the data points in A are very scattered, reflective of a weak correlation (r = .39) between fBV and tumor grade, the slope is nonetheless positive, suggesting a tendency toward increased fBV in higher-grade tumors. For kPS, the tendency is more pronounced, with reduced scatter (r = .76). In comparison, total permeability, k, yielded a similar correlation (r = .83), with a steeper slope and less overlap between tumor grade groups.
TABLE 2:
P values for t-tests for the parameters fBV, kPS, and the “total permeability” k to differentiate among histologically determined tumor gradesa
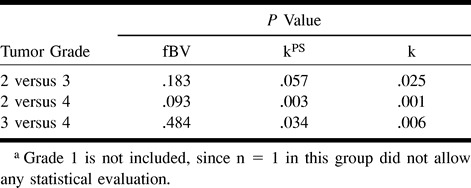
The kPS values ranged from −0.4 to 18.8 (Table 1). We found a strong correlation (r = .76) between microvascular permeability kPS and tumor grade (Fig 4B). Despite some overlap between the different grades (most pronounced between grades 2 and 3), there was a statistically significant difference between kPS vales of specific tumors from different tumor grades (3 versus 4, P = .034; 2 versus 4, P = .003; Table 2). The difference between grade 2 and grade 3 tumors was not significant (P = .057). Total permeability, k, largely paralleled kPS, with a correlation of .83 between k and tumor grade (Fig 4C). However, differences also achieved greater levels of significance between grade 2 and grade 3 tumors (2 versus 3, P = .025; 3 versus 4, P = .006; 2 versus 4, P = .001; Table 2) owing to the inclusion of the reflux rate term, which was greater in the more aggressive tumors, accentuating the difference between higher and lower grade tumors.
Discussion
There are several clinical demands for a noninvasive method to characterize brain tumors. Despite its widespread clinical use, histologic tumor grade alone at times can be an unreliable predictor of patients' outcome. Furthermore, a noninvasive technique could help guide a surgeon to the most malignant spot before a biopsy. Other potential uses for permeability measurements might be for follow-up after therapy (eg, to monitor the success of chemotherapy or to differentiate radiation necrosis or postsurgical scar tissue from recurring tumor) or to noninvasively monitor the efficacy of a new treatment for gliomas, such as antiangiogenic pharmaceuticals.
The results of our study indicate that with a dynamic T1-weighted MR sequence we can quantify both the fBV and microvascular permeability in human brain tumors. Furthermore, these quantifications correlate with the histopathologic tumor grade (Fig 4) and allow statistically significant differentiation among tumor grades (Table 2).
Several studies have been reported in which first-pass MR imaging (22–24) or nuclear medicine methods, such as single-photon emission CT (SPECT) or positron emission tomography (PET) (25), were used to investigate the correlation between relative cerebral blood volume (rCBV) and tumor grading in gliomas. 18F-fluorodeoxyglucose (FDG)-PET and 201Tl-SPECT are considered to have a good specificity for tumor malignancy (26–30), but they lack a sufficient spatial resolution (resulting in insensitivity to small lesions) and suffer from insensitivity to low-grade intraaxial brain tumors (27). Furthermore, PET still lacks sufficient availability to be considered a viable clinical approach for routine application.
Contrast-enhanced MR imaging has spawned two distinct methods, based on differing philosophies, for the measurement of rCBV. Most commonly used are the first-pass techniques, based on the magnetic susceptibility contrast phenomenon and the resulting changes in T2* (22–24, 31). These were typically pioneered in studies of acute cerebral ischemia (32–35). T2* methods, albeit studied widely, have certain disadvantages. They require implementation on high-field magnets, preferably with the use of echo-planar or, with lower spatial or temporal resolution, gradient-echo sequences. Without a reference blood signal, only rCBV values can be obtained. Even with more sophisticated analyses, including arterial input function (36–38), CBV determinations remain approximate. The anatomic coverage is typically limited, and there is sensitivity to susceptibility artifacts near large vessels or osseous structures, which, for example, make it difficult to assess infratentorial tumors (31).
To alleviate some of these disadvantages, a method based on the relaxivity effect of contrast agents (ie, T1 measurements) was introduced (39, 40). Overall, image quality is better with the T1 technique but this method is limited to two slices and it relies on a sharp bolus injection of the contrast agent. Interestingly, in comparisons of the T2* and the T1 methods, no statistically significant correlation was found between the rCBV values obtained in normal brain tissue (39). The results of all these studies, whether they are based on T2* or T1 effects of a contrast agent, have shown that increased malignancy is associated with increased blood volume and that, in principle, it might be possible to differentiate between low- and high-grade gliomas, although no statistically significant difference has been found between the rCBV values in the different tumor grades (39, 40).
The 3D-SPGR sequence we used provides high spatial resolution and anatomic coverage in exchange for low temporal resolution. Using this sequence, we observed a positive but weak correlation (r = .39) between fBV and tumor grade. It seems unlikely that low temporal resolution can be the source of the weak correlation between fBV and grade: if the first postcontrast image is acquired too late, there would most likely be leakage of some contrast agent from the blood pool into the interstitium before the first postcontrast imaging point. This effect would presumably be most pronounced in high-grade (and thus “leaky”) tumors. In general, this would result in an overestimation of the tissue fBV and an underestimation of the permeability; in particular, this overestimation of blood volume would most likely be more pronounced for high-grade tumors, by virtue of their higher permeability. Conversely, permeability estimates are likely to be most affected for higher-grade tumors, with the error tending toward underestimation. Consequently, too low a temporal resolution would yield an artificial increase in fBV with tumor grade, which would rather tend to improve the correlation between fBV and grade. Conversely, the resultant underestimation of permeability as a consequence of low temporal resolution would degrade the correlation between permeability and grade.
Without compensation, use of any first-pass technique might result in an overestimation of the blood volume in the presence of a disrupted blood-brain barrier (BBB). Any small-molecular-weight contrast agent can be considered intravascular, and thus can be used for reliable blood volume quantifications only in the presence of an intact BBB. A disrupted BBB leads to extravasation of the contrast agent in the extravascular space, even during the first pass, which consequently may lead to an overestimation of the blood volume (39, 41, 42). Siegal et al (31) made use of the rapid leak of contrast agent into the extracellular space and interpreted its presence as indicative of tumor proliferation; however, their method did not allow any quantification of this phenomenon.
The analytic method described here is based on T1 changes after administration of contrast agent; however, it does not assess the first pass of the contrast agent but rather its distribution within the first few minutes after injection. It is less dependent on a sharp bolus and can thus be performed almost irrespective of the size of a cannula. Also, the sequence chosen is deliberately quite standard and can be performed similarly in high- or low-field magnets, so the technique can be readily implemented for clinical use on a variety of scanners.
The kinetic model applied in the present study not only allows correction of the estimated blood volume by consideration of the permeability effect, as has been suggested for some first-pass rCBV approaches, but furthermore separately identifies the quantified microvascular permeability in order to gain more information about a given tumor. Our data show that the microvascular permeability has a much higher correlation with tumor grade than do fBV estimates (Fig 4), and in fact allows statistical distinction among the tumor groups (Table 2).
Similar kinetic models have frequently been cited in the literature (15, 43, 44), both in the brain (17) and in the body periphery; eg, breast tumors (45). All yield estimates for fBV and permeability constants. There are, however, some subtle differences between the kinetic models. Additionally, some authors propose more empirical models to analyze dynamic data (46). In contrast to Tofts et al (45), whose permeability quantifications rely exclusively on k1, but similar to Su et al (44), we consider independently the two transfer constants k1 and k2. Furthermore we computed their sum to give an estimate of, as we define it, the “total microvascular permeability.” This procedure resulted in better differentiation among tumor grades, especially between grades 2 and 3, so that the summated permeability parameter seems clinically more useful. It is also important to consider the small but nonnegligible contribution of the vascular compartment to tissue signal change.
Theoretically, the quantifications could be improved by calculating Δ(1/T1) as an indicator of tracer concentration rather than by relying on signal intensity changes, ΔSI (14). This, however, requires a precontrast T1 determination and adds a time burden to the clinical routine. By maintaining low doses of contrast agent and using short TRs and TEs, nonlinearities in the relationship between ΔSI and Δ(1/T1) are ameliorated.
The synthesized parametric maps are, as described, based on a simplified kinetic model. Thus, the maps cannot really be used for regional quantifications; however, they facilitate immediate visualization and optimization of the ROI selection on the original images. They might potentially guide an automated region search and selection algorithm for more sophisticated analysis. Furthermore, the maps can be used to indicate the most malignant area in a heterogeneous tumor and may be used to guide biopsies. This may be particularly important in apparently low-grade gliomas, since approximately 80% of those may contain areas of higher grade anaplasia (47). Quantitative ROI analyses, however, allow high precision work-up of specific target regions. One can implement the full curve-fitting analysis, defined in Equations 1 and 2, on a pixel-by-pixel basis, but in our experience this is impractical and yields image maps that are potentially limited by noise.
We recognize that our method only assesses one aspect of tumor malignancy, its vascularity and neovascularity. There are, however, tumors with mitotic areas but no BBB disruption or angiogenic activity (48). These might account for the outliers, particularly in grade 3 and grade 4 tumors. Also there might be some fine structure or heterogeneity within the histologic grading system that accounts for some of the variation seen in kPS and fBV measures within tumors grouped into the same histologic grade.
The histologic finding of vascular proliferation, with or without endothelial proliferation, is associated with a poor clinical outcome (47). Thus, studies are underway that correlate the permeability measurements with vascular density, proliferation, time to tumor relapse, and patient's outcome. It is anticipated that increased specificity for tumor grade will be achieved by combining noninvasive MR imaging estimates of microvascular permeability with other measures of tumor state, such as diffusion-weighted imaging findings (cellularity) or MR spectroscopy results (metabolic activity).
Conclusion
The use of dynamic contrast-enhanced MR imaging to quantify microvascular characteristics of brain tumors provides only a weak correlation between blood volume and tumor grade; however, the correlation between microvascular permeability and tumor grade is strong, and differences between tumors of different histologic grades are statistically significant.
fig 2.
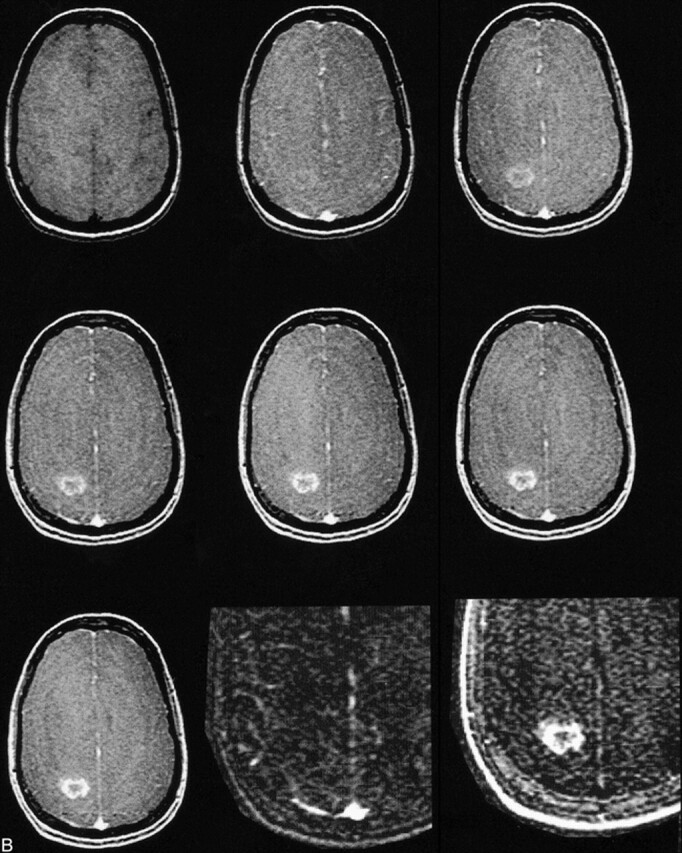
B, MR image before contrast administration (top left) and six dynamic contrast-enhanced MR images of a grade 4 glioblastoma multiforme. Top center, 15 seconds; top right, 45 seconds; middle left, 75 seconds; middle center, 105 seconds; middle right, 135 seconds; and lower left, 165 seconds after contrast administration. From these seven images, spatial maps of fBV and kPS were determined: fBV (lower center) was estimated as 3.0% in the tumor rim and as 0.01% in the core. kPS values (lower right) were 13.6 mL/100 cm3 per minute in the tumor (compared with 0.5 mL/100 cm3 per minute in the core). Times are defined as the time after contrast that the center of k-space (mid-part of 3D acquisition) was attained.
Acknowledgments
We acknowledge Ben Mow and Patricia Memon for excellent technical assistance. We also thank David Shames and members of the contrast media laboratory, UCSF, for insightful comments and discussions.
Footnotes
Presented at the annual meeting of the American Society of Neuroradiology, San Diego, May 1999.
Address reprint requests to Heidi C. Roberts, MD.
References
- 1.Hirata A, Baluk P, Fujiwara T, McDonald DM. Location of focal silver staining at endothelial gaps in inflamed venules examined by scanning electron microscopy. Am J Physiol 1995;269:L403-418 [DOI] [PubMed] [Google Scholar]
- 2.Nugent LJ, Jain RK. Extravascular diffusion in normal and neoplastic tissues. Cancer Res 1984;44:238-244 [PubMed] [Google Scholar]
- 3.Jain RK, Gerlowski LE. Extravascular transport in normal and tumor tissues. Crit Rev Oncol Hematol 1986;5:115-170 [DOI] [PubMed] [Google Scholar]
- 4.Jain RK. Vascular and interstitial barriers to delivery of therapeutic agents in tumors. Cancer Metastasis Rev 1990;9:253-266 [DOI] [PubMed] [Google Scholar]
- 5.Brasch R, Pham C, Shames D, et al. Assessing tumor angiogenesis using macromolecular MR imaging contrast media. J Magn Reson Imaging 1997;7:68-74 [DOI] [PubMed] [Google Scholar]
- 6.Folkman J. The role of angiogenesis in tumor growth. Semin Cancer Biol 1992;3:65-71 [PubMed] [Google Scholar]
- 7.van Dijke CF, Brasch RC, Roberts TP, et al. Mammary carcinoma model: correlation of macromolecular contrast-enhanced MR imaging characterizations of tumor microvasculature and histologic capillary density. Radiology 1996;198:813-818 [DOI] [PubMed] [Google Scholar]
- 8.Schwickert HC, Stiskal M, Roberts TP, et al. Contrast-enhanced MR imaging assessment of tumor capillary permeability: effect of irradiation on delivery of chemotherapy. Radiology 1996;198:893-898 [DOI] [PubMed] [Google Scholar]
- 9.Gossmann A, Okuhata Y, Shames DM, et al. Prostate cancer tumor grade differentiation by dynamic contrast-enhanced MR imaging: comparison of macromolecular and small-molecular contrast media. Radiology (in press) [DOI] [PubMed]
- 10.Daldrup H, Shames DM, Wendland M, et al. Correlation of dynamic contrast-enhanced MR imaging with histologic tumor grade: comparison of macromolecular and small-molecular contrast media. AJR Am J Roentgenol 1998;171:941-949 [DOI] [PubMed] [Google Scholar]
- 11.Pham CD, Roberts TP, van Bruggen N, et al. Magnetic resonance imaging detects suppression of tumor vascular permeability after administration of antibody to vascular endothelial growth factor. Cancer Invest 1998;16:225-230 [DOI] [PubMed] [Google Scholar]
- 12.Gossmann A, Ostrowitzki S, Helbich T, et al. Effects of anti-VEGF antibody on malignant gliomas assessed by dynamic contrast enhanced MRI. In: Proceedings of International Society of Magnetic Resonance in Medicine: Sydney, Australia, 1998. International Society of Magnetic Resonance in Medicine; 1998:370
- 13.Schwickert HC, Roberts TP, Shames DM, et al. Quantification of liver blood volume: comparison of ultra short TI inversion recovery echo planar imaging (ULSTIR-EPI), with dynamic 3D-gradient recalled echo imaging. Magn Reson Med 1995;34:845-852 [DOI] [PubMed] [Google Scholar]
- 14.Roberts TP. Physiologic measurements by contrast-enhanced MR imaging: expectations and limitations. J Magn Reson Imaging 1997;7:82-90 [DOI] [PubMed] [Google Scholar]
- 15.Hittmair K, Gomiscek G, Langenberger K, Recht M, Imhof H, Kramer J. Method for the quantitative assessment of contrast agent uptake in dynamic contrast-enhanced MRI. Magn Reson Med 1994;31:567-571 [DOI] [PubMed] [Google Scholar]
- 16.Tofts PS. Modeling tracer kinetics in dynamic Gd-DTPA MR imaging. J Magn Reson Imaging 1997;7:91-101 [DOI] [PubMed] [Google Scholar]
- 17.Tofts PS, Kermode AG. Measurement of the blood-brain barrier permeability and leakage space using dynamic MR imaging, 1: fundamental concepts. Magn Reson Med 1991;17:357-367 [DOI] [PubMed] [Google Scholar]
- 18.Shames DM, Kuwatsuru R, Vexler V, Mühler A, Brasch RC. Measurement of capillary permeability to macromolecules by dynamic magnetic resonance imaging: a quantitative noninvasive technique. Magn Reson Med 1993;29:616-622 [DOI] [PubMed] [Google Scholar]
- 19.Patlak CS, Goldstein DA, Hoffman JF. The flow of solute and solvent across a two-membrane system. J Theor Biol 1963;5:426-442 [DOI] [PubMed] [Google Scholar]
- 20.Patlak CS, Blasberg RG, Fenstermacher JD. Graphic evaluation of blood-to-brain transfer constants from multiple-time uptake data. J Cereb Blood Flow Metab 1983;3:1-7 [DOI] [PubMed] [Google Scholar]
- 21.Demsar F, Roberts TP, Schwickert HC, et al. A MRI spatial mapping technique for microvascular permeability and tissue blood volume based on macromolecular contrast agent distribution. Magn Reson Med 1997;37:236-242 [DOI] [PubMed] [Google Scholar]
- 22.Aronen HJ, Glass J, Pardo FS, et al. Echo-planar MR cerebral blood volume mapping of gliomas: clinical utility. Acta Radiol 1995;36:520-528 [PubMed] [Google Scholar]
- 23.Rosen BR, Belliveau JW, Aronen HJ, et al. Susceptibility contrast imaging of cerebral blood volume: human experience. Magn Reson Med 1991;22:293-299 [DOI] [PubMed] [Google Scholar]
- 24.Maeda M, Itoh S, Kimura H, et al. Tumor vascularity in the brain: evaluation with dynamic susceptibility-contrast MR imaging. Radiology 1993;189:233-238 [DOI] [PubMed] [Google Scholar]
- 25.Lammertsma A, Wise R, Jones T. In vivo measurements of regional cerebral blood flow and blood volume in patients with brain tumours using positron emission tomography. Acta Neurochir 1983;69:5-13 [DOI] [PubMed] [Google Scholar]
- 26.Black K, Emerick T, Hoh C, Hawkins R, Mazziotta J, Becker D. Thallium-201 SPECT and positron emission tomography equal predictors of glioma grade and recurrence. Neurol Res 1994;16:93-96 [DOI] [PubMed] [Google Scholar]
- 27.Kahn D, Follett KA, Bushnell DL, et al. Diagnosis of recurrent brain tumor: value of 201Tl SPECT vs 18F-fluorodeoxyglucose PET. AJR Am J Roentgenol 1994;163:1459-1465 [DOI] [PubMed] [Google Scholar]
- 28.Kaplan WD, Takvorian T, Morris JH, Rumbaugh CL, Connolly BT, Atkins HL. Thallium-201 brain tumor imaging: a comparative study with pathologic correlation. J Nucl Med 1987;28:47-52 [PubMed] [Google Scholar]
- 29.Kim KT, Black KL, Marciano D, et al. Thallium-201 SPECT imaging of brain tumors: methods and results. J Nucl Med 1990;31:965-969 [PubMed] [Google Scholar]
- 30.Vertosick FT, Selker RG, Grossman SJ, Joyce JM. Correlation of thallium-201 single photon emission computed tomography and survival after treatment failure in patients with glioblastoma multiforme. Neurosurgery 1994;1994:396-401 [DOI] [PubMed] [Google Scholar]
- 31.Siegal T, Rubinstein R, Tzuk-Shina T, Gomori JM. Utility of relative cerebral blood volume mapping derived from perfusion magnetic resonance imaging in the routine follow up of brain tumors. J Neurosurg 1997;86:22-27 [DOI] [PubMed] [Google Scholar]
- 32.Villringer A, Rosen BR, Belliveau JW, et al. Dynamic imaging with lanthanide chelates in normal brain: contrast due to magnetic susceptibility effects. Magn Reson Med 1988;6:164-174 [DOI] [PubMed] [Google Scholar]
- 33.Rosen BR, Belliveau JW, Aronen H, et al. Susceptibility contrast imaging of cerebral blood volume: human experience. Magn Reson Med 1991;22:293-299 [DOI] [PubMed] [Google Scholar]
- 34.Kucharczyk J, Roberts T, Moseley ME, Watson A. Contrast-enhanced perfusion-sensitive MR imaging in the diagnosis of cerebrovascular disorders. J Magn Reson Imaging 1993;3:241-245 [DOI] [PubMed] [Google Scholar]
- 35.Kucharczyk J, Vexler ZS, Roberts TP, et al. Echo-planar perfusion-sensitive MR imaging of acute cerebral ischemia. Radiology 1993;188:711-717 [DOI] [PubMed] [Google Scholar]
- 36.Perman WH, Gado MH, Larson KB, Perlmutter JS. Simultaneous MR acquisition of arterial and brain signal-time curves. Magn Reson Med 1992;28:74-83 [DOI] [PubMed] [Google Scholar]
- 37.Ostergaard L, Sorensen AG, Kwong KK, Weisskoff RM, Gyldensted C, Rosen BR. High resolution measurement of cerebral blood flow using intravascular tracer bolus passages, II: experimental comparison and preliminary results. Magn Reson Med 1996;36:726-736 [DOI] [PubMed] [Google Scholar]
- 38.Ostergaard L, Weisskoff RM, Chesler DA, Gyldensted C, Rosen BR. High resolution measurement of cerebral blood flow using intravascular tracer bolus passages, I: mathematical approach and statistical analysis. Magn Reson Med 1996;36:715-725 [DOI] [PubMed] [Google Scholar]
- 39.Hackländer T, Reichenbach JR, Mödder U. Comparison of cerebral blood volume measurements using the T1 and T2* methods in normal human brains and brain tumors. J Comput Assist Tomogr 1997;21:857-866 [DOI] [PubMed] [Google Scholar]
- 40.Hackländer T, Hofer M, Reichenbach JR, Rascher K, Fürst G, Mödder U. Cerebral blood volume maps with dynamic contrast-enhanced T1-weighted FLASH imaging: normal values and preliminary clinical results. J Comput Assist Tomogr 1996;20:532-539 [DOI] [PubMed] [Google Scholar]
- 41.Petrella JR, Wong J, Provenzale JM. False positive cerebral blood volume maps: a potential pitfall in evaluation of monoclonal antibody-treated gliomas. In: Proceedings of Joint Meeting of the ASNR, ASHNR, ASPNR, ASITN, ASSR: San Diego, CA, 1999. Oak Brook, IL: American Society of Neuroradiology;1999:59
- 42.Roberts HC, Saeed M, Roberts TP, et al. Comparison of albumin-(Gd-DTPA)30 and Gd-DTPA-24-cascade-polymer for measurements of normal and abnormal microvascular permeability. J Magn Reson Imaging 1997;7:331-338 [DOI] [PubMed] [Google Scholar]
- 43.Brix G, Semmler W, Port R, Schad L, Layer G, Lorenz W. Pharmacokinetic parameters in CNS Gd-DTPA enhanced MR imaging. J Comput Assist Tomogr 1991;15:621-628 [DOI] [PubMed] [Google Scholar]
- 44.Su MY, Najafi AA, Nalcioglu O. Regional comparison of tumor vascularity and permeability parameters measured by albumin-Gd-DTPA and Gd-DTPA. Magn Reson Med 1995;34:402-411 [DOI] [PubMed] [Google Scholar]
- 45.Tofts PS, Berkowitz B, Schnall MD. Quantitative analysis of dynamic Gd-DTPA enhancement in breast tumors using a permeability model. Magn Reson Med 1995;33:564-568 [DOI] [PubMed] [Google Scholar]
- 46.Wong ET, Jackson EF, Hess KR, et al. Correlation between dynamic MRI and outcome in patients with malignant gliomas. Neurology 1998;50:777-781 [DOI] [PubMed] [Google Scholar]
- 47.Russel D, Rubinstein L. Tumors of central neuroepithelial origin. In: Pathology of Tumours of the Nervous System. Baltimore: Williams & Wilkins; 1989;83
- 48.Sugahara T, Korogi Y, Kochi M, et al. Correlation of MR imaging-determined cerebral blood volume maps with histologic and angiographic determination of vascularity of gliomas. AJR Am J Roentgenol 1998;171:1479-1486 [DOI] [PubMed] [Google Scholar]