Abstract
BACKGROUND AND PURPOSE: Gray matter may be affected by multiple sclerosis (MS), a white matter disease. Magnetization transfer ratio (MTR) is a sensitive and quantitative marker for structural abnormalities, and has been used frequently in the imaging of MS. In this study, we evaluated the amount of MTR of gray matter among patients with relapsing-remitting MS and healthy control subjects as well as the correlation between gray matter MTR abnormality and neurologic disability associated with relapsing-remitting MS.
METHODS: We obtained fast spin-echo dual-echo and magnetization transfer (with and without MT saturation pulses) images from eighteen patients with relapsing-remitting MS and 18 age-matched healthy control subjects. Gray matter was segmented using a semiautomated system. Gray matter MTR histogram parameters, Kurtzke Expanded Disability Status Scale (EDSS), total T2 lesion volume, and gray matter volumes were obtained for statistical analysis.
RESULTS: A significant difference was found in gray matter MTR between patients with relapsing-remitting MS and healthy subjects (mean and median). Gray matter MTR histogram normalized peak heights in patients inversely correlated with EDSS (r = −0.65, P = .01). There was also an inverse correlation between mean MTR of gray matter and total T2 lesion volume.
CONCLUSION: The MTR of gray matter significantly differed between patients with relapsing-remitting MS and healthy control subjects, suggesting that MS is a more diffuse disease affecting the whole brain, and neuronal damage accumulates in step with T2 lesion volume. Our finding of the relationship between gray matter MTR and EDSS indicates that measurement of gray matter abnormality may be a potentially useful tool for assessing clinical disability in MS.
Magnetization transfer (MT) imaging has become an important tool for accurately monitoring the evolution and disease process of multiple sclerosis (MS) (1–3). Additionally, it provides information on tissue structures and structural components that are normally not resolvable with MR imaging. MT theory is based on the exchange of proton magnetization between water and non-water structural components (4). The attraction of MT imaging is that, with the MT saturation pulse on and off, this MT effect can be quantified and expressed as magnetization transfer ratio (MTR) (5, 6). MTR can be assessed for each voxel of a region of interest or a volume image. The advantages of the MTR histogram analysis include the quantitative nature of tissue destruction and sensitivity to the presence of disease (3).
Previous work from animal and human studies has demonstrated decreased MTR values may reflect demyelination (5, 7, 8) or axonal injury (9, 10). The correlations between MTR abnormalities and neurologic disability have also been reported by several investigators who predominately relied on the measurements of lesions (11), normal-appearing white matter (NAWM) (12, 13) seen on T2-weighted images, and whole-brain studies (14–16). All of these results imply that MT imaging is a good indicator of both macroscopic and microscopic lesions that cannot be seen on conventional (proton density– and T2-weighted) imaging, and that MT plays an important role in monitoring the clinical status of MS (16). Nonetheless, a study of the MTR of gray matter in the normal brain and the brain affected by MS based on volume imaging and its relationship to clinical indices has not, to our knowledge, been reported.
MS is a demyelinating disease, and lesions are abundantly found in the white matter. However, both the pathologic (17, 18) and imaging studies (19, 20) have shown that lesions could involve gray matter, although sparsely. Recent study indicates that neuronal axons may be damaged in acute and chronic lesions, suggesting that gray matter (neuronal cell bodies) may ultimately suffer damage (21). Although cerebral cortex abnormality may cause clinical cortical syndromes, including dysphasia (22), dyscalculia (23), epilepsy (24), and psychometric deficits (25) as well as cortical motor and sensory loss (26) in MS, until recently, appropriate quantitative MR imaging techniques have not been readily available to examine the gray matter structural basis of this more complicated disease. A fundamental question that remains unresolved in MS is how this whole-brain white matter disease influences the subtle tissue abnormalities in the global gray matter and how the global gray matter abnormalities influence neurologic disability.
In this report, we analyzed the gray matter MTR values in patients with relapsing-remitting MS and healthy control subjects by using a combination of MT imaging and imaging segmentation to determine global abnormality of gray matter involved in patients with relapsing-remitting MS and its correlation with neurologic disability. Our hypothesis was that gray matter MTR would be affected by white matter disease and that global gray matter abnormalities would correlated with clinical parameters.
Methods
Subjects
Eighteen patients (15 women, three men) with clinically definite relapsing-remitting MS and eighteen healthy control subjects (12 women, six men) were studied with neurologic examination and MR imaging. The mean age of patients was 34.1 years (range, 26–52 yr) and mean disease duration was 5.3 years (range, 1–15 yr). The mean age of control subjects was 33.9 years (range, 23–53 yr). Kurtzke Expanded Disability Status Scale (EDSS) scores (27) (range, 0–6.5) of patients were obtained at the time of MR examinations. Informed consent was obtained from all patients and control subjects, and our institutional review board approved the protocol.
MR Imaging
MR imaging was performed on a Signa (General Electric Medical Systems, Milwaukee, WI) 1.5-T unit with a quadrature transmit/receive head coil. The conventional imaging protocol consisted of proton density– and T2-weighted axial fast spin-echo (FSE) dual-echo (2500/18/90/1 [TR/TE1/TE2/excitation], 3-mm section thickness, 22-cm field of view [FOV], 192 × 256-mm matrix). MT sequences were performed using a 3D gradient-echo sequence modified by an additional MT pulse (106/5/12° [TR/TE/flip angle]; FOV, 22 cm; matrix, 128 × 256 mm2; slice thickness, 5 mm). MT contrast was achieved by the application of a 19-ms sinc-shaped RF saturation pulse during the TR period, with an equivalent flip angle of 700°, which was applied at a frequency of 1.2 kHz below water resonance (28). Two identical sets of axial images with different contrast (with and without MT saturation pulses) were then obtained.
Image Processing and Analysis
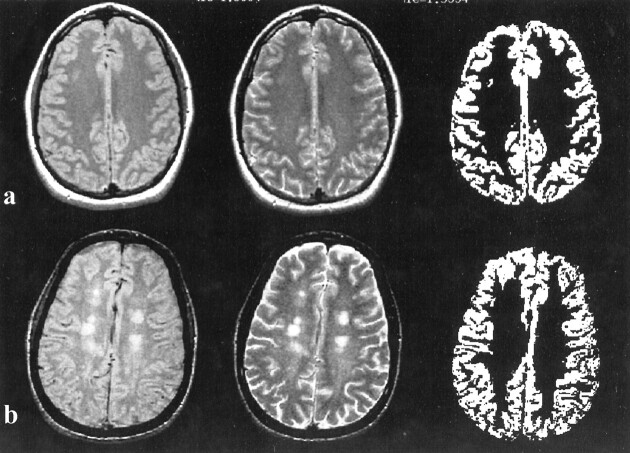
MR imaging data were transferred directly to a Sun Sparc workstation (Sun Microsystems, Mountain View, CA) via the picture archiving and communications system of our department. The calculation of gray matter volume was done by use of an internal version of the 3DVIEWNIX software system (29) (Medical Image Processing Group, University of Pennsylvania, Philadelphia, PA) using both proton density– and T2-weighted images. The process begins with segmentation of the intracranial brain and CSF by use of the theory of “fuzzy connectedness,” which has been previously described (30). All segmented brain volume images (more than 50 slices in each study) were then reviewed, and any residual extracranial and CSF components were excluded, if need be, by a neuroradiologist (Y.G.). Lesions, if present, gray matter, and white matter were also identified each as a 3D fuzzy object by using fuzzy connectedness (30, 31). The voxels belonging to MS lesions were removed from the gray matter mask in each study, resulting in a “pure” gray matter tissue volume image (Fig 1).
fig 1.
Segmentation of gray matter results (right) and corresponding proton density– (left) and T2-weighted (middle) in control subjects (A) and patients (B). Note that the enlargement of the sulci attributable to brain atrophy could be seen on the T2-weighted image (B, middle) in MS patients, which might be due to the volume loss of white matter
This technique creates a voxel-by-voxel volume image by using proton density– and T2-weighted images, and exhibits more than 95.5% intraobserver reproducibility of the segmentation for gray matter in repeat scans. The computation of MTR requires both the gray matter volume image and the MT images. Because the FSE images have a higher spatial resolution than the MT images, we registered the proton density–weighted images with MT images rather than vice versa. Once registered, for each voxel in the gray matter volume, the MTR can be calculated using the expression: MTR = [(Mo(Ms)/Mo] × 100%, where Mo and Ms represent the signal intensity of the voxel with the saturation pulse off and on, respectively (5). The MTR histograms of gray matter were then generated and normalized by dividing each histogram frequency value (ie, the total number of voxels with a certain MTR value) by the total number of voxels in the gray matter. The peak height of the histogram represents the largest normalized frequency in terms of one MTR value. The histographic analysis was performed in all control subjects and patients. To normalize the baseline differences (head size) in gray matter volume among patients and control subjects, an additional parameter, the fractional gray matter (%GM) volume, was calculated as the percentage of gray matter volume within the volume of intracranial contents to assess if gray matter had atrophy.
Statistical Analysis
We used the SAS software for histogram analysis. The summary gray matter MTR histogram statistics from each subject included in this study were the mean, median, mode (peak location), and first and second quartiles as well as the relative frequency of MTR (peak height). Age and gender were included in all analyses to control their potential confounding effects. Similarly, disease duration was included in all analyses examining the relationships among the outcome measures of the patients with relapsing-remitting MS.
Weighted least squares regression and analysis of variance were used to compare the patient and control subject with respect to each summary statistic. A Bonferroni correction for multiple-hypothesis tests was used to ensure an overall type I error rate no greater than 5% when comparing MS and control groups. Specifically, with respect to each statistic variable, the two groups were declared significantly different at the 5% level only if the P value for the relevant statistical test was less than .007. The weighting factor was included to account for the different number of voxels examined for each patient. For patients with relapsing-remitting MS, least squares regression and Pearson product-moment correlation coefficients were used to examine the relationship between each summary statistic and the MR tissue volume measurements (ie, gray matter volume and T2 lesion volume). Spearman rank correlation coefficients were used to assess the association between each summary statistic and the ordinal clinical index (ie, EDSS).
Results
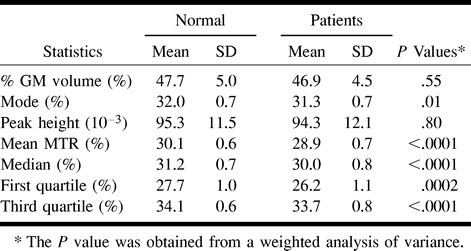
As summarized in the Table, a significant difference was found in the gray matter MTR histogram mean (P < .0001), median (P < .0001), first quartile (P < .0002), and third quartile (P < .0001) between patients with relapsing-remitting MS and control subjects, although there was no statistical difference for %GM volume between patients and control subjects. The coefficient of variation (CV) for each MTR parameter is very small (CV ≤ 0.04) for both patients and control subjects, except for MTR histogram peak height (CV = 0.13). The mode did not reach statistical significance (P = .01) after the Bonferroni correction was implemented. There was no significant difference for MTR histogram peak height between patients and control subjects.
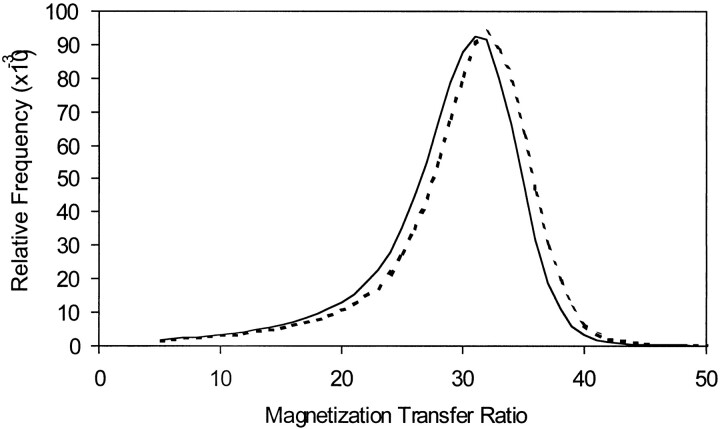
Figure 2 shows the averaged histograms of the gray matter MTR means from the 18 patients with MS and 18 control subjects, respectively. Relative to the control subjects, the histogram of the patients was shifted to the left. This indicates the increased number of voxels with lower MTR values for global gray matter in patients compared with control subjects. The similar normalized peak heights in these two groups suggest that most of the gray matter voxels had a similar relative frequency of MTR mode even when the distribution was shifted in patients in this study.
fig 2.
The average gray matter MTR histograms between 18 relapsing-remitting MS patients (solid line) and 18 age-matched control subjects (dotted line). Note the whole body of the histogram was shifted to the left in MS patients, although the peak height is similar with healthy individuals
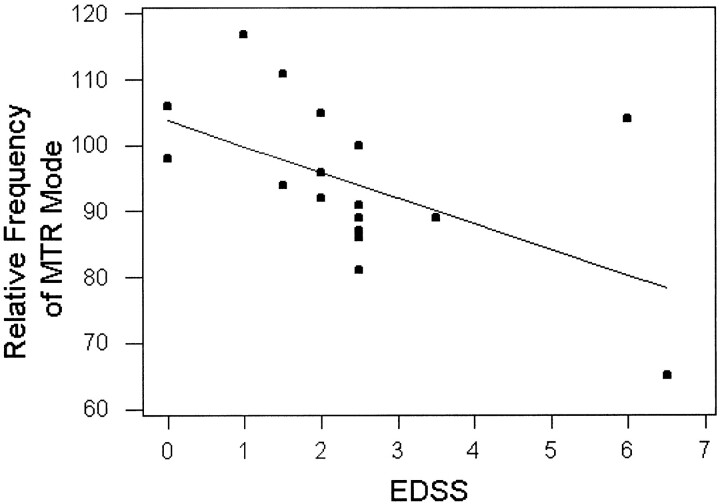
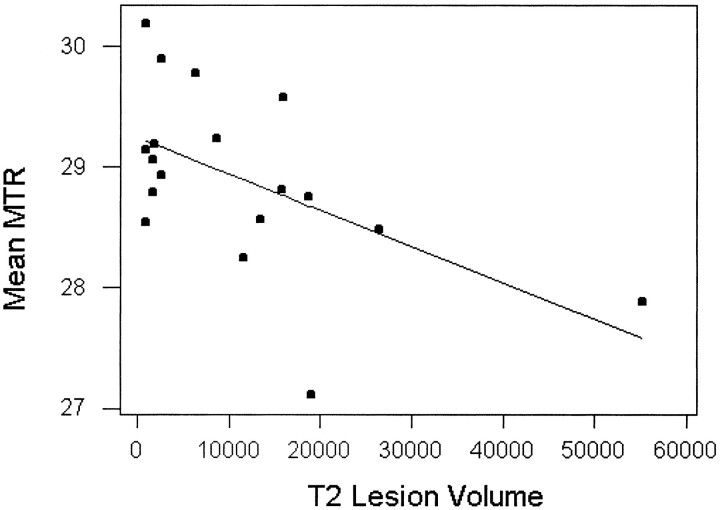
We also studied the relationships between MTR histogram statistics with clinical index (EDSS) and MR tissue volume measurements (gray matter, T2 lesions). Spearman rank correlation coefficients demonstrated that EDSS was inversely correlated with both MTR histogram peak heights (relative frequency of MTR mode) and first quartile (r = −0.65, P < .01 [for both]), as shown in Figure 3. EDSS was observed to have a significant positive correlation with MTR histogram SD (r = 0.62, P < .01). A correlation between EDSS and T2 lesion load in this study was absent (r = .0.27). There was also an inverse correlation (Fig 4) between MTR histogram mean and total T2 lesion volume (Pearson correlation coefficient, r = −0.55, P = .017). We did not find any significant correlation between any MTR histogram statistic and either %GM volume or disease duration. No correlation was found among MTR histogram mean, peak location, EDSS, and other MR imaging volume measurements.
fig 3.
Regression analysis of relative frequency of gray matter MTR mode versus EDSS in relapsing-remitting MS patients. Dots are the relative frequencies of gray matter MTR mode (peak heights) for individual patients on EDSS. The line represents the predictive relative frequency of MTR mode with EDSS as a function. There was an inverse correlation (Spearman rank correlation, r = −0.65) between relative frequency of mode and EDSS
fig 4.
Regression analysis of gray matter MTR mean values versus total T2 lesion volume (mm3) in relapsing-remitting MS patients. Dots are the mean MTR values for individual patients. The line represents the predictive mean MTR with total T2 lesion volume as a function. There was an inverse correlation (Pearson correlation coefficient, r = −0.55) between mean MTR of gray matter and T2 lesion volume
Discussion
MTR histogram analysis for gray matter in this study allowed successful evaluation of global gray matter change in a cohort of patients with MS. The mean histogram of gray matter MTR from MS patients was shifted to the left relative to the mean histogram in control subjects (Fig 2), although by a small amount (30.1% ± 0.6% to 28.9% ± 0.7%, mean). The decrease in gray matter MTR in patients may have resulted from a fundamental feature of the disease or a passive upstream effect on the cell bodies of the gray matter due to axonal degeneration in the white matter. It is noted that small plaques can be found within the cerebral cortex or straddling the junction of the cortex and white matter, possibly reflecting the origin of myelinated axons in the gray matter (32). Loss of neurons in the gray matter occurring in MS has also been suggested by brain atrophy (Fig 1) (33, 34), as well as decreased N-acetylaspartate (NAA), which is considered as a neuronal marker by MR spectroscopy (35, 36). A significant difference in the MTR histogram statistics of gray matter between patients and control subjects in our study probably also provides another insight that MS is not only a disease with multifocal white matter lesions, but is also a disease with diffuse involvement of gray matter.
Although previous studies based on brain parenchyma volume showed a lower MTR histogram peak height for MS patients compared with control subjects (14, 15), the present study found no such difference. This may have resulted from the fact that the parenchyma includes more lesions with very low MTR values in those studies (14, 15). Our results were based on gray matter, after lesions in gray matter seen on FSE T2-weighted images were removed by the segmentation algorithm. This would increase the peak heights observed for the MS patients, rendering them statistically indistinguishable from those of control subjects. The significant lower gray matter MTR mean, median, and first and third quartiles suggest gray matter change in MS may be diffuse. This is reflected by the whole left-shifted MTR histogram in the patient group, but with similar shape relative to the control group. We did not find the significant gray matter atrophy in patients represented by %GM volume, although there was enlargement of sulci in some patients (Fig 1). The sulcal enlargement in patients relative to control subjects might be due to the loss of white matter volume within the gyral cores and subarcuate fibers.
The primary motor projection cortex and the primary sensory projection cortex in gray matter are associated closely with clinical functions. This motivated us to try to correlate the gray matter MTR histogram values with clinical conditions of MS patients. The inverse correlation between gray matter histogram peak height and EDSS among patients may suggest that low peak height would then tend to indicate more disease process in gray matter and therefore higher EDSS (Fig 3). At the same time, we found a positive correlation between EDSS and SD of gray matter MTR (r = 0.62, P < .01), which most likely reflects variation of pathologic abnormalities in the gray matter MTR among patients. As MTR histogram peak height is defined as reflecting the amount of remaining normal tissue (6, 14) and is inversely related to the amount of tissue affected by the disease, decreasing variation of MTR would increase the peak height of MTR and then decrease EDSS. This is consistent with the relationship previously described between the peak height of whole-brain MTR histograms and EDSS (16). It is also in agreement with the inverse relation between NAA peaks and disability noted in previous studies (37–39). Recent studies have also provoked interest in the neuronal loss (gray matter atrophy) (40) and brain atrophy (41) associated with clinical severity in MS patients, particularly because the clinical relevance of measuring T2 lesion load is still considered controversial (42). All of these studies imply that greater gray matter abnormality in patients may reflect more clinical dysfunction because of degeneration in the primary motor and sensory cortex in gray matter. The finding of poor correlation between T2 lesion load and EDSS would tend to further support to the concept that gray matter MTR measures provide independent information on clinical disability in this patient group. In addition, as other authors have demonstrated, disability also seems to be determined by spinal cord involvement (43).
Data from the present study reveal a relationship between total T2 lesion volume and reduction of mean MTR values of GM. Greater gray matter abnormality manifested by lower MTR may be expected when total lesion volume is high, even though the changes in the gray matter were not easily found by conventional FSE T2-weighted imaging. It seems likely that the severity of disease in the white matter is one factor predictive of gray matter involvement (Fig 4). The pathogenesis of gray matter abnormality is still unknown. However, recent data (44) have shown that there is a significant decrease of global cortical metabolic rate of glucose in MS patients detected by positron emission tomography, suggesting neuronal cell dysfunction in the gray matter in MS. It is also possible that the axonal destruction in acute and chronic MS lesions could be responsible for the neuronal cell body disorder because of axonal disconnection to the cortex and resulting wallerian degeneration (21, 45).
In summary, in our study, MT imaging helped quantitate global gray matter abnormality that may reflect underlying pathologic changes in the gray matter in MS, which may, in turn, reflect chronic neurodegeneration. The gray matter MTR abnormality indicates MS is a diffuse disease affecting the whole brain, and corresponds to the clinical status. The inverse correlation between MTR and total lesion volume suggests that neuronal damage accumulates in step with white matter lesions in MS. Moreover, the ability to monitor the tissue destruction of this methodology may prove useful as a surrogate marker of clinical disability in MS and in evaluating the efficacy of therapeutic interventions.
Comparison of each summary MTR histogram statistics for the relapsing-remitting MS and normal control groups
Footnotes
Supported in part by grant RO1 NS29029, NS37172, and NS34353 from the National Institutes of Health.
Address reprint requests to Robert I. Grossman, M.D., Department of Radiology, Hospital of the University of Pennsylvania, Founders, 3400 Spruce Street, Philadelphia, PA 19104-4283.
References
- 1.Grossman RI, Gomori JM, Ramer KN, et al. Magnetization transfer: theory and clinical applications in neuroradiology. Radiographics 1994;14:279-290 [DOI] [PubMed] [Google Scholar]
- 2.van Buchem MA, Grossman RI, Armstrong C, et al. Correlation of volumetric magnetization transfer imaging with clinical data in multiple sclerosis. Neurology 1998;50:1609-1617 [DOI] [PubMed] [Google Scholar]
- 3.Grossman RI, McGowan JC. Perspective of multiple sclerosis. AJNR Am J Neuroradiol 1998;19:1251-1265 [PMC free article] [PubMed] [Google Scholar]
- 4.Wolff SD, Balaban RS. Magnetization transfer contrast (MTC) and tissue water proton relaxation in vivo. Magn Reson Med 1989;10:135-144 [DOI] [PubMed] [Google Scholar]
- 5.Dousset V, Grossman RI, Ramer KN, et al. Experimental allergic encephalomyelitis and multiple sclerosis: lesion characterization with magnetization transfer imaging. Radiology 1992;182:483-491 [DOI] [PubMed] [Google Scholar]
- 6.van Buchem MA, McGowan JC, Kolson DL, Polansky M, Grossman RI. Quantitative volumetric magnetization transfer analysis in multiple sclerosis: estimation of macroscopic and microscopic disease burden. Magn Reson Med 1996;36:632-636 [DOI] [PubMed] [Google Scholar]
- 7.Dousset V, Gayou A, Brochet B, Caille JM. Early structural changes in acute nascent MS lesions suggesting demyelination and remyelination assessed by in vivo serial quantitative magnetization transfer studies. Neurology 1998;51:1150-1155 [DOI] [PubMed] [Google Scholar]
- 8.Lexa FJ, Grossman RI, Rosenquist AC. MR of wallerian degeneration in the feline visual system: characterization by magnetization transfer rate with histopathologic correlation. AJNR Am J Neuroradiol 1994;15:201-212 [PMC free article] [PubMed] [Google Scholar]
- 9.Kasner SE, Galetta SL, McGowan JC, Grossman RI. Magnetization transfer imaging in progressive multifocal leukoencephalopathy. Neurology 1997;48:534-536 [DOI] [PubMed] [Google Scholar]
- 10.McGowan JC, McCormack TM, Grossman RI, et al. Diffuse axonal pathology detected with magnetization transfer imaging following brain injury in the pig. Magn Reson Med 1999;41:727-733 [DOI] [PubMed] [Google Scholar]
- 11.Gass A, Barker GJ, Kidd D, Thorpe JW, et al. Correlation of magnetization transfer ratio with clinical disability in multiple sclerosis. Ann Neurol 1994;36:62-67 [DOI] [PubMed] [Google Scholar]
- 12.Loevner LA, Grossman RI, Cohen JA, et al. Microscopic disease in normal-appearing white matter on conventional MR images in patients with multiple sclerosis: assessment with magnetization-transfer measurements. Radiology 1995;196:511-515 [DOI] [PubMed] [Google Scholar]
- 13.Catalaa I, Grossman RI, Kolson DL, et al. Magnetization transfer histogram analysis of segmented normal-appearing white matter in multiple sclerosis. Radiology 2000;26:351-355 [DOI] [PubMed] [Google Scholar]
- 14.van Buchem MA, Udupa JK, Heyning FH, et al. Global volumetric estimation of disease burden in multiple sclerosis based on magnetization transfer imaging. AJNR Am J Neuroradiol 1997;18:1287-1290 [PMC free article] [PubMed] [Google Scholar]
- 15.Philips MD, Grossman RI, Miki Y, et al. Comparison of T2 lesion volume on magnetization transfer ratio histogram analysis and of lesion burden in patients with multiple sclerosis. AJNR Am J Neuroradiol 1998;19:1055-1060 [PMC free article] [PubMed] [Google Scholar]
- 16.Miki Y, Grossman RI, Udupa JK, et al. Differences between relapsing-remitting and chronic progressive multiple sclerosis as determined with quantitative MR imaging. Radiology 1999;210:769-774 [DOI] [PubMed] [Google Scholar]
- 17.Brownell B, Hughes JT. The distribution of plaques in the cerebrum in multiple sclerosis. J Neurol Neurosurg Psychiatry 1962;25:315-320 [DOI] [PMC free article] [PubMed] [Google Scholar]
- 18.Ikuta F, Zimmerman HM. Distribution of plaques in seventy autopsy cases of multiple sclerosis in the United States. Neurology 1976;26:26-28 [DOI] [PubMed] [Google Scholar]
- 19.Newcombe J, Hawkins CP, Henderson CL, et al. Histopathology of multiple sclerosis lesions detected by magnetic resonance imaging in unfixed postmortem central nervous system tissue. Brain 1991;114:1013-1023 [DOI] [PubMed] [Google Scholar]
- 20.Catalaa I, Fulton JC, Zhang X, et al. MR imaging quantitation of gray matter involvement in multiple sclerosis and its correlation with disability measures and neurocognitive testing. AJNR Am J Neuroradiol 1999;20:1613-1618 [PMC free article] [PubMed] [Google Scholar]
- 21.Trapp BD, Peterson J, Ransohoff RM, Rudick R, Mork S, Bo L. Axonal transaction in the lesions of multiple sclerosis. New Engl J Med 1998;85:278-285 [DOI] [PubMed] [Google Scholar]
- 22.McAlpine D. Symptoms and signs. In: McAlpine D, Lumsden CE, Acheson ED. Multiple Sclerosis: A Reappraisal. 2nd ed. Edinburgh: Churchill Livingstone 1972:174-177 [Google Scholar]
- 23.Kahana E, Leibowitz U, Alter M. Cerebral multiple sclerosis. Neurology 1971;21:1179-1185 [DOI] [PubMed] [Google Scholar]
- 24.Matthews WB. Epilepsy and disseminated sclerosis. Quart J Med 1962;31:141-155 [PubMed] [Google Scholar]
- 25.Rao SM, Leo GJ, Haughton VM, St. Aubin-Faubert P, Bernardin L. Correlation of magnetic resonance imaging with neuropsychological testing in multiple sclerosis. Neurology 1989;39:161-166 [DOI] [PubMed] [Google Scholar]
- 26.Poser S. Multiple Sclerosis: an Analysis of 812 Cases by Means of Electronic Data Processing.. Berlin: Springer 1978; [PubMed]
- 27.Kurtzke JF. Rating neurologic impairment in multiple sclerosis: an expanded disability status scale (EDSS). Neurology 1983;33:1444-1452 [DOI] [PubMed] [Google Scholar]
- 28.McGowan JC, Schnall MD, Leigh JS. Magnetization transfer imaging with pulsed off-resonance saturation: variation in contrast with saturation duty cycle. JMRI 1994;4:79-82 [DOI] [PubMed] [Google Scholar]
- 29.Udupa JK, Odhner D, Samarasekera S, et al. 3DVIEWNIX: an open, transportable, multidimensional, multimodality, multiparametric imaging software system. SPIE Proc 1994;2164:58-73 [Google Scholar]
- 30.Udupa JK, Samarasekera S. Fuzzy connectedness and object definition: theory, algorithms and applications in imaging segmentation. Graph Models Image Proc 1996;33:480-489 [Google Scholar]
- 31.Udupa JK, Wei L, Samasekera S, Miki Y, van Buchem MA, Grossman RI. Multiple sclerosis lesion quantification using fuzzy connectedness principles. IEEE Trans Med Imaging 1997;16:598-609 [DOI] [PubMed] [Google Scholar]
- 32.Schmidt RE. Demyelinating disease. In: Nelson JS, Parisi JE, Schochet SS, eds. Principles and Practice of Neuropathology. St Louis: Mosby 1993;369-379
- 33.Zimmerman HM, Netskey MG. The pathology of multiple sclerosis. Res Publ Assoc Nerv Ment Dis 1950;28:271-312 [PubMed] [Google Scholar]
- 34.Ge Y, Grossman RI, Udupa JK, et al. Longitudinal quantitative analysis of brain atrophy in relapsing-remitting and secondary-progressive multiple sclerosis. Radiology 2000;214:665-670 [DOI] [PubMed] [Google Scholar]
- 35.Grossman RI, Lenkinski RE, Ramer KN, et al. MR proton spectroscopy in multiple sclerosis. AJNR Am J Neuroradiol 1992;13:1535-1543 [PMC free article] [PubMed] [Google Scholar]
- 36.Matthews PM, Pioro E, Narayanan S, et al. Assessment of lesion pathology in multiple sclerosis using quantitative MRI morphometry and magnetic resonance spectroscopy. Brain 1996;119:715-722 [DOI] [PubMed] [Google Scholar]
- 37.DeStefano N, Matthews P, Antel J, et al. Chemical pathology of acute demyelination lesions and its correlation with disability. Ann Neurol 1995;38:901-909 [DOI] [PubMed] [Google Scholar]
- 38.Arnord DL, Riess GT, Matthews PM, et al. Use of proton magnetic resonance spectroscopy for monitoring disease progression in multiple sclerosis. Ann Neurol 1994;36:76-82 [DOI] [PubMed] [Google Scholar]
- 39.Hiehle JF, Lenkinski RE, Grossman RI, et al. Correlation of spectroscopy and magnetization transfer imaging in the evaluation of demyelinating lesions and normal appearing white matter in multiple sclerosis. Magn Reson Med 1994;32:285-293 [DOI] [PubMed] [Google Scholar]
- 40.Gonen O, Catalaa I, Babb JS, et al. Total brain N-acetylaspartate concentration decline with age in relapsing-remitting multiple sclerosis. Neurology 2000;54:15-19 [DOI] [PubMed] [Google Scholar]
- 41.Losseff NA, Wang L, Lai HM, et al. Progressive cerebral atrophy in multiple sclerosis: a serial MRI study. Brain 1996;199:2009-2019 [DOI] [PubMed] [Google Scholar]
- 42.Mammi S, Filippi M, Martinelli V, et al. Correlation between brain MRI lesion volume and disability in patients with multiple sclerosis. Acta Neurol Scand 1996;94:93-96 [DOI] [PubMed] [Google Scholar]
- 43.Losseff NA, Webb SL, O'Riordan JI, et al. Spinal cord atrophy and disability in multiple sclerosis: a new reproducible and sensitive MRI method with potential to monitor disease progression. Brain 1996;119:701-708 [DOI] [PubMed] [Google Scholar]
- 44.Blinkenberg M, Jensen CV, Holm S, et al. A longitudinal study of cerebral glucose metabolism, MRI, and disability in patients with MS. Neurology 1999;53:149-153 [DOI] [PubMed] [Google Scholar]
- 45.Yamada K, Patel U, Shrier DA, Tanaka H, Chang JK, Numaguchi Y. MR imaging of CNS tractopathy: wallerian and transneuronal degeneration. AJR Am J Roentgenol 1998;171:813-818 [DOI] [PubMed] [Google Scholar]


