Abstract
BACKGROUND AND PURPOSE: The diagnosis of dural sinus thrombosis is often difficult because of its variable and nonspecific clinical presentation and the overlapping signal intensities of thrombosis and venous flow on conventional MR images and MR venograms. We compared 3D contrast-enhanced magnetization-prepared rapid gradient-echo (MP-RAGE) sequences with 2D time-of-flight (TOF) MR venography, digital subtraction angiography (DSA), and conventional spin-echo (SE) MR imaging for the assessment of normal and abnormal dural sinuses.
METHODS: In a phantom study, a plastic tube with pulsating flow was used to simulate the intracranial dural sinus. With 3D MP-RAGE, a variety of flow velocities, contrast material concentrations, and angulations between the phantom flow tube and the plane of acquisition were tested to measure their relationship to signal-to-noise ratio (SNR). In a clinical study, 35 patients, including 18 with suspected dural sinus thrombosis, were studied with both MR imaging and DSA. Receiver operating characteristic (ROC) analysis was performed in a blinded fashion using DSA as the reference standard.
RESULTS: With the phantom, the SNR of flow increased with increasing contrast concentration, but was not affected by the angle between the tube and scan slab. There was no relationship between SNR and velocity when the contrast concentration was 1.0 mmol/L or greater. In the clinical study, dural sinus thrombosis as well as the normal anatomy of the dural sinuses were seen better with 3D contrast-enhanced MP-RAGE than with 2D-TOF MR venography. Three-dimensional contrast-enhanced MP-RAGE showed the highest diagnostic confidence on ROC curves in the diagnosis of thrombosis.
CONCLUSION: Three-dimensional contrast-enhanced MP-RAGE is superior to 2D-TOF MR venography and conventional SE MR imaging in the depiction of normal venous structures and the diagnosis of dural sinus thrombosis, and is a potential alternative to DSA.
Clinical and radiologic diagnosis of dural sinus thrombosis is sometimes difficult because of its variable, nonspecific presentation. The improved detection of dural sinus thrombosis afforded by high-resolution CT and MR imaging has shown that the prevalence of sinus thrombosis is much higher than previously thought. Delayed diagnosis of sinus thrombosis may cause high rates of morbidity and mortality, whereas proper and prompt treatment, including recently advanced catheterization techniques, can improve the prognosis dramatically (1–4).
On conventional MR images, the dilated collaterals of the cortical and medullary veins and venous infarction are easily visualized, but they usually do not appear at the initial stage of dural sinus thrombosis. The diagnosis of sinus thrombosis is not always straightforward, because the thrombus and flow can produce overlapping signal intensities (4). Two-dimensional time-of-flight (2D-TOF) MR venography, contrast-enhanced CT projection venography, and digital subtraction angiography (DSA) are common techniques in the diagnosis of dural sinus thrombosis. However, with 2D-TOF MR venography, one may not be able to distinguish a hypoplastic or atretic sinus from thrombosis (5). Another pitfall of 2D-TOF MR venography is signal loss of vessels, in which the direction of blood flow is within the imaging plane. This so-called saturation may resemble thrombotic occlusion(5–7). High-resolution CT has been reported to be comparable or superior to MR venography (2D-TOF or phase-contrast); however, it requires complex postprocessing work, including the proper choice of threshold levels, the use of iodinated contrast material, and exposure to X-rays. Moreover, it is limited by the poor delineation of skull base structures (7, 8). At present, despite its invasiveness, DSA is considered the standard of reference in the diagnosis of thrombosis and patency of the dural sinuses. Therefore, a less invasive, more effective, and more accurate diagnostic technique is required for the early diagnosis of dural sinus thrombosis.
Recently, a relatively new sequence, magnetization-prepared rapid gradient-echo (MP-RAGE), has been shown to provide excellent delineation of venous structures and good contrast and resolution between the sinuses and an adjacent lesion (9). The purpose of this study was to assess prospectively the accuracy of 3D contrast-enhanced MP-RAGE in the evaluation of the normal and abnormal dural sinuses as compared with 2D-TOF MR venography, conventional spin-echo (SE) MR imaging, and DSA.
Methods
Phantom Study
Phantom Models and Scanning Parameters
In the first part of this investigation, a phantom study was performed to evaluate the relationships between signal-to-noise ratios (SNRs) and concentrations of gadopentetate dimeglumine, flow velocities, and angles between the tube and scan slab with 3D MP-RAGE. We used a pulsating flow generation pump (Model 405; Harvard Apparatus, Natick, MA) to provide pulsating circulation resembling in vivo vascular blood flow. To simulate the intracranial dural sinuses, a 300-mm-long plastic tube with an internal diameter of 5 mm was used, and measurements were obtained 1.5 m from the pump.
In a closed circuit, flow was delivered to the flow phantom at a pulse rate of 25, 50, 75, and 100 beats per minute, and the corresponding mean velocities were 3.4, 6.8, 10.2, and13.6 cm/s, respectively. The mean velocity was defined as the flow volume divided by the cross-sectional area of the plastic tube. These velocities corresponded to the reported flow velocity of the cortical veins and sinuses (6–15 cm/s) (10, 11).
MR phantom studies were performed on a 1.5-T system with the use of a head coil. The MP-RAGE sequence was applied using the following parameters: 13.5/7 (TR/TE); acquisition time, 2 minutes 7 seconds; matrix, 128 × 256; field of view (FOV), 10 × 20 cm; section thickness, 1.5 mm; flip angle, 15°; inversion time (TI), 300 milliseconds; delay time (TD), meaning the time interval between the last rapid gradient echo and the subsequent 180° inversion recovery magnetization-preparation pulse, 300 milliseconds; bandwidth, 130 Hz per pixel; and slab thickness, 4.2 cm. The contrast agent was kept flowing at a steady concentration throughout the acquisition time.
The T1 value of 0.1 mmol/L of contrast material is similar to that of blood (1200 ms) at 1.5 T, and the maximum signal intensity in the aorta after a bolus injection of 0.1 mmol/kg of contrast agent in the human body is nearly equal to the signal intensity at 2.0 mmol/L (12, 13). Therefore, the concentrations of contrast medium used were 0.1, 0.2, 0.5, 1.0, and 2.0 mmol/L. The angles between the plastic tube and imaging slab were 0°, 30°, 45°, 60°, and 90°.
Image Analysis
Standard electronic measurements of signal intensity in each region of interest (ROI) were made by one of the researchers. Three ROIs were selected from the center slices of the MP-RAGE volume with the same measurement area. When the concentration of contrast agent and velocity was very low (such as 0.1 mmol/L, 3.4 cm/s), the signal intensity of the phantom could not be distinguished from that of surrounding noise. In these instances, the ROI was placed at the corresponding phantom position that could be recognized in other conditions. SNR was calculated for each scan using the following formula: SNR = SI/N, where SI is the mean signal intensity of the three ROIs on each scan and N is the standard deviation of the background along the phase-encoding direction. The relationships between SNR and scan angles, concentrations of contrast material, and flow velocities were calculated and displayed on graphs.
Clinical Study
Patients
From June 1997 to December 1999, 35 consecutive patients (19 women and 16 men, ages 19 to 76 years; mean age, 49 years) were examined prospectively with both 2D-TOF MR venography and 3D contrast-enhanced MP-RAGE during the same scan session. All patients also underwent DSA within 1 week. Eighteen patients were examined for suspected dural sinus thrombosis. Six had proved arteriovenous fistula (AVF). Three patients (one with a posterior fossa meningioma, one with a parasagittal meningioma, and one with a mastoid abscess) were examined to assess the relationship between the lesions and dural sinuses, as well as the involvement of the sinuses. One patient was imaged for an arteriovenous malformation (AVM) close to the dural sinuses, one patient for a high-riding jugular bulb that mimicked a lesion in the jugular foramen, and one patient with neurofibromatosis (type 1) and pineal tumor. The remaining 11 patients had intraaxial tumors that were located far from the dural sinuses and they served as the control group. Follow-up examinations were performed in three patients who had acute dural sinus thrombosis.
MR Protocols and Image Display
The same MR unit as used in the phantom study was used in all 35 patients. T1-weighted SE sequences (600–700/14–24/1) and T2-weighted fast-SE sequences (3700/96/1; echo train length, 7) were obtained with a slice thickness of 5 mm, an intersection gap of 1 mm, a 220-mm FOV, and a matrix of 256 × 224. Two-dimensional TOF MR venography was performed after completion of the T1- and T2-weighted sequences. Parameters used for 2D-TOF MR venography were 25/9/1, a flip angle of 30°, a 2.0-mm slice thickness, a 256 × 192 matrix, a 20-cm FOV; 60 to 64 slices, and an acquisition time of 5 minutes 32 seconds. After 2D-TOF MR venography, intravenous contrast material (0.1 mmol/kg) was administered manually at a rate of 1 to 2 mL/s, then T1-weighted SE and MP-RAGE sequences were obtained. The order of these two sequences was alternated from patient to patient. The parameters for the T1-weighted SE sequence were the same as described above. The 3D contrast-enhanced MP-RAGE sequence was applied with the following parameters: 13.5/7, a TI/TD of 300/300 milliseconds, a flip angle of 15°, an acquisition time of 6 minutes 43 seconds to 7 minutes 43 seconds, a matrix of 192 × 256, an FOV of 20 cm, a section thickness of 1.25 to 1.5 mm, a bandwidth of 130 Hz per pixel, and a slab thickness of 13.5 cm. All sequences were oriented in the axial plane. In addition, 2D-TOF MR venography was obtained in the sagittal plane in one patient and in the coronal plane alone in two patients. In one patient, the sagittal plane instead of the axial plane was imaged with a 3D contrast-enhanced MP-RAGE sequence.
Source images of the 2D-TOF MR venographic sequences and the 3D contrast-enhanced MP-RAGE sequences, and contiguous multiplanar reformation (MPR) images were evaluated. The maximum intensity projection (MIP) algorithm was used to produce venograms for both the 2D-TOF MR venographic sequences and the 3D contrast-enhanced MP-RAGE sequences. A selective MIP view in the sagittal plane, multiple oblique MIPs rotated about the superoinferior axis in 15° increments, and multiple MIPs rotated about the anteroposterior axis in 15° increments for the entire venous circulation were also provided simultaneously for blinded interpretations. All image processing was performed with the same method by the same radiologist.
DSA Technique
DSA was performed by means of femoral artery catheterization in all 35 patients. Anteroposterior and lateral venographic phases from the selective carotid injections were supplied. The presence or absence of dural sinus thrombosis was determined on the basis of DSA findings by the consensus of two experienced neuroradiologists who did not participate in the interpretation of the blinded MR study.
Receiver Operating Characteristic (ROC) Analysis
ROC curves were obtained to assess the ability to diagnose sinus thrombosis. The results of the DSA findings were considered to be the standard of reference. The other two experienced observers, who were blinded to the details of the clinical histories and DSA findings but familiar with the normal findings of sinuses on T1-weighted images, T2-weighted images, contrast-enhanced T1-weighted images, 2D-TOF MR venograms, and 3D contrast-enhanced MP-RAGE images, independently classified the eight sinuses (one superior sagittal sinus, one straight sinus, two transverse sinuses, two sigmoid sinuses, and two jugular bulbs) of all 35 patients into five categories according to the presence or absence of dural sinus thrombosis: 1 = definitely or almost definitely absent, 2 = probably absent, 3 = uncertain, 4 = probably present, 5 = definitely or almost definitely present.
T1-weighted images, T2-weighted images, contrast-enhanced T1-weighted images, 2D-TOF MR venograms, and 3D contrast-enhanced MP-RAGE images were compared for the detection of dural thrombosis by means of ROC curves (14) as determined from the confidence scores of each observer's readings from the five sets of images. Data from the two observers were not pooled; hence, five ROC curves were calculated for each observer. To minimize a possible learning effect by the observers, the order in which the images were reviewed varied from one reading to the next. In interpreting the 2D-TOF MR venograms and 3D contrast-enhanced MP-RAGE sequences, the source images, contiguous MPR images, and MIP images were all included. Diagnosis of dural sinus thrombosis on 2D-TOF MR venograms was based on lack of flow signal in a sinus. The possibility of an aplastic or hypoplastic sinus was excluded by combined reading of the source images with the MIP images.
For each sequence evaluated, a binomial ROC curve was fitted to each observer's confidence rating data by maximum likelihood estimation. The diagnostic accuracy of each imaging technique was determined by calculating the area (Az) under each reader-specific binomial ROC curve when it was plotted in the previously designated square. Differences between ROC curves of individual readers were tested for significance using the CORROC algorithm (for statistical comparison of ROC curves estimated from correlated data sets). Differences between the sequences in terms of the mean areas (Az) under the ROC curves were analyzed statistically using Student's two-tailed t test for paired data.
To determine interobserver variability in assessing the qualitative analysis and lesion detection with each imaging sequence, κ statistics were used to measure the degree of agreement between observers as to the presence (definitely present, probably present) or absence (definitely absent, probably absent, or undetermined) of lesions. κ values greater than 0 were considered to indicate positive correlation. Values up to 0.4 were considered to indicate positive but poor correlation; values of 0.41 to 0.75, good correlation; and values greater than 0.75, excellent correlation.
Sensitivity, Specificity, Positive Predictive Value (PPV), and Negative Predictive Value (NPV)
The number of lesions correctly located as probably present (a score of 4) or definitely present (a score of 5) by each reviewer was regarded as the number of correctly diagnosed lesions. Average sensitivity, specificity, PPV, and NPV for the two observers for each sequence were obtained for all 35 patients.
Retrospective Qualitative Study
Among the 20 patients without thrombosis or brain mass lesions adjacent to the dural sinuses, normal anatomic structures, including several deep veins and dural sinuses, were identified and counted. MR images of the patients with dural sinus thrombosis (n = 12) and lesions adjacent to dural sinuses (n = 3) were reviewed retrospectively. The 2D-TOF MR venograms, 3D contrast-enhanced MP-RAGE images, and DSA images were interpreted together with knowledge of the patient's history, then scored with regard to the conspicuity, size, and extension of the thrombosis. If there was no thrombosis, the images were scored on the basis of the relationship between the sinus and lesions and the accuracy of sinus patency. The scoring was done by the same two observers, who rated the images consensually on a four-point scale, with 1 = poor, 2 = fair, 3 = good, and 4 = excellent. Differences were examined by means of Fisher's analysis of variance(ANOVA) and paired t test. A difference was considered significant at a P value of less than .05.
Results
Phantom Study
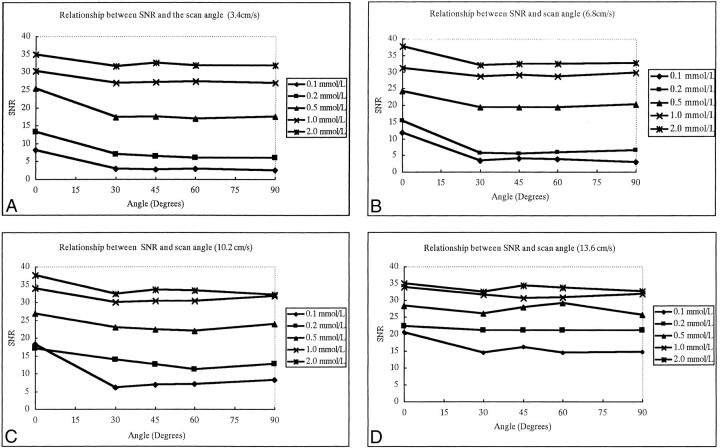
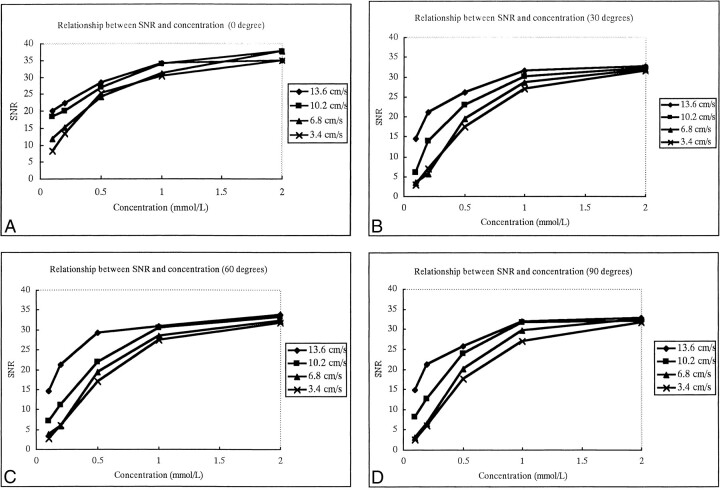
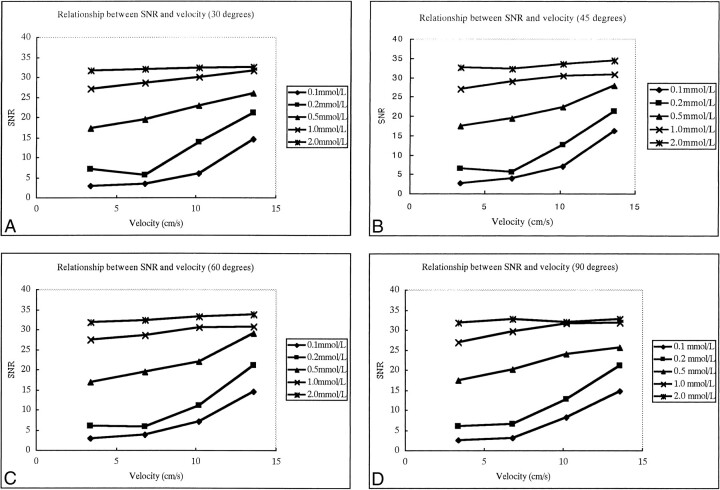
The SNRs of flow were not affected by the angle between the vessel and the scan slab on contrast-enhanced MP-RAGE images (Fig 1); however, they were closely associated with the concentration of contrast material (Fig 2). The SNRs increased as the contrast concentration increased for all angles between the vessel and the slab (Fig 2). The SNRs showed little change with increases in velocity when the concentration of contrast material was 1.0 mmol/L or greater; however, SNRs did increase with increases in velocity when the concentration was 0.5 mmol/L or less (Fig 3).
fig 1.
A–D, The relationship between SNR of flow and the angle between the plastic tube phantom and scan slab plane using four different flow velocities: 3.4 cm/s (A), 6.8 cm/s (B), 10.2 cm/s (C), and 13.6 cm/s (D). The five curves within one graph represent five different concentrations of contrast flow. SNRs are not greatly affected by scan angle
fig 2.
A–D, The relationship between SNR of flow and concentration of contrast material using four different scan angles between the plastic tube and the slab: 0° (A), 30° (B), 60° (C), and 90° (D). The four curves within one graph represent four different flow velocities. SNR increases as the contrast material concentration increases, but less dramatically after 1 mmol/L concentration
fig 3.
A–D, The relationship between SNR and flow velocity for four different angles: 30° (A), 45° (B), 60° (C), and 90° (D). The five curves within one graph represent five different concentrations of flow of contrast material. SNRs are not greatly affected by fluid velocity if the concentration of flow is greater than 1.0 mmol/L, but SNR does increase significantly with the increase of velocity when flow concentration is low (≤ 0.5 mmol/L)
Clinical Study
Dural sinus thrombosis was diagnosed at 26 sinus sites in 12 patients by intraarterial DSA. Locations of thrombosis were as follows: superior sagittal sinus (n = 7), straight sinus (n = 3), left transverse sinus (n = 7), right transverse sinus (n = 2), left sigmoid sinus (n = 3), right sigmoid sinus (n = 2), left jugular bulb (n = 1), and right jugular bulb (n = 1).
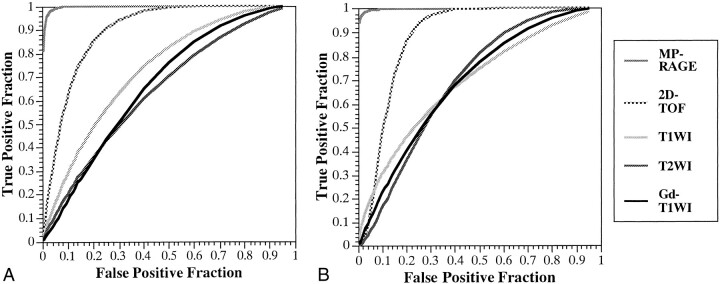
ROC Analysis and κ Value
The ROC curves for the two observers are shown in Figure 4. The calculated areas under the ROC curves and the mean area by the two observers with each sequence for the 26 thromboses are shown in Table 1. Both observers achieved statistically significant superior performance with the 3D contrast-enhanced MP-RAGE technique over that achieved with the other four sequences. The 2D-TOF MR venographic sequence also yielded significantly better performance than did the T1-weighted, T2-weighted, and contrast-enhanced T1-weighted sequences, with no significant difference among the latter three.
fig 4.
A and B, ROC curves for the two observers (A and B, respectively) when attempting to detect sinus thrombosis on images obtained with 3D contrast-enhanced MR-RAGE (MP-RAGE: 13.5/7/1, TI = 300, flip angle = 15°), 2D-TOF MR venography (2D-TOF: 25/9/1, flip angle = 30°), T1-weighted imaging (T1WI: 600–700/14–24/1), T2-weighted imaging (T2WI: 3700/96/1), and contrast-enhanced T1-weighted imaging (Gd-T1WI: 600–700/14–24/1). The 3D contrast-enhanced MP-RAGE sequence yielded statistically better detection of sinus thrombosis by both observers as compared with 2D-TOF MR imaging (P < .01), T1-weighted imaging, T2-weighted imaging, and contrast-enhanced T1-weighted imaging (P < .01)
TABLE 1:
Individual and mean area under the ROC curve (Az) for 3D contrast-enhanced MP-RAGE, 2D-TOF, T1-weighted, T2-weighted, and contrast-enhanced T1-weighted imaging for all sinuses

In κ analysis, agreement was regarded as excellent with the contrast-enhanced MP-RAGE sequences, as good with the 2D-TOF sequences, and as positive but poor with the T1-weighted, T2-weighted, and contrast-enhanced T1-weighted sequences. κ values were 0.76, 0.41, 0.02, 0.14, and 0.01 (corresponding P values were .0, .0, .43, .01, and .99) for 3D contrast-enhanced MP-RAGE sequences, 2D-TOF MR venograms, T1-weighted images, T2-weighted images, and contrast-enhanced T1-weighted images, respectively.
Since κ values showed positive correlation between two observers for all sequences, the average sensitivity, specificity, PPV, and NPV for the two observers for each sequence were calculated for the 35 patients (Table 2). The 3D contrast-enhanced MP-RAGE images yielded the highest sensitivity, specificity, PPV, and NPV, followed by the 2D-TOF MR venograms. Sensitivity and PPV for the 2D-TOF MR venograms, T1-weighted, T2-weighted, and contrast-enhanced T1-weighted images were much lower than for the 3D contrast-enhanced MP-RAGE sequences.
TABLE 2:
Average sensitivity, specificity, PPV, and NPV for two observers for 26 sites of thrombosis in 35 patients

Normal Anatomic Structures
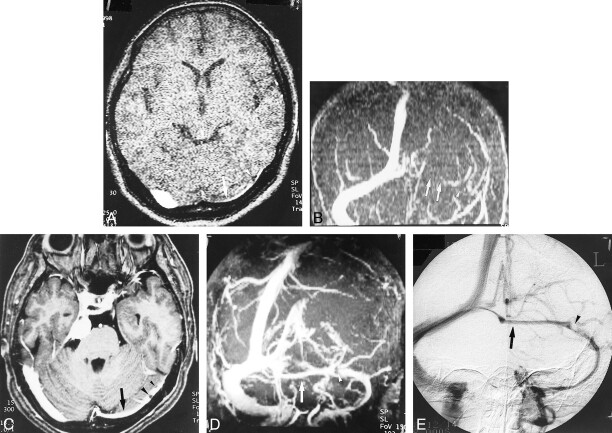
The normal dural sinuses and cerebral veins identified on 2D-TOF MR venograms and 3D contrast-enhanced MP-RAGE images in 20 patients are summarized in Table 3. Patients with abnormalities of the dural sinuses were excluded (n = 15). The 3D contrast-enhanced MP-RAGE images were equivalent to DSA images and much better than 2D-TOF MR venograms in delineating normal structures (Fig 5). The 3D contrast-enhanced MP-RAGE sequences also depicted the normal internal structures within sinuses, such as fibrous septa and pacchionian granulations (Figs 5 and 6), with as much clarity as seen on the DSA images, and indeed the contrast between the sinus itself and these fine structures was better on 3D contrast-enhanced MP-RAGE images than on the DSA images.
TABLE 2:
TABLE 3. Identification of normal dural sinuses and cerebral veins with 3D contrast-enhanced MP-RAGE, 2D-TOF MR venography, and DSA in 20 patients

fig 5.
A–E, Hypoplastic left transverse sinus (arrows) in a patient with a posterior fossa meningioma. Although it is difficult to distinguish hypoplasia from occlusion or thrombosis on the source and MIP images (A and B) of 2D-TOF MR venography (25/9/1, flip angle = 30°), the hypoplastic sinus is clearly depicted on the source and MIP images (C and D) of 3D contrast-enhanced MP-RAGE (13.5/7/1, TI = 300, flip angle = 15°), which are nearly identical to the DSA venogram (E). The pacchionian granulations (arrowheads) are also well delineated on 3D contrast-enhanced MP-RAGE images
Retrospective Qualitative Study
Twenty-six dural sinus thromboses were evaluated for conspicuity, size, and extension of thrombosis; and four dural sinuses compressed by adjacent lesions were evaluated for the relationship between the sinuses and lesions as well as for sinus patency. Visualization scores for 3D contrast-enhanced MP-RAGE, 2D-TOF MR venography, and DSA were 3.61, 1.91, and 2.78, respectively. By ANOVA, significant differences were obtained between 3D contrast-enhanced MP-RAGE and DSA (P = .004), between 3D contrast-enhanced MP-RAGE and 2D-TOF MR venography (P < .001), and between DSA and 2D-TOF MR venography (P = .002). By paired t test, significant differences also existed between 3D contrast-enhanced MP-RAGE and DSA (P = .009), between 3D contrast-enhanced MP-RAGE and 2D-TOF MR venography (P < .001), and between DSA and 2D-TOF MR venography(P = .004).
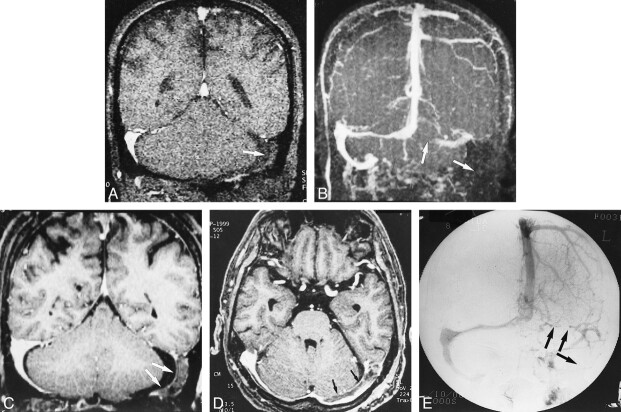
Twenty thromboses in nine patients (three of which occurred within 1 week after craniotomy) were examined within 3 to 15 days of onset of symptoms. With the 3D contrast-enhanced MP-RAGE sequence, 15 of 20 acute thromboses were hypointense (Figs 7, 8C) and five ranged from hypointense to intermediately intense (Figs 8D and 9). All thromboses had excellent contrast relative to the enhanced sinuses. In one patient treated by catheter thrombolysis, source images of 3D contrast-enhanced MP-RAGE showed the partially dissolved, irregular residual thromboses very clearly (Fig 9).
fig 7.
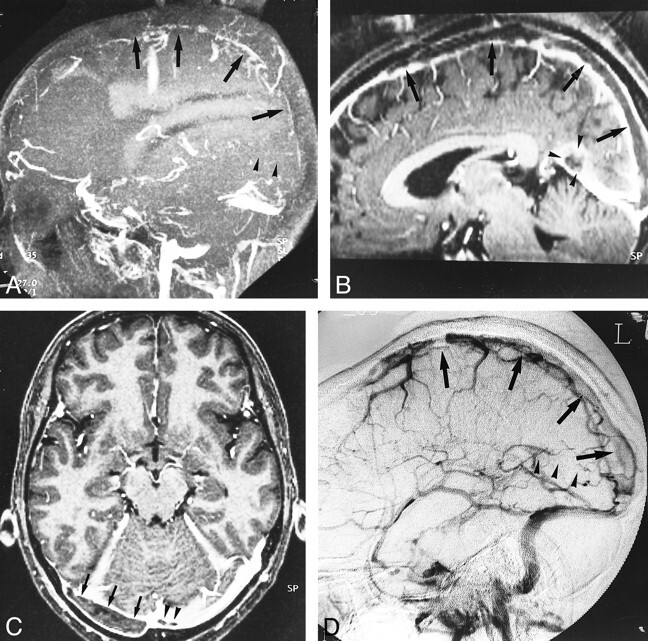
A–D, Diffuse sinus thrombosis (arrows, arrowheads) in a 37-year-old woman with a history of abruption of placenta and diabetes insipidus. The diagnosis of thrombosis may be possible from the sagittal MIP image of 2D-TOF MR venography (25/9/1, flip angle = 30°) (A) and by the indirect finding of lack of visualization of the affected sinuses. With 3D contrast-enhanced MP-RAGE (13.5/7/1, TI = 300, flip angle = 15°), however, the reconstructed sagittal and source axial images (B and C) show the extent and size of the low signal thrombosis (arrows) as well as the patency of the affected sinuses, which is confirmed on DSA image (D)
fig 8.
A–E, Postoperative sinus thrombosis (arrows) in a 62-year-old man. The coronal source and MIP images of 2D-TOF MR venography (25/9/1, flip angle = 30°) (A and B) show no flow signals in the left transverse and sigmoid sinuses, which may be difficult to differentiate from hypoplasia of the sinuses (see fig 5). The reconstructed coronal and source axial images (C and D) from a 3D contrast-enhanced MP-RAGE sequence (13.5/7/1, TI = 300, flip angle = 15°) clearly show the thrombosis in the left transverse and sigmoid sinuses, which is confirmed on the DSA image (E)
fig 9.
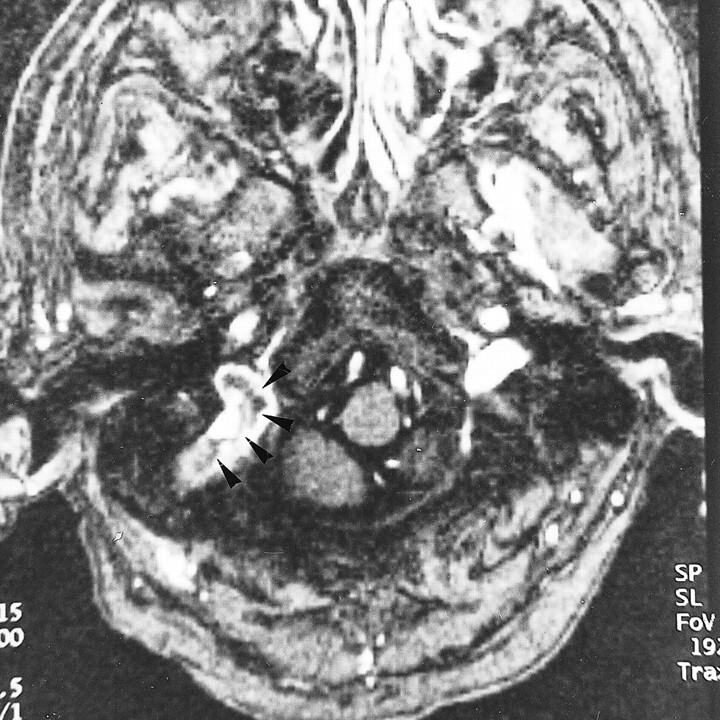
Residual thrombosis after thrombolysis in a 65-year-old woman. Axial source image of 3D contrast-enhanced MP-RAGE sequence (13.5/7/1, TI = 300, flip angle = 15°) shows the partially dissolved, irregular residual thrombosis within the jugular bulb (arrowheads). Abnormalities in the jugular bulb are sometimes missed with 2D-TOF MR venography because of its inconsistent depiction of thrombosis and limited coverage
In three patients, six sinuses contained chronic, organized thromboses that occupied the entire affected sinuses, depicted as hyperintense or with mixed hyperintense signal and minimal contrast between organized thrombosis and the remaining sinuses. Two of them were associated with dural AVFs.
Only two patients had parenchymal abnormalities, both hemorrhagic venous infarctions in the left parietal lobes, associated with sinus thrombosis. The dilated veins associated with the AVF/AVM and the hemorrhagic venous infarctions were clearly shown on 3D contrast-enhanced MP-RAGE images, but not on the 2D-TOF MR venograms.
In two patients with meningioma, both the 3D contrast-enhanced MP-RAGE images and the 2D-TOF MR venograms showed occlusion or stenosis of the affected sinus, which was confirmed by DSA. In one patient with epidural abscess caused by right mastoiditis, the flow signal was absent on 2D-TOF MR venograms, suggesting occlusion or thrombosis in the involved sinus, whereas both DSA and 3D contrast-enhanced MP-RAGE images proved the narrowed right transverse and sigmoid sinuses were not occluded. One giant dilatation of the confluence of sinuses (torcular Herophili) and one high jugular bulb were also depicted better on 3D contrast-enhanced MP-RAGE and DSA images than on 2D-TOF MR venograms.
Discussion
Three-dimensional MP-RAGE is a small-flip-angle, gradient-recalled-echo sequence with a 3D Fourier transform acquisition technique that has been implemented with a 180° inversion recovery preparation pulse. This sequence results in heavily T1-weighted contrast, a relatively high SNR, postprocessing capabilities, thin contiguous images, rapid acquisition time, and the presence of flow-related enhancement (15–19). The 3D contrast-enhanced MP-RAGE sequence not only relies on TOF effects to depict flow but also on the T1-reducing effect of gadolinium (9). Our phantom study suggested that when the blood concentration of contrast medium reached a certain level (about 1.0 mmol/L), the signal intensity was no longer dependent on the flow rate. In addition, flow signal on 3D contrast-enhanced MP-RAGE images was not affected by the angle between the vessels and the scan slab plane. The hypointense to intermediately intense thrombosis was depicted clearly because of excellent contrast among the thrombosis, the intensely enhanced sinus, and the adjacent brain parenchyma.
With 2D-TOF MR venography, however, sinus thrombosis was suspected indirectly by the absence of normal flow in a sinus, since the thrombosis was usually isointense with the brain parenchyma. It was very difficult to distinguish the hypoplastic sinus from thrombosis with 2D-TOF MR venography alone. Hypoplastic or aplastic transverse sinus is a common variation, and 15% to 30% of the patients in our study had unilateral hypoplasia or aplasia of the transverse sinus. Therefore, the absence of signal within a sinus, most commonly the left transverse sinus, may not always indicate thrombosis. The signal loss due to in-plane blood flow, which may simulate a thrombotic occlusion, is another limitation of 2D-TOF MR venography (5–7, 20).
The intracranial dural sinuses and veins may pose some challenge to single-plane 2D-TOF MR venography owing to the different directions of flowing veins. Attention must be given to the proper technique, including the proper selection of saturation pulses at the base of the brain, otherwise saturation of cerebral veins or dural sinuses that are flowing in different directions may occur. Furthermore, the use of an inferior presaturation pulse with 2D-TOF MR venography may result in signal loss of the sinuses in patients with dural AVF, presumably because the blood within the sinus may become saturated as a result of arteriovenous shunt through the fistula (21), assuming saturated blood from the arterial side enters the vein. The anterior part of the cephalad-flowing superior sagittal sinus may also experience the signal loss if saturation pulses are placed adjacent to each slice (2).
It is sometimes difficult to make a diagnosis of thrombosis in the sigmoid sinus and jugular bulb with DSA, conventional MR imaging, or 2D-TOF MR venography, although such a diagnosis is important, especially in otologic disease (22). Complicated flow signal and artifacts induced by vessel pulsation on SE images often prevent clear visualization of the sigmoid sinus and jugular bulb. The reduced vascular dephasing, decreased susceptibility artifacts, and suppression of fat signal on the 3D contrast-enhanced MP-RAGE sequence contribute to its better delineation of the sigmoid sinus and jugular bulb (18). In addition, 3D contrast-enhanced MP-RAGE provides a 13.5-cm-thick slab that covers the brain from sagittal sinus to jugular bulb, while 2D-TOF MR venography is limited, on our unit, to 12.5-cm coverage cephalocaudally, which may not include the superior sagittal sinus and jugular bulb simultaneously. In this study, two thromboses in the jugular bulb and one thrombosis in the sigmoid sinus were depicted only on 3D contrast-enhanced MP-RAGE images (Fig 9).
Volume data sets of 3D contrast-enhanced MP-RAGE sequences enable sagittal and coronal reformations, which we found useful for better visualization of the superior sagittal, straight, and sigmoid sinuses. Another advantage of 3D contrast-enhanced MP-RAGE over 2D-TOF MR venography and DSA is its ability to simultaneously depict the sinus, brain parenchyma, and lesions, such as tumor or abscess. In patients with AVMs or dural AVFs, the relationship among the feeding and draining vessels, involved sinus with thickened dura, and corresponding parenchymal changes could be seen simultaneously on the 3D contrast-enhanced MP-RAGE images (16–18). The demonstration of small vessels on 3D contrast-enhanced MP-RAGE sequences also contributes to the diagnosis of AVM or dural AVF. By combining these advantages, 3D contrast-enhanced MP-RAGE offered much higher detectability of diseases of the large deep veins and dural sinuses than any of the other techniques. Although we used DSA as the reference standard in this study, the visualization scores for DSA for the extent and conspicuity of thrombosis were significantly lower than those for 3D contrast-enhanced MP-RAGE owing to its lower contrast between filling defects and contrast agent in the sinus. Residual or partly resolved thrombus after treatment was also seen better on 3D contrast-enhanced MP-RAGE images, whereas only sinus patency could be judged on 2D-TOF MR venograms or DSA images.
Although 3D contrast-enhanced MP-RAGE uses principles similar to those of contrast CT venography (8), the lack of ionizing radiation and iodinated contrast material are advantages of MR imaging over CT venography. CT is also limited in its ability to depict thromboses of the sigmoid sinus and jugular bulb (22). Postprocessing with CT techniques is time-consuming, because it requires subtraction to eliminate the surrounding calvaria and subcutaneous tissue (7). We believe that 3D contrast-enhanced MP-RAGE is much more suitable than CT venography for screening and follow-up examinations.
T1-weighted, T2-weighted, and contrast-enhanced T1-weighted SE images showed lower rates of detection of sinus thrombosis. The signal intensity of thrombosis as well as of normal sinus was variable on these sequences, owing to the different breakdown stages of thrombosis, variable velocity of blood in normal sinuses, flow-related enhancement, and dephasing effects (2, 4). We found many overlaps of signal intensity between the normal sinus and sinus thrombosis. Contrast-enhanced T1-weighted images were less useful than other conventional MR images, because these artifacts were accentuated after administration of contrast material. The presaturation pulse used in contrast-enhanced T1-weighted imaging could not eliminate the flow artifacts.
The SNR of the vein and dural sinus on 3D contrast-enhanced MP-RAGE images proved to be closely associated with the concentration of contrast medium in the phantom study. High concentration of contrast material led to high SNR. Therefore, data acquisition during optimal contrast concentration could improve depiction of the venous and dural sinus system and the detection of dural sinus thrombosis. Although not included in this study, we found that 1.5 times the routine dose of contrast material (0.15 mmol/kg) and a long-lasting injection (3 minutes, at a rate of 5 mL/min, from the beginning of the scan) resulted in better depiction of the venous/sinus system than did routine single doses.
Comparatively longer scan time (6 to 7 minutes) and the need for contrast medium may be shortcomings of 3D contrast-enhanced MP-RAGE sequences. There are also several pitfalls that occur with this technique in the diagnosis of sinus thrombosis. First, structures within the dural sinus, such as intrasinus fibrotic bands or septa and pacchionian granulation, may be misdiagnosed as thrombosis (Figs 5 and 6). The fibrotic bands or septa are usually linear structures with intermediate intensity. Pacchionian granulations show high intensity on T2-weighted images and low intensity on T1-weighted images (23). Second, because chronic thrombosis may enhance on 3D contrast-enhanced MP-RAGE images as a result of vascularization or organization (24), it may be difficult to differentiate chronic thrombosis from recanalization of the thrombosis. All six chronic thromboses in our group enhanced homogeneously or somewhat heterogeneously. Four of them were difficult to distinguish from normal enhancement of sinuses and were misdiagnosed, whereas two received a score of 4 (probably present) on the ROC analysis because of their irregular margins. DSA or 2D-TOF MR venography may be superior to 3D contrast-enhanced MP-RAGE for diagnosing the patency of the sinuses in such circumstances. Interestingly, the thrombosis in one patient still showed low intensity on 3D contrast-enhanced MP-RAGE images 2 years after the initial onset. At present, the time required for thrombosis to become organized and therefore to enhance on MR images is controversial.
Conclusion
Three-dimensional contrast-enhanced MP-RAGE is better than 2D-TOF MR venography and conventional SE imaging in the depiction of normal venous anatomy and cerebral venous disease, since it is not affected by the angle between vessel and scan slab or flow velocity. Higher blood concentration of contrast medium will contribute to better SNR. Direct visualization of dural sinus thrombosis makes it possible to diagnose the disease at an early stage with great confidence. Simultaneous demonstration of dilated collateral veins and complications of dural thrombosis helps predict prognosis. Because of its comparable, even superior, detectability relative to DSA, 3D contrast-enhanced MP-RAGE can be used as an effective, noninvasive technique for the diagnosis and short-term follow-up of patients with sinus thrombosis. Three-dimensional contrast-enhanced MP-RAGE may not be suitable in patients with organized and therefore vascularized chronic sinus thrombosis, because the enhanced thrombosis decreases the contrast with the normal sinus. DSA and 2D-TOF MR venography may be a more appropriate choice than 3D contrast-enhanced MP-RAGE in such circumstances.
fig 6.
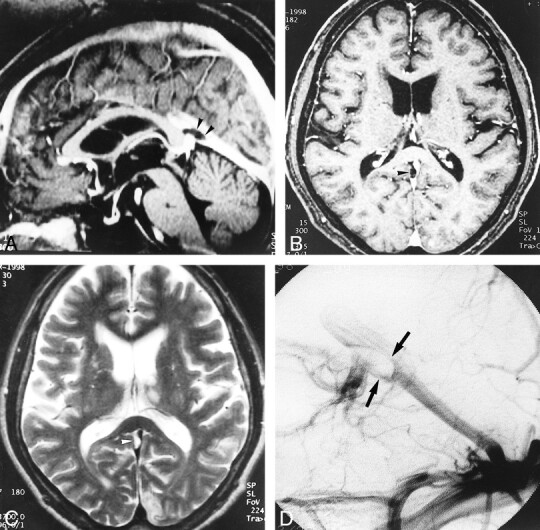
A–D, Large pacchionian granulation at the top of the straight sinus (arrowheads). Pacchionian granulation is hypointense on reconstructed sagittal and source axial images (A and B) of 3D contrast-enhanced MP-RAGE (13.5/7/1, TI = 300, flip angle = 15°) and hyperintense on T2-weighted image (C) (3700/96/1). DSA image (D) shows filling defect in corresponding region (and could be misdiagnosed as a sinus thrombus)
Footnotes
Address reprint requests to Luxia Liang, MD.
References
- 1.Kim SY, Suh JH. Direct endovascular thrombolytic therapy for dural sinus thrombosis: infusion of alteplase. AJNR Am J Neuroradiol 1997;18:639-645 [PMC free article] [PubMed] [Google Scholar]
- 2.Provenzale JM, Joseph GJ, Barboriak DP. Dural sinus thrombosis: findings on CT and MR imaging and diagnostic pitfalls. AJR Am J Roentgenol 1998;170:777-783 [DOI] [PubMed] [Google Scholar]
- 3.Tsai FY, Wang AM, Matovich VB, et al. MR staging of acute dural sinus thrombosis: correlation with venous pressure measurements and implications for treatment and prognosis. AJNR Am J Neuroradiol 1995;16:1021-1029 [PMC free article] [PubMed] [Google Scholar]
- 4.Zimmerman RD, Ernst RJ. Neuroimaging of cerebral venous thrombosis. Neuroimaging Clin North Am 1992;2:463-485 [Google Scholar]
- 5.Ayanzen RH, Bird CR, Keller PJ, McCully FJ, Theobald MR, Heiserman JE. Cerebral MR venography: normal anatomy and potential diagnostic pitfalls. AJNR Am J Neuroradiol 2000;21:74-78 [PMC free article] [PubMed] [Google Scholar]
- 6.Vogl TJ, Bergman C, Villringer A, Einhaup K, Lissner J, Felix R. Dural sinus thrombosis: value of venous MR angiography for diagnosis and follow-up. AJR Am J Roentgenol 1994;162:1191-1198 [DOI] [PubMed] [Google Scholar]
- 7.Ozsvath RR, Casey SO, Lustrin ES, Alberico RA, Hassankhani A, Patel M. Cerebral venography: comparison of CT and MR projection venography. AJR Am J Roentgenol 1997;169:1699-1707 [DOI] [PubMed] [Google Scholar]
- 8.Casey SO, Alberico RA, Patel M, et al. Cerebral CT venography. Radiology 1996;198:163-170 [DOI] [PubMed] [Google Scholar]
- 9.Stevenson J, Knopp EA, Litt AW. MP-RAGE subtraction venography: a new technique. J Magn Reson Imaging 1995;5:239-241 [DOI] [PubMed] [Google Scholar]
- 10.Lafitte F, Boukobza M, Guichard JP, et al. MRI and MRA for diagnosis and follow-up of cerebral venous thrombosis (CVT). Clin Radiol 1997;52:672-679 [DOI] [PubMed] [Google Scholar]
- 11.Yamada K, Naruse S, Nakajima K, et al. Flow velocity of the cortical vein and its effect on functional brain MRI at 1.5T: preliminary results by cine-MR venography. J Magn Reson Imaging 1997;7:347-352 [DOI] [PubMed] [Google Scholar]
- 12.Strouse PJ, Prince MR, Chenevert TL. Effect of the rate of gadopentetate dimeglumine administration on abdominal vascular and soft-tissue MR imaging enhancement patterns. Radiology 1996;201:809-816 [DOI] [PubMed] [Google Scholar]
- 13.Mitsuzaki K, Yamashita Y, Onomich M, Tschigame M, Takahashi M. Delineation of simulated vascular stenosis with Gd-DTPA enhanced 3D gradient-echo MR angiography: an experimental study. J Comput Assist Tomogr 2000;24:77-82 [DOI] [PubMed] [Google Scholar]
- 14.Hanley JA. Receiver operating characteristic (ROC) methodology: the state of the art. Clin Rev Diagn Imaging 1989;29:307-335 [PubMed] [Google Scholar]
- 15.Brant-Zawadzki M, Gillan GD, Nitz WR. MP RAGE: a three-dimensional, T1-weighted, gradient-echo sequence: initial experience in the brain. Radiology 1992;182:769-775 [DOI] [PubMed] [Google Scholar]
- 16.Fellner F, Holl K, Held P, Fellner C, Schmitt R, Bohm-Jurkovic H. A T1-weighted rapid three-dimensional gradient-echo technique (MP-RAGE) in preoperative MRI of intracranial tumours. Neuroradiology 1996;38:199-206 [DOI] [PubMed] [Google Scholar]
- 17.Brant-Zawadzki M, Gillan GD, Atkinson DJ, Edalatpour N, Jensen M. Three-dimensional MR imaging and display of intracranial disease: improvements with the MP-RAGE sequence and gadolinium. J Magn Reson Imaging 1993;3:656-662 [DOI] [PubMed] [Google Scholar]
- 18.Runge VM, Kirsch JE, Thomas GS, Mugler JP. Clinical comparison of three-dimensional MP-RAGE and FLASH techniques for MR imaging of the head. J Magn Reson Imaging 1991;1:493-500 [DOI] [PubMed] [Google Scholar]
- 19.Mirowitz SA. Intracranial lesion enhancement with gadolinium: T1-weighted spin-echo versus three-dimensional Fourier transform gradient-echo MR imaging. Radiology 1992;185:529-534 [DOI] [PubMed] [Google Scholar]
- 20.Tsuruda J, Saloner D, Norman D. Artifacts associated with MR neuroangiography. AJNR Am J Neuroradiol 1992;13:1411-1422 [PMC free article] [PubMed] [Google Scholar]
- 21.Kallmes DF, Cloft HJ, Jensen ME, Kaptain GJ, Dion JE, Matsumoto JA. Dural arteriovenous fistula: a pitfall of time-of-flight MR venography for the diagnosis of sinus thrombosis. Neuroradiology 1998;40:242-244 [DOI] [PubMed] [Google Scholar]
- 22.Davison SP, Facer GW, McGough PF, McCaffrey TV, Reder PA. Use of magnetic resonance imaging and magnetic resonance angiography in diagnosis of sigmoid sinus thrombosis. Ear Nose Throat J 1997;76:436-441 [PubMed] [Google Scholar]
- 23.Leach JL, Jones BV, Tomsick TA, Stewart CA, Balko MG. Normal appearance of arachnoid granulations on contrast-enhanced CT and MR of the brain: differentiation from dural sinus disease. AJNR Am J Neuroradiol 1996;17:1523-1532 [PMC free article] [PubMed] [Google Scholar]
- 24.Dormont L, Sag K, Biondi A, Wechsler B, Marsault C. Gadolinium-enhanced MR of chronic dural sinus thrombosis. AJNR Am J Neuroradiol 1995;16:1347-1352 [PMC free article] [PubMed] [Google Scholar]


