

Abstract
Summary: We present the serial MR studies of two patients with symptomatic acute large demyelinating lesions that initially showed a drop in apparent diffusion coefficient values. Baseline proton MR spectroscopy showed a slight decrease in N-acetylaspartate and a normal choline level. An excess of lactate was observed at the first examinations and completely disappeared by the final examinations.
The time-course evolution of the lesions shown by MR imaging and proton MR spectroscopic examinations suggests that the initial drop in apparent coefficient diffusion may have been related to dense inflammatory cell infiltration and scant tissue destruction or to reversible reduced vascular supply due to the severity of the inflammatory process.
Several studies have shown increased apparent diffusion coefficients (ADC) in cases of acute demyelinating lesions when compared with normal appearing white matter and even when compared with chronic demyelinating lesions (1–4). This ADC increase is thought to reflect an expanded extracellular space.
We report an atypical ADC decline in two cases of large symptomatic acute hemispheric demyelinating lesions in two patients. Both cases were studied by serial MR imaging during a 3-month period by using standard T2- and contrast-enhanced T1-weighted sequences, diffusion-weighted MR imaging, and single voxel proton MR spectroscopy (1H-MRS).
Technique
The two patients included in this report underwent MR imaging and 1H-MRS within the first 24 hr after the onset of symptoms and at 10, 20, and 90 days thereafter. MR imaging examinations were performed on a 1.5-T imager with a standard head coil and included the following pulse sequences: transverse T2-weighted fast spin-echo (3000/85/2 [TR/TE/NEX]), transverse fast fluid-attenuated inversion recovery (9000/110/2; inversion time, 2200 ms), and transverse T1-weighted spin-echo (600/15/2) sequences. This last sequence was repeated after injection of contrast material (0.1 mmol/kg; imaging delay, 5–10 min). We used a section thickness of 5 mm, a pixel size of approximately 1 × 1 mm, an interleaved imaging mode resulting in 26 contiguous sections covering the whole brain, a 240-mm field of view, and a 256 × 256 matrix.
Before performing the contrast-enhanced T1-weighted sequence, a diffusion-weighted sequence was performed with a single shot spin-echo echo-planar pulse (4000/100/2), with diffusion gradient b values of 0, 500, and 1000 s/mm2 along all three orthogonal axes over 15 axial sections, with a 5-mm section thickness (intersection gap, 1.5 mm), a 230-mm field of view, and a 96 × 128 matrix. The acquisition time for the diffusion-weighted images was 56 s. To minimize the effects of diffusion anisotropy, the primary diffusion-weighted data were automatically processed to yield standard isotropic diffusion-weighted images at each section position. ADC maps were generated on-line.
The large hemispheric lesions were localized in each of the studies on the T2-weighted sequence. Irregular regions of interest were manually traced on the T2-weighted images and subsequently projected onto the trace ADC maps to obtain mean ADC values. A percentage of ADC change was calculated from the lesions in each time point, using the mean ADC values obtained from the contralateral hemispheric normal appearing white matter as a control.
Proton spectra were obtained from the lesions and the contralateral site. The proton spectra were always obtained from a volume of interest defined by a cube of 1.2 or 1.5 cm on the side containing the lesion previously identified on the T2-weighted image and kept constant during the study. A 90°–180°–180° spin-echo-based pulse sequence was used. Proton spectra were recorded and analyzed as previously described (5). A contralateral spectrum from parenchyma containing normal appearing white matter was registered with the same parameters. The repositioning of the voxel in the follow-up studies took into account that the lesion had filled the voxel. Results of the spectra are presented as a percentage calculated from the lesions in each time point, using the mean values obtained from the contralateral hemispheric normal appearing white matter as a reference. However, because lactate was absent in the spectra obtained from the normal appearing white matter, its values are expressed in absolute institutional units after multiplying the areas by the reference pulse voltage to correct for differences in RF coil loading values (5).
The percentage of lesion volume within the voxel was calculated in each examination as the quotient between the lesion and voxel volumes (Table). Lesion volume was measured from the T2-weighted images by using a manual tracing technique. The perimeter of the area of high signal intensity was traced from the different sections where the lesion was visible and lesion volume was obtained by adding the areas and multiplying the value by the thickness.
Serial apparent diffusion coefficient and single voxel proton MR spectroscopy values in two large hemispheric lesions
| No. of Days after Symptom Onset | ADC | NAA* | Creatine* | Choline* | Lactate | Lesion/Voxel† |
|---|---|---|---|---|---|---|
| Lesion 1 | ||||||
| 1 | 66.8 | 58.9 | 95.3 | 109.5 | 20.8 | 81 |
| 10 | 90.0 | 45.8 | 85.0 | 157.6 | 46.8 | 87 |
| 20 | 111.0 | 27.9 | 93.3 | 132.5 | 42.8 | 92 |
| 90 | 132.0 | 38.4 | 106.6 | 144.5 | 0.0 | 85 |
| Lesion 2 | ||||||
| 1 | 77.3 | 64.7 | 84.7 | 103.2 | 36.2 | 85 |
| 10 | 80.2 | 52.8 | 105.1 | 135.2 | 13.5 | 89 |
| 20 | 154 | 45.7 | 101.2 | 145.7 | 0.0 | 91 |
| 90 | 138 | 60.4 | 110.3 | 146.4 | 0.0 | 82 |
Note—ADC indicates apparent diffusion coefficient; NAA, N-acetylaspartate; rADC, ADC of lesion × 100/ADC of normal appearing white matter.
Single voxel proton MR spectroscopy values expressed as a percentage calculated from the lesions in each time point, using the mean values obtained from the contralateral hemispheric normal appearing white matter as a reference.
Percentage of lesion volume within the proton MR spectroscopy voxel.
The MR imaging and 1H-MRS protocols were performed in a single session. The proton spectra were always acquired before the injection of contrast material.
Case Reports
Patient 1
A 22-year-old female patient was admitted to the hospital for sudden dysarthria and numbness of the right hand and ensuing right hemiparesis. A neurologic examination showed mild dysarthria and right hemiparesis (2/5), decreased pinprick sensation in the right hand, and right Babinski sign. Hematologic and blood chemical values were within normal limits, and carotid and transcranial Doppler ultrasonography showed no abnormalities. Twenty-four hours after hospital admission, T2-weighted MR imaging of the brain showed a 2-cm high signal intensity lesion in the left centrum semiovale (Fig 1A), which enhanced slightly on the contrast-enhanced T1-weighted image. On diffusion-weighted images, the lesion showed a marked increase in signal intensity and an approximately 33% mean ADC decline as compared with the contralateral hemispheric white matter (Fig 1E). Proton spectra showed a decrease of N-acetyl compounds (N-acetylaspartate [NAA]) (58.9% compared with the contralateral normal appearing white matter), excess lactate, and normal choline-containing compounds (Fig 1I).
Fig 1.
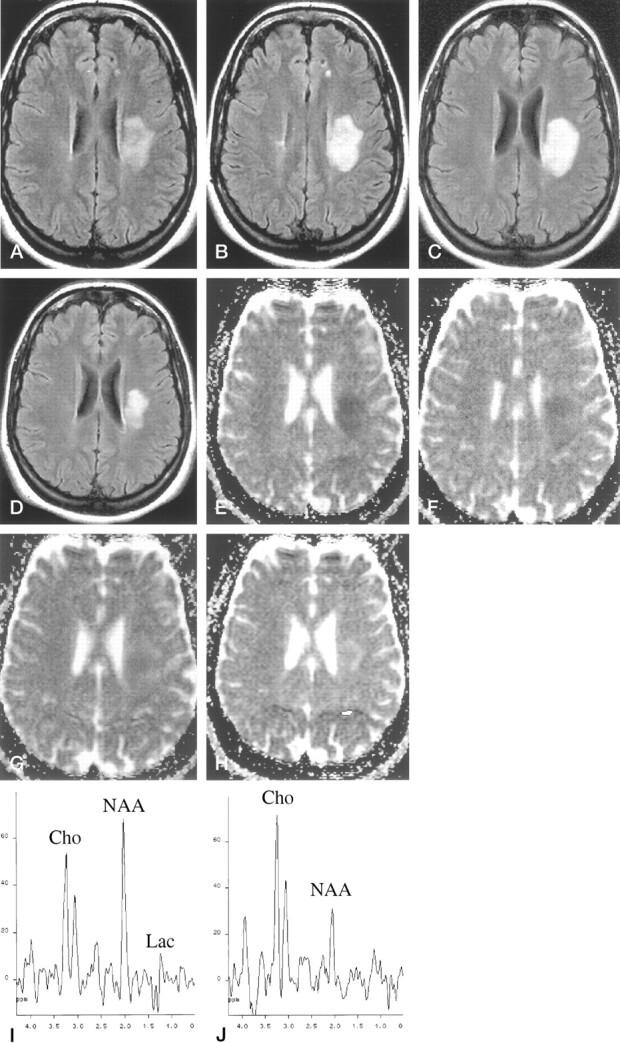
Patient 1, a 22-year-old woman who was admitted to the hospital for sudden dysarthria and numbness of the right hand and ensuing right hemiparesis.
A, Fast fluid-attenuated inversion recovery image (9000/110/2 [TR/TE/NEX]; inversion time, 2200 ms) obtained 1 day after symptom onset.
B, Fast fluid-attenuated inversion recovery image (9000/110/2; inversion time, 2200 ms) obtained 10 days after symptom onset. Left deep white matter lesion shows slight increase in size between initial images and those obtained 10 days after symptom onset.
C, Fast fluid-attenuated inversion recovery image (9000/110/2; inversion time, 2200 ms) obtained 20 days after symptom onset.
D, Fast fluid-attenuated inversion recovery image (9000/110//2; inversion time, 2200 ms) obtained 90 days after symptom onset. Significant size reduction can be seen on final images.
E, ADC map obtained 1 day after symptom onset shows signal drop within the lesion.
F, ADC map obtained 10 days after symptom onset shows signal drop within the lesion.
G, ADC map obtained 20 days after symptom onset shows an almost isointense signal.
H, ADC map obtained 90 days after symptom onset shows an increased signal intensity.
I, Initial proton spectrum obtained from lesion (spin-echo, 1600/135/256). Baseline examination shows slight decrease in NAA and a peak attributed to lactate (Lac). Cho, choline.
J, Final proton spectrum obtained from lesion (spin-echo, 1600/135/256). Final examination shows increase in choline (Cho), and lactate peak is not present.
Three days later, the patient’s condition deteriorated with the development of severe disarthria, right facial paresis, right hemiplegia, and loss of pinprick and vibration sensation in the right extremities. CSF was acellular with normal protein and glucose levels, but oligoclonal bands were present. Visual and somatosensory evoked potentials showed delayed responses. After a 5-day course of endovenous methylprednisolone, the patient experienced slight clinical improvement. A new MR imaging examination performed 10 days after the onset of symptoms showed a small increase in lesion size (Fig 1B) and a mean ADC that was 10% below normal values (Fig 1F). Additional small high-signal-intensity lesions were identified in the periventricular white matter, thus pointing to the diagnosis of demyelinating disease (Fig 1B). The increase in lesion size suggested active inflammation or demyelination, although no uptake of contrast material was identified, probably because of the effect of prednisolone. Proton spectra showed decreased NAA (45.8%), increased choline (157.6%), and persistent lactate as compared with the previous examination.
An MR imaging examination performed 20 days after symptom onset disclosed a mean lesion ADC that was slightly higher than that of the contralateral white matter (11%) (Fig 1G), decreased NAA (27.9%), increased choline (132.5%), and persistent excess of lactate. At the final MR imaging examination performed 90 days after symptom onset, the lesion showed a marked size reduction (Fig 1D), a mean lesion ADC that was 32% higher than that of contralateral white matter (Fig 1H), a slight increase in NAA as compared with the previous examination (38.4%), increased choline (144.5%), and complete disappearance of lactate (Fig 1J). After clinical follow-up for 16 months, the patient was asymptomatic and did not report any clinical relapse. A diagnosis of laboratory-supported multiple sclerosis according to the Poser criteria was established by the positive oligoclonal banding on the CSF study and by delayed visual evoked potentials.
Patient 2
A 22-year-old female patient was admitted to the hospital for sudden left pyramidal weakness and paresthesia. Central left facial palsy, mild left hemiparesis, and decreased pinprick sensation in the left limbs were observed. Hematologic and blood chemical values were within normal limits. Emergent contrast-enhanced CT of the brain and carotid and transcranial Doppler ultrasonography showed no abnormalities. CSF was acellular with normal protein and glucose levels, but oligoclonal bands were present.
One day after the onset of symptoms, MR imaging of the brain revealed a T2 high signal intensity lesion that was considered responsible for the patient’s symptoms. The lesion was located in the deep posterior right frontal white matter (Fig 2A) and showed a ring-enhancing pattern on contrast-enhanced T1-weighted images (Fig 2B). Additional small T2 lesions (one of them with contrast material uptake) were observed in the contralateral hemispheric white matter, suggesting demyelinating disease (Fig 2A). The symptomatic lesion showed marked high signal intensity on the diffusion-weighted images, with a 22% mean ADC decline as compared with contralateral white matter values (Fig 2C). 1H-MRS showed a complex signal at approximately 1.3 ppm pointing up and down due to the overlapping of lactate and lipids, a slight decrease in NAA (64.7%), and normal choline levels (Fig 2D). Response to endovenous methylprednisolone therapy was excellent. Visual, somatosensory, and brain stem auditory evoked potentials were normal.
Fig 2.
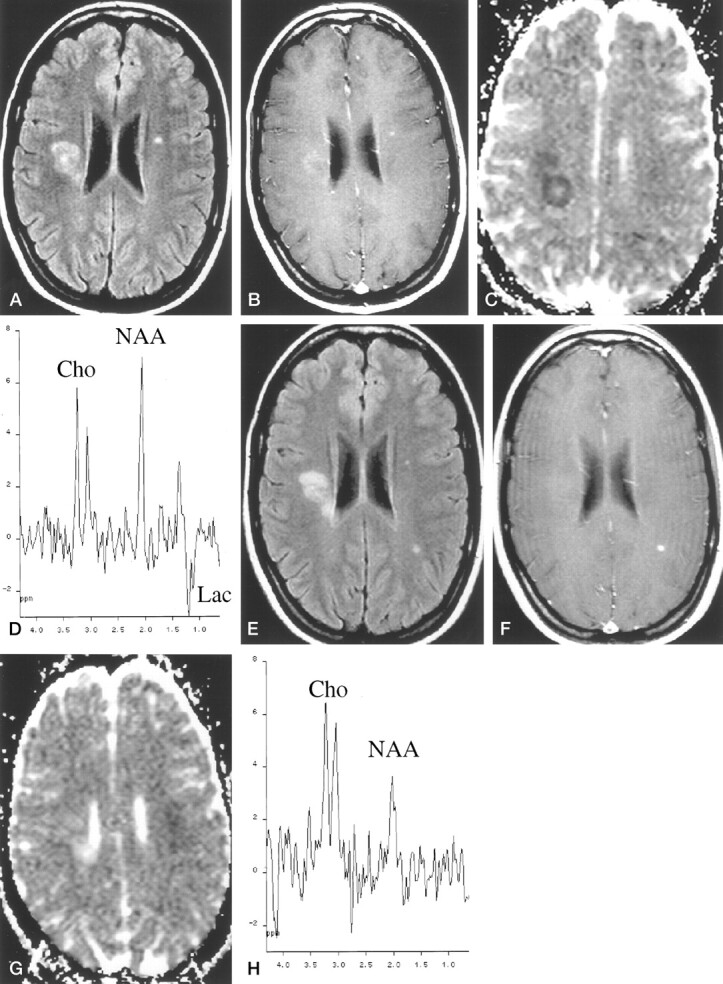
Patient 2, a 22-year-old woman who was admitted to the hospital for sudden left pyramidal weakness and paresthesia.
A, Fast fluid-attenuated inversion recovery image (9000/110/2 [TR/TE/NEX]; inversion time, 2200 ms) obtained 24 hr after symptom onset. Symptomatic high-signal-intensity lesion is identified in right deep white matter.
B, Contrast-enhanced T1-weighted image (600/15/2) obtained 24 hr after symptom onset. Symptomatic high-signal-intensity lesion shows slight peripheral enhancement.
C, ADC map obtained 24 hr after symptom onset. Symptomatic high-signal-intensity lesion shows marked signal drop compared with contralateral normal appearing white matter.
D, Initial proton spectrum (spin-echo, 1600/135). Lesion shows slight NAA decrease and excess of lactate (Lac). Cho indicates choline.
E, Fast fluid-attenuated inversion recovery image obtained 90 days after symptom onset. Symptomatic right lesion is slightly smaller as compared with initial examination. In addition, a new lesion appeared on the left parietal white matter.
F, Contrast-enhanced T1-weighted image obtained 90 days after symptom onset. Contrast material uptake is observed only in the new lesion.
G, ADC map obtained 90 days after symptom onset. Initial lesion is hyperintense compared with contralateral normal appearing white matter.
H, Final proton spectrum obtained 90 days after symptom onset. Symptomatic lesion shows reduced NAA signal, increased Cho signal, and absence of lactate.
On the MR images obtained 10 days after symptom onset, the lesion showed a slight size increase, with stronger ring enhancement and a persistent decline in ADC values. 1H-MRS showed a progressive, small decrease in NAA (52.8%) and lactate and a marked increase in choline (135.2%). On the MR images obtained 20 days after symptom onset, the lesion did not display a significant change in size or intensity of contrast material uptake but ADC values had increased, with a mean value that was 54% higher than that of normal white matter. 1H-MRS showed a slight decrease in NAA (45.7%) and lactate, whereas choline remained high.
On the MR images obtained 90 days after symptom onset, lesion size had decreased (Fig 2E), no contrast material uptake was seen (Fig 2F), and ADC remained high (Fig 2G). 1H-MRS showed a slight increase in NAA (60.4%) and complete disappearance of the lactate signal (Fig 2H), but choline signal was still high. A new subclinical contrast-enhancing lesion was detected in the left parietal white matter (Fig 2E and F). After clinical follow-up for 10 months, the patient showed clinical signs of relapse, thus fulfilling the Poser criteria for definite multiple sclerosis.
Discussion
Multiple sclerosis (MS) was diagnosed in the two patients described in this report on the basis of laboratory findings or signs of clinically definite MS according to the Poser criteria (6). Initially, the two large symptomatic hemispheric lesions represented a diagnostic dilemma between acute pseudotumoral demyelinating plaques and other focal lesions, such as glioma or acute infarction. Acute infarction was the diagnosis initially suggested for the patient 1.
The large acute lesions were clearly related to the patients’ symptoms; thus, it can be assumed that they were studied during their developing phase at the baseline MR examination. This assumption is also supported in that both lesions showed a slight but evident size increase during the first 20 days. These features together with their large volume, which obviated the problem of partial volume effects, made these acute demyelinating lesions an ideal model for analysis with various MR techniques. Although the percentage of lesion volume contained within the voxel varied because of changes in lesion volume, the differences were slight, with a range between the first and final examinations of 3.5% and 7.3%. Thus, it can be assumed that the serial 1H-MRS changes observed in the two patients were not simply related to different degrees of normal appearing white matter contamination.
Diffusion-weighted MR imaging in cases of acute demyelinating lesions usually shows increased diffusivity, which is thought to reflect expanded extracellular space, although the relative contribution from edema, demyelination, and axonal loss is not known (2–4). However, the two acute demyelinating lesions that we studied showed a drop in ADC during a short early phase, supporting a previous report in which restricted diffusivity was also shown in a small number of acute multiple sclerotic lesions (7). In contrast to our results, a recent study using serial diffusion-weighted MR imaging in cases of new, acute demyelinating lesions failed to show this transient diffusion decline (2). The reason for these contradictory findings might reside in the fact that the acute demyelinating lesions in the serial study were not specifically related to the clinical symptoms, so their precise age could not be accurately determined. Thus, a short early phase showing a drop in ADC could have been missed. In addition, our large hemispheric lesions did not represent the typically small demyelinating lesions, so our results may have corresponded to an unusual finding.
At the initial examination, the mean ADC values in our two lesions showed a 22% to 33% decrease, confirming that the high signal intensity observed in the isotropic diffusion-weighted images was not simply a T2 shine-through effect. High signal intensity in symptomatic lesions on isotropic diffusion-weighted images could suggest a diagnosis of acute infarction, although the decline in ADC values was not as pronounced as would be expected in the core of an acute infarction (40% to 50% within the first few days) (8, 9).
Three different hypotheses might explain the initial ADC decline: 1) swelling of the myelin sheaths could produce a shrinking of the extracellular space; 2) presence of reversible reduced vascular supply due to the severity of the inflammatory process could produce cytotoxic edema; and 3) dense inflammatory cell infiltration could inhibit effective motion of water molecules within the extracellular space (10–12). The two latter mechanisms of ADC decline are supported by the concomitant increase in lactate in the proton spectra observed during initial examinations in the most active stages of inflammation, an event related to the use of the anaerobic metabolic pathway by activated macrophages or ischemic tissue (13–15).
Additional features seen in the initial spectral pattern of our two lesions were slight decreases of NAA associated with normal choline levels. The initial NAA decrease progressed to a reduction of approximately 60%, and then the level of NAA showed a small increase after 3 months. These serial NAA changes would be unusual in the core of an acute infarction in which an abrupt and more severe NAA decrease would be expected from the beginning (16–18). The initially normal choline levels significantly increased in a way that inversely correlated with the time-course evolution of the ADC change. This inverse correlation might be a reflection of limited or absent myelin breakdown during the initial inflammatory reaction, which later increased, as suggested by the rise in choline. This early-phase demyelinating lesion showing no choline increase can be considered atypical (19) and could indicate that in our cases, the myelin breakdown process was delayed after the onset of the inflammatory process.
The major limitation of the results of this study is that large acute demyelinating hemispheric brain lesions are not commonly found in MR examinations of patients with clinically isolated demyelinating syndrome. Thus, our MR findings may not reflect the average dynamic behavior of demyelinating lesions. Our two patients had acute hemispheric syndrome that mimicked stroke, which provided us with the possibility of studying the lesions with MR from a very early phase. This situation is uncommon with patients who present for the first time with clinical syndrome more typical for demyelinating disease, such as optic neuritis, brain stem syndrome, or incomplete transverse myelitis. We cannot speculate regarding the incidence of ADC decline during the very early phase of large demyelinating lesions because we have not encountered other lesions of this type for which we could serially obtain diffusion-weighted images. It is likely that the increasing use of diffusion-weighted MR imaging in the study of acute demyelinating lesions will show whether our findings reflect a common feature or just an occasional finding.
Conclusion
A decline in ADC was shown during the early phase of two large acute demyelinating lesions. This feature may last for a few weeks, the time in which active inflammation persists. The time course evolution of ADC and 1H-MRS values seems to indicate that the ADC drop is produced by dense inflammatory cell infiltration with scant tissue destruction or by reversible reduced vascular supply due to the severity of the inflammatory process. The subsequent progressive increase in ADC correlated with cessation of inflammatory activity and progression of tissue damage.
Acknowledgments
The authors thank Celine L. Cavallo for English language support.
Footnotes
Supported by the Institut de Diagnòstic per la Imatge and by grants from the Fondo de Investigación Sanitaria of the Ministerio de Sanidad y Consumo (FIS Ref. 96/1747) and from the Comissionat per a Universitat i Recerca of the Generalitat de Catalunya (Ref. 1999SGR00328).
References
- 1.Tievsky AL, Ptak T, Farkas J. Investigation of apparent diffusion coefficient and diffusion tensor anisotrophy in acute and chronic multiple sclerosis lesions. AJNR Am J Neuroradiol 1999;20:1491–1499 [PMC free article] [PubMed] [Google Scholar]
- 2.Werring DJ, Brassat D, Droogan AG, et al. The pathogenesis of lesions and normal-appearing white matter changes in multiple sclerosis: a serial diffusion MRI study. Brain 2000;123:1667–1676 [DOI] [PubMed] [Google Scholar]
- 3.Roychowdhury S, Maldjian JA, Grossman RI. Multiple sclerosis: comparison of trace apparent diffusion coefficients with MR enhancement pattern of lesions. AJNR Am J Neuroradiol 2000;21:869–874 [PMC free article] [PubMed] [Google Scholar]
- 4.Cercignani M, Iannucci G, Rocca MA, Comi G, Horsfield MA, Filippi M. Pathologic damage in MS assessed by diffuion-weighted and magnetization transfer MRI. Neurology 2000;54:1139–1144 [DOI] [PubMed] [Google Scholar]
- 5.Cucurella MG, Rovira A, Rio J, et al. Proton magnetic resonance spectroscopy in primary and secondary progressive multiple sclerosis. NMR Biomed 2000;13:57–63 [DOI] [PubMed] [Google Scholar]
- 6.Poser CM, Paty DW, Scheinberg L, et al. New diagnostic criteria for multiple sclerosis: guidelines for research protocols. Ann Neurol 1983;13:227–231 [DOI] [PubMed] [Google Scholar]
- 7.Gass A, Moeckel R, Hirsch J, et al. Diffusion MRI characterisation of MS lesion evolution [abstract].Mult Scler 1999;5(Suppl 1):S21 [Google Scholar]
- 8.Schlaug G, Siewert B, Benfield A, Edelman RR, Warach S. Time course of the apparent diffusion coefficient (ADC) abnormality in human stroke. Neurology 1997;49:113–119 [DOI] [PubMed] [Google Scholar]
- 9.Warach S, Gaa J, Siewert B, Wielopolski P, Edelman RR. Acute human stroke studied by whole brain echo planar diffusion-weighted magnetic resonance imaging. Ann Neurol 1995;37:231–241 [DOI] [PubMed] [Google Scholar]
- 10.Tien R, Felsberg G, Friedman H, Brown M, MacFall J. MR imaging of high-grade cerebral gliomas: value of diffusion-weighted echoplanar pulse sequences. AJR Am J Roentgenol 1994;162:671–677 [DOI] [PubMed] [Google Scholar]
- 11.Brunberg J, Chenevert T, McKeever P, et al. In vivo MR determination of water diffusion coefficients and diffusion anisotropy: correlation with structural alteration in gliomas of the cerebral hemispheres. AJNR Am J Neuroradiol 1995;16:361–371 [PMC free article] [PubMed] [Google Scholar]
- 12.Els T, Eis M, Hoehn-Berlage M, Hossmann K. Diffusion-weighted MR imaging of experimental brain tumors in rats. MAGMA 1995;3:13–20 [DOI] [PubMed] [Google Scholar]
- 13.De Stefano N, Matthews PM, Antel JP, Preul M, Francis G, Arnold DL. Chemical pathology of acute demyelinating lesions and its correlation with disability. Ann Neurol 1995;38:901–909 [DOI] [PubMed] [Google Scholar]
- 14.Bitsch A, Bruhn H, Vougioukas V, et al. Inflammatory CNS demyelination: histopathologic correlation with in vivo quantitative proton MR spectroscopy. AJNR Am J Neuroradiol 1999;20:1619–1627 [PMC free article] [PubMed] [Google Scholar]
- 15.Petroff OA, Graham GD, Blamire AM, et al. Spectroscopic imaging of stroke in humans: histopathology correlates of spectral changes. Neurology 1992;42:1349–1354 [DOI] [PubMed] [Google Scholar]
- 16.Houkin K, Kamada K, Kamiyama H, Iwasaki Y, Abe H, Kashiwaba T. Longitudinal changes in proton magnetic resonance spectroscopy in cerebral infarction. Stroke 1993;24:1316–1321 [DOI] [PubMed] [Google Scholar]
- 17.Mathews VP, Barker PB, Blackband SJ, Chatham JC, Bryan RN. Cerebral metabolites in patients with acute and subacute strokes: concentrations determined by quantitative proton MR spectroscopy. AJR Am J Roentgenol 1995;165:633–638 [DOI] [PubMed] [Google Scholar]
- 18.Lanfermann H, Kugel H, Heindel W, Herholz K, Heiss WD, Lackner K. Metabolic changes in acute and subacute cerebral infarctions: findings at proton MR spectroscopic imaging. Radiology 1995;196:203–210 [DOI] [PubMed] [Google Scholar]
- 19.Ernst T, Chang L, Walot I, Huff K. Physiologic MRI of a tumefactive multiple sclerosis lesion. Neurology 1998;51:1486–1488 [DOI] [PubMed] [Google Scholar]