

Abstract
BACKGROUND AND PURPOSE: Age-related iron accumulation in extrapyramidal nuclei causes T2 shortening, which may result in decreased signal intensity in these areas on MR images. Because the dynamic susceptibility contrast-enhanced technique uses heavily T2*- or T2-weighted images, the iron-induced susceptibility may have direct impact on perfusion imaging. The purpose of this study was to assess the effect of iron-induced susceptibility on the calculated perfusion parameters. The difference of this effect between gradient-echo and spin-echo sequences was also assessed.
METHODS: Dynamic susceptibility contrast-enhanced MR perfusion imaging data of 12 patients were used for this study. Perfusion images were obtained using a single shot spin-echo echo-planar imaging sequence in seven patients and a gradient-echo echo-planar imaging sequence in five patients. Region of interest measurements of relative cerebral blood flow, relative cerebral blood volume, and mean transit time were obtained at various parts of the gray matter, including the globus pallidus, putamen, caudate nucleus, thalamus, and cerebral cortex of temporal, frontal, and occipital lobes. The baseline signal intensity on the source images and the magnitude of signal change (ΔR2* or ΔR2) were also assessed.
RESULTS: The globus pallidus had statistically significantly lower values of relative cerebral blood flow, relative cerebral blood volume, baseline signal intensity, and magnitude of signal change compared with other parts of the gray matter for both gradient-echo and spin-echo sequences (P < .05). Underestimations of these values were more prominent for the gradient-echo than for the spin-echo sequence. Little variance in the measured mean transit time was noted.
CONCLUSION: Iron-induced susceptibility effect may lead to underestimation of relative cerebral blood flow and relative cerebral blood volume in the basal ganglia.
MR perfusion imaging using IV administered contrast material has been shown to provide useful information about cerebral hemodynamics (1–7). While passing through the cerebral vasculature, a short bolus of contrast material produces local magnetic field inhomogeneities that lead to reduction in the transverse relaxation time of the tissue. This susceptibility effect can be recorded by a series of T2*- or T2-weighted images, using gradient-echo and spin-echo sequences, respectively. The recorded signal intensity time curves can be converted into concentration time curves from which the perfusion parameters are calculated (8). The method is known as dynamic susceptibility contrast-enhanced MR perfusion imaging. The gradient-echo sequences have gained popularity for clinical practice because of the superior sensitivity of this sequence in depicting the signal change by the passage of contrast material. However, the drawback of gradient-echo imaging sequences is their higher sensitivity not only to the microvasculature of the brain but also to the macrovasculature, including the large arteries and veins at the brain surface (9).
Susceptibility effect occurs not only by the passage of IV administered contrast material but also by other means, such as age-related iron accumulation in the extrapyramidal nuclei (10, 11). We hypothesized that preexisting susceptibility effects in brain tissue may influence the degree of transient signal drop caused by the bolus of contrast material, leading to error in estimated perfusion at these locations. This may become a potential pitfall in the interpretation or measurement of MR perfusion images. Thus, our goal was to elucidate the effect of susceptibility artifacts in the extrapyramidal nuclei on dynamic susceptibility contrast-enhanced MR perfusion images. The differences of this effect between the gradient-echo and spin-echo sequences were also assessed.
Methods
Institutional review board approval and informed consent were obtained for our study.
Patients
The study population included 12 patients who underwent dynamic susceptibility contrast-enhanced MR perfusion imaging for evaluation of acute cerebral infarction. All patients underwent follow-up imaging studies, either MR imaging or CT, which allowed the determination of the final territory of infarction. Patient age ranged from 33 to 80 years (mean age, 65.3 years).
MR Imaging Technique
Images were obtained with a 1.5-T whole body imager retrofitted for echo-planar imaging capabilities. The perfusion images were obtained using single shot echo-planar imaging sequences as a part of our standard stroke protocol (1). The echo-planar imaging sequences were 1500/50, 75 (TR/gradient TE, spin TE) with a flip angle of 90 degrees. The bandwidth of each sequence was set to nearly identical values with only 0.1% difference. The spin-echo echo-planar imaging sequence was used for seven patients (mean age, 63.7 years), and the gradient-echo echo-planar imaging sequence was used for five patients (mean age, 68.2 years). Forty-six serial images were obtained in each of the 11 sections. Section thickness and intersection gaps were 6 and 1 mm, respectively. A 256 × 128 acquisition matrix was used with a 40 × 20 cm field of view, leading to a voxel size of 1.6 × 1.6 × 6.0 mm. Gadopentetate dimeglumine (Magnevist; Berlex Laboratories, Princeton, NJ) was injected (0.2 mmol/kg of body weight). Contrast material was injected 10 s after the start of imaging, at a rate of 5 mL/s, with the use of an MR imaging–compatible power injector (Medrad, Pittsburgh, PA). A similar volume of normal saline was injected immediately after the bolus of contrast material, also at a rate of 5 mL/s.
Calculation of Perfusion Maps
The empirically determined relationship between magnitude of signal change (ΔR2 ) and tissue concentration of contrast material is characterized by the following relationship (8):
 |
where conc. is the local tissue concentration of the contrast material, Si /S0 is the fractional signal intensity change from the baseline signal, and TE is the echo time of the pulse sequence. This formula was used to convert the recorded signal intensity time curve to a concentration time curve. The relative cerebral blood flow (rCBF) images were obtained by deconvolution by using singular value decomposition (12, 13). The arterial input functions were chosen from the pixels adjacent to contralateral middle cerebral artery. The relative cerebral blood volume (rCBV) was calculated from the area under the curve of the concentration-time trajectory. The mean transit time (MTT) was calculated from the ratio of the rCBV and rCBF (MTT = rCBV/rCBF).
Measurements of Perfusion Parameters
The rCBF, rCBV, and MTT of the following areas of gray matter were assessed: globus pallidus, caudate nucleus, putamen, thalamus, and the cerebral cortex of insula, frontal, temporal, and occipital lobes (Fig 1). Each perfusion parameter was estimated from the region of interest measurements of the signal intensity on the perfusion maps. Gray matter-white matter ratios were calculated using the signal intensity at the white matter of the temporal lobe on the ipsilateral hemisphere. The source images of the dynamic susceptibility contrast-enhanced MR perfusion images were also evaluated. The baseline signal intensity and the maximum amount of signal change (ΔR2* and ΔR2 for gradient-echo and spin-echo sequences, respectively) were calculated from the source images at each region of interest. Data regarding gradient-echo and spin-echo sequences were evaluated separately and were compared to elucidate the differences between the sequences.
Fig 1.
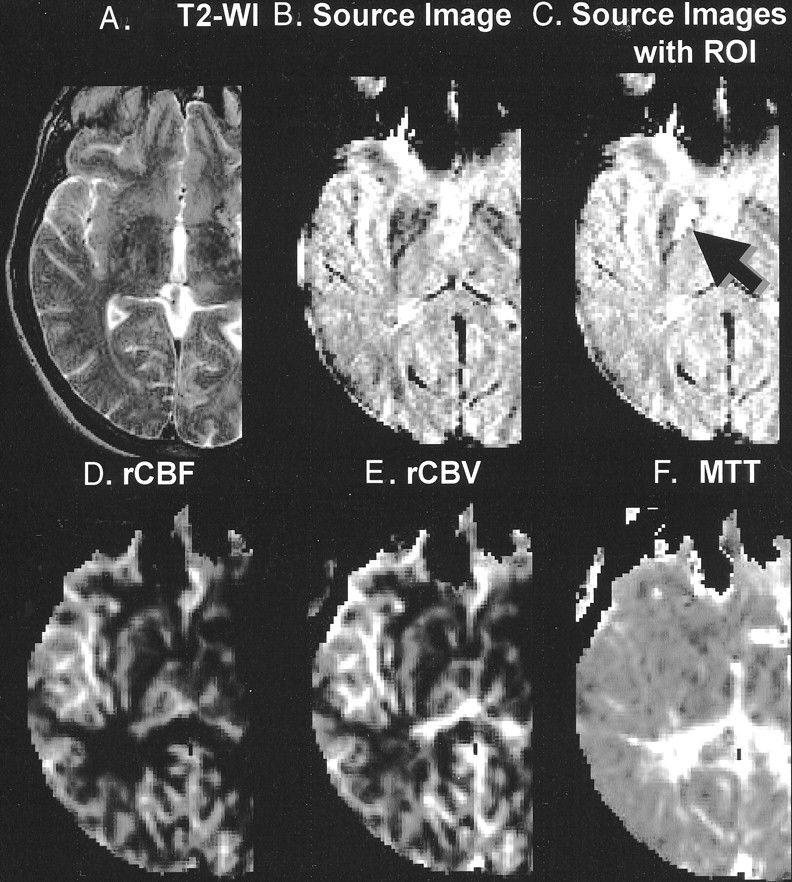
Representative case with region of interest on globus pallidus (arrow).
A, Conventional T2-weighted image (T2-WI).
B, Source image obtained by gradient-echo echo-planar imaging sequence. Note the hypointensity at the globus pallidus and putamen. Also note the susceptibility effect at the frontal skull base near the air-tissue interface.
C, Source image shows region of interest (ROI) (arrow). Anatomic boundary of the region of interest was determined based on the imaging findings.
D, Perfusion map shows rCBF.
E, Perfusion map shows rCBV.
F, Perfusion map shows MTT.
Statistical Analysis
The differences of the measured values between the gradient-echo and spin-echo sequences and the values of each gray matter region were assessed using the unpaired t test. P < .05 was considered significant.
Results
Analysis of the Perfusion Parameters
The measured values of rCBF, rCBV, and MTT at each region of interest are shown in Figure 2. These values are the gray matter-white matter ratios calculated with the white matter of the ipsilateral temporal lobe as the denominator.
Fig 2.

Graphs show measured values of rCBF, rCBV, and MTT at each region of interest. Error bars indicate SD ± 1. Measured values were normalized with the temporal white matter (WM), and values on the y axis thus represent gray matter-white matter ratios. Dashed horizontal lines intersect at a gray matter-white matter ratio of 1. Statistically significant differences in the mean values between various locations are indicated (*, P < .05; **, P < .005; ***, P < .0005; unpaired t test). Columns with statistically significant differences between gradient-echo (GRE) and spin-echo (SE) sequences are marked (†, statistically significant difference between gradient-echo and spin-echo with P < .05; ‡, statistically significant difference between gradient-echo and spin-echo with P < .005). Columns marked by these symbols represent those with higher values.
A, Measurements of the rCBF by gradient-echo echo-planar imaging.
B, Measurements of the rCBF by spin-echo echo-planar imaging.
C, Measurements of the rCBV by gradient-echo echo-planar imaging.
D, Measurements of the rCBV by spin-echo echo-planar imaging.
E, Measurements of the MTT by gradient-echo echo-planar imaging.
F, Measurements of the MTT by spin-echo echo-planar imaging.
The gray matter-white matter ratios of rCBF and rCBV at the globus pallidus were statistically significantly lower (P < .05) than at the other parts of the gray matter for both gradient-echo and spin-echo sequences (Fig 2A–D). Despite the significantly lower measures of rCBF and rCBV at the globus pallidus, the MTT showed less significant variance relative to the other parts of the gray matter (Fig 2E and F).
For the gradient-echo sequence, the rCBF and rCBV of the cortical gray matter were higher relative to the putamen, caudate nucleus, and thalamus (Fig 2A and C). This trend between the cortical and central gray matter was not apparent for the spin-echo sequence (Fig 2B and D).
Analysis of the Source Data
The measured baseline signal intensity at each region of interest is shown in Figure 3. The baseline signal intensity measured at the globus pallidus and putamen were lower than that of the cerebral cortices for both gradient-echo and spin-echo sequences. This result was anticipated, considering the visually apparent hypointense signal at these locations on the source images. The trend of lower baseline signal intensity was more prominent for the gradient-echo sequence (Fig 4).
Fig 3.

Signal intensity time curves of gradient-echo (GRE) and spin-echo (SE) echo-planar imaging sequences. Region of interest measurements were obtained from three representative locations: globus pallidus, caudate head, and thalamus. The y axes for both gradient-echo and spin-echo sequences are scaled to the same range of signal intensity (400–1600 A.U.). Note that the signal change is more prominent on the gradient-echo sequence than on the spin-echo sequence. The signal intensity difference between the thalamus and globus pallidus is also more prominent for the gradient-echo sequence.
Fig 4.

Trend of lower baseline signal intensity was more prominent for gradient-echo (GRE) sequence. Error bars indicate SD ± 1. Measured values were normalized with temporal white matter (WM), and y axis thus represents gray matter:white matter ratio (*, P < .05; **, P < .005; unpaired t test). Columns with statistically significant differences between gradient-echo and spin-echo (SE) sequences are marked (†, statistically significant difference between gradient-echo and spin-echo sequences with P < .05). Columns marked by these symbols represent those with higher values.
A, Measurements of the baseline signal intensity by gradient-echo echo-planar imaging.
B, Measurements of the baseline signal intensity by spin-echo echo-planar imaging.
C, Measurements of maximum magnitude of signal change by gradient-echo echo-planar imaging.
D, Measurements of maximum magnitude of signal change by spin-echo echo-planar imaging.
The gray matter-white matter ratios of ΔR2* (for the gradient-echo sequence) and ΔR2 (for the spin-echo sequence) at each region of interest are shown in Figure 4C and D, respectively. These values were significantly lower at the globus pallidus as compared with the other parts of the gray matter for both gradient-echo and spin-echo sequences. In addition, the ΔR2* of the putamen, caudate nucleus, and thalamus were lower relative to the cortical gray matter for the gradient-echo sequence (Fig 4C). This trend was not apparent for the spin-echo sequence (Fig 4D).
Discussion
The gray matter-white matter ratios in our study ranged from approximately 3.0 to 4.0 and from approximately 2.0 to 3.0 for rCBF and rCBV, respectively. Although these values are slightly higher relative to the published values from positron emission tomography (PET) studies (14–16), they are in good agreement with those of the previous MR perfusion imaging studies (17–19). Slightly lower values for the PET studies are well documented and are attributed to various technical factors that involve both MR imaging and PET methodologies, with partial volume averaging with the white matter one of the major causes for underestimation in the PET studies (19, 20). All the measured values in our study fell within the previously published range of gray matter-white matter ratios derived from the MR perfusion imaging studies, with only one distinct exception, which was the globus pallidus, where there were significantly lower measures of rCBF and rCBV as compared with the other parts of the gray matter. A search through the MR perfusion literature revealed one article that recorded a similar trend of lower measurement at the globus pallidus (21). That article, however, did not assess or comment on this fact, and our study is thus the first, to the best of our knowledge, that undertook a deeper inspection into this observation.
The question arises regarding whether this is a modality-dependent phenomenon. The best way to assess that question may be to review the previous brain perfusion studies by PET and single photon emission CT. Largely because of the limited spatial resolution of the PET and single photon emission CT studies, however, blood flow and volume assessments have been typically limited to measurement of the entire lentiform nucleus or putamen alone (22–26) rather than the globus pallidus separately from the putamen. Only a limited number of published functional brain mapping studies have been reported that have used PET to perform flow measurement at the globus pallidus separately from the putamen, and none of those studies revealed significantly lower flow at the globus pallidus compared with the other parts of the gray matter (27–30). Therefore, we think that the lower measure of rCBF and rCBV at the globus pallidus on the dynamic susceptibility contrast-enhanced MR perfusion images is a modality-dependent phenomenon.
Although there may be multiple possible causes for the flow volume underestimation at the globus pallidus, one of the most conceivable sources of this phenomenon may be iron-induced T2 shortening at the extrapyramidal nuclei. The majority of the nonheme iron in the brain is accumulated in a form of ferritin, an iron-storage protein, which has been shown to exert a strong magnetic effect that results in marked T2 shortening in vivo and in vitro (31). The sites of preferential accumulation of ferric iron seen with Perls staining on postmortem brains are the globus pallidus, reticular substantia nigra, red nucleus, and dentate nucleus, whereas significantly lower concentrations are found in the striatum, thalamus, and cerebral gray and white matter (32, 33). The pallidal iron deposits that are absent on the MR images of infants and children appear in young adults and reach their asymptotic concentration during the 3rd decade of life (10, 34) . This iron-induced hypointensity on T2-weighted images is considered an imaging characteristic of normal aging (10, 33, 35) .
Heavily T2*- or T2-weighted images are used as the source data for dynamic susceptibility contrast-enhanced MR perfusion imaging, and these images will be directly influenced by the iron-induced T2 shortening. As expected, the measured signal intensity of the source data of perfusion imaging at the globus pallidus and putamen was approximately 10% to 30% lower relative to the other parts of the gray matter in our series of patients (Fig 4A and B). This hypointensity, however, is not directly responsible for the underestimation of the flow and volume, because the perfusion parameters are calculated from the magnitude of signal change (ΔR2* or ΔR2 = – ln (Si/S0 )/TE) rather than the baseline signal intensity (S0). In other words, the degree of iron accumulation will not affect the estimated perfusion unless it exerts some effect on the magnitude of signal change induced by the bolus of contrast material.
We have shown in this study that the magnitude of signal change at the globus pallidus is lower relative to the other parts of the gray matter. The linear relationship of the magnitude of signal change with the tissue concentration of contrast material is the essential assumption for MR perfusion studies; our results may indicate that this linearity is not preserved in extreme conditions such as heavy iron accumulation in the tissue. A nonlinear relationship has been predicted by Boxerman et al (9) at high concentrations of contrast material, and their results may be extrapolated to the extreme condition that was examined in our study. Both tissue iron and contrast material may cause local magnetic field perturbation. However, susceptibility effect due to tissue iron content is far more complex than the intravascular paramagnetic contrast material; the tissue iron produces superparamagnetism or ferromagnetism that may be dependent on various factors, including crystal size, distribution, and magnetic field strength (31). Assessment of the relationship between tissue iron and magnitude of signal change requires further investigation.
The effects of noise in the data should also be considered as a source of underestimation. As the baseline signal intensities of the source data approach zero, the signal-to-noise ratio of the ΔR2* and ΔR2 decreases. However, if noise is a significant cause of the underestimation, a larger SD of the data at the globus pallidus would also be expected. This increased variance was not observed, and we thus conclude that the noise contamination is of minor effect, if any, on the underestimation of the flow and volume at the globus pallidus. The effect of noise, however, may vary depending on the magnetic field and imaging technique, and thus, it should be always considered as a possible source of error in perfusion calculation.
It is noteworthy that MTT was less significantly affected by the iron-induced T2 shortening. The MTT in our study was calculated from the ratio of rCBF and rCBV (MTT = rCBV/rCBF) (36, 37), whereas the rCBF and rCBV were estimated directly from the concentration time curves, using deconvolution of the concentration time curve by an arterial input function for rCBF (12, 13) and calculation of the area under the curve for rCBV. Thus, the relatively high resistance of MTT against the iron-induced T2 shortening may indicate that both rCBF and rCBV had degrees of underestimation that were within the same range. This unique property of the MTT may be advantageous when the MR perfusion study is aimed to assess a pathologic condition involving the globus pallidus.
The results of our study show two major notable differences between the gradient-echo and spin-echo echo-planar imaging sequences. First, the underestimations of the flow, volume, and magnitudes of signal change (ΔR2* or ΔR2) at the globus pallidus were more pronounced with the gradient-echo than with the spin-echo sequence. These differences between the two sequences may be explained by the well-known higher sensitivity of the gradient-echo sequence to susceptibility effects. Lack of 180-degree refocusing pulses on the gradient-echo sequences make them more susceptible to field heterogeneity and thus more vulnerable to the tissue iron in the extrapyramidal nuclei. This may have led to more pronounced underestimation of ΔR2* for the gradient-echo sequence and thus may have resulted in the lower estimations of rCBF and rCBV.
The second point of discrepancy between the gradient-echo and spin-echo sequences is the higher rCBF and rCBV at the cerebral cortex on gradient-echo images relative to the central gray matter. This bimodal trend was not apparent for the spin-echo sequence (Fig 2A–D). This phenomenon can be explained by the difference in the sensitivity to micro- and macrovasculatures. As described by Boxerman et al (9), there is considerably greater effect from the macrovasculature when using the gradient-echo sequence, whereas the spin-echo sequence is relatively independent of macrovascular volume fraction. The higher sensitivity to the macrovasculatures of the gradient-echo sequence may have led to an overestimation of the flow and volume at the cortex, where the effect from the adjacent large cortical vessels cannot be ignored. This effect from the macrovasculature may be insignificant at the central gray matter, where a less prominent large vessel effect is expected.
In addition to the physiological accumulation of iron at the extrapyramidal nuclei, there are other pathologic conditions that may result in deposition of paramagnetic substances in brain tissue. For instance, pathologic T2 shortening at the basal ganglia has been reported in association with conditions including multiple sclerosis (38), Parkinson’s disease (39), Huntington’s disease (39), Hallervorden-Spatz disease (40), and Down syndrome (41) and in children with cerebral infarctions (42, 43). Errors in blood flow and volume estimation may occur in these settings if the concentration of the accumulated paramagnetic substance is high enough to cause significant T2 shortening. It is important to note, however, that the degree of iron accumulation seems to have a certain threshold below which the underestimation does not occur. The putamen, for example, had rCBF, rCBV, and signal change magnitudes that were significantly higher than those of the globus pallidus, even though there was some hypointensity on the source images. Although we advocate the evaluation of the source data of perfusion images whenever there is a question of pathologic iron accumulation, the existence of such a threshold may prevent this from ruling in the underestimation of flow and volume as a possible cause.
The findings reported herein should be viewed in the context of several methodologic limitations. First, the study is founded on an assumption that the flow volume at globus pallidus is not significantly different from that at the other parts of the central gray matter. This is based on previous PET studies that have measured the flow in the globus pallidus (27–30). Because the aims of these studies were not to measure the flow at the basal ganglia but to assess the functional aspect of the brain, the provided data may not be strong enough to support our assumption. An extensive literature search revealed one rat study that described lower flow at the globus pallidus as compared with the other parts of the central gray matter (44), which may be a plausible cause for the lower flow at the globus pallidus on MR perfusion images. However, not all the animal data can be directly extrapolated to humans, and we hold our perspective of this study based on the previous PET data (27–30). Rapidly improving spatial resolution of PET images may be able to provide more accurate knowledge of the regional blood flow volume in the near future. An apparently different trend of the flow volume at globus pallidus between spin-echo and gradient-echo sequences may at least in part support our hypothesis that the hypoperfusion at globus pallidus shown on dynamic susceptibility contrast-enhanced MR perfusion-weighted images is a modality-dependent phenomenon. Second, even with the relatively high spatial resolution of this MR imaging technique compared with the PET and single photon emission CT studies, the effect of partial volume averaging may not be completely negligible when measuring small structures like the globus pallidus. The voxel size of our MR imaging technique is 1.6 × 1.6 × 6.0 mm, and thus the spatial resolution along the z axis is somewhat limited. These anisotropic voxels may make the measurement vulnerable to partial volume effect, especially at the edges of the target volumes. MR perfusion studies with volumetric acquisition (45) may improve the spatial resolution along the z axis, and this may allow for more accurate estimation of blood flow and volume. Third, absolute quantification of the perfusion parameters was not attempted and only the relative values were assessed in this study, namely the gray matter-white matter ratios. Direct quantification of the perfusion will allow for the correlation of the results with the PET and single photon emission CT studies, and this undoubtedly would be beneficial for the verification of the data and for future extension of the technique to various pathologic conditions. A method that may allow for absolute quantification is currently under investigation. Fourth, the patient population of this study included those who underwent MR perfusion imaging for evaluation of acute infarcts. Although the unaffected hemispheres were used for measurements, the remote effect from the infarcted hemispheres cannot be completely excluded. This effect is called transhemispheric diaschisis (46, 47), which represents the remote depression of function in the contralateral hemisphere via the transcallosal connecting fibers. However, this effect has been shown to be delayed by several days after stroke onset (46), and others have shown the metabolism to be normal in the unaffected hemisphere during the acute stage (47, 48). Therefore, the transhemispheric diaschisis can be neglected in our patient population because our patients underwent imaging within a day of symptom onset.
Conclusion
Iron-induced T2 shortening may result in underestimation of the measured blood flow and volume based on dynamic susceptibility contrast-enhanced MR perfusion imaging, which may become a potential pitfall of this technique. Differences between the gradient-echo and spin-echo sequences are highlighted by higher sensitivity of the gradient-echo sequence to iron at the globus pallidus and the macrovasculature along the cerebral cortex. The spin-echo technique is less vulnerable to these effects and may show more precise perfusion estimation. When one is looking for perfusion abnormalities at the areas where there is heavy iron accumulation, MTT may be the parameter of choice because it is most resistant to iron-induced T2 shortening.
Acknowledgments
The authors thank David A. Shrier for reviewing the manuscript.
Footnotes
Supported in part by research grants PHS R01NS8477, R01-HL39810, and P41-RR14075. Also supported by a grant from the Brain Science Foundation and an International Investigator’s Award (to K.Y.) from the Japanese Society of Magnetic Resonance in Medicine.
References
- 1.Sorensen AG, Buonanno FS, Gonzalez RG, et al. Hyperacute stroke: evaluation with combined multisection diffusion-weighted and hemodynamically weighted echo-planar MR imaging. Radiology 1996;199:391–401 [DOI] [PubMed] [Google Scholar]
- 2.Rosen BR, Belliveau JW, Vevea JM, Brady TJ. Perfusion imaging with NMR contrast agents. Magn Reson Med 1990;14:249–265 [DOI] [PubMed] [Google Scholar]
- 3.Sorensen AG, Copen WA, Østergaard L, et al. Hyperacute stroke: simultaneous measurement of relative cerebral blood volume, relative cerebral blood flow, and mean tissue transit time. Radiology 1999;210:519–527 [DOI] [PubMed] [Google Scholar]
- 4.Nighoghossian N, Berthezene Y, Philippon B, Adeleine P, Froment JC, Trouillas P. Hemodynamic parameter assessment with dynamic susceptibility contrast magnetic resonance imaging in unilateral symptomatic internal carotid artery occlusion. Stroke 1996;27:474–479 [DOI] [PubMed] [Google Scholar]
- 5.Belliveau JW, Rosen BR, Kantor HL, et al. Functional cerebral imaging by susceptibility-contrast NMR. Magn Reson Med 1990;14:538–546 [DOI] [PubMed] [Google Scholar]
- 6.Rordorf G, Koroshetz WJ, Copen WA, et al. Diffusion- and perfusion-weighted imaging in vasospasm after subarachnoid hemorrhage. Stroke 1999;30:599–605 [DOI] [PubMed] [Google Scholar]
- 7.Warach S, Dashe JF, Edelman RR. Clinical outcome in ischemic stroke predicted by early diffusion-weighted and perfusion magnetic resonance imaging: a preliminary analysis. J Cereb Blood Flow Metab 1996;16:53– 59 [DOI] [PubMed] [Google Scholar]
- 8.Rosen BR, Belliveau J, Chien D. Perfusion imaging by nuclear magnetic resonance. Magn Reson Q 1989;5:263–281 [PubMed] [Google Scholar]
- 9.Boxerman JL, Hamberg LM, Rosen BR, Weisskoff RM. MR contrast due to intravascular magnetic susceptibility perturbations. Magn Reson Med 1995;34:555–566 [DOI] [PubMed] [Google Scholar]
- 10.Schenker C, Meier D, Wichman W, Boesiger P, Valvanis A. Age distribution and iron dependency of the T2 relaxation time in the globus pallidus and putamen. Neuroradiology 1993;35:119–1 24 [DOI] [PubMed] [Google Scholar]
- 11.Milton WJ, Atlas SW, Lexa FJ, Mozley PD, Gur RE. Deep gray matter hypointensity patterns with aging in healthy adults: MR imaging at 1.5 T. Radiology 1991;181:715– 719 [DOI] [PubMed] [Google Scholar]
- 12.Østergaard L, Weisskoff RM, Chesler DA, Glydensted C, Rosen RB. High resolution measurement of cerebral blood flow using tracer bolus passages: part I. mathematical approach and statistical analysis. Magn Reson Med 1996;36:715–725 [DOI] [PubMed] [Google Scholar]
- 13.Østergaard L, Sorensen AG, Kwong KK, et al. High resolution measurement of cerebral blood flow using tracer bolus passages: part II. experimental comparison and preliminary results. Magn Reson Med 1996;36:726–736 [DOI] [PubMed] [Google Scholar]
- 14.Yamaguchi T, Kino I, Uemura K, et al. Reduction in regional cerebral metabolic rate of oxygen during human aging. Stroke 1986;17:1220–1228 [DOI] [PubMed] [Google Scholar]
- 15.Leenders KL, Perani D, Lammertsma AA, et al. Cerebral blood flow, blood volume and oxygen utilization: normal values and effect of age. Brain 1990;113:27–47 [DOI] [PubMed] [Google Scholar]
- 16.Hatazawa J, Fujita H, Kanno I, et al. Regional cerebral blood flow, blood volume, oxygen extraction fraction, and oxygen utilization rate in normal volunteers measured by the autoradiographic technique and the single breath inhalation method. Ann Nucl Med 1995;9:15–21 [DOI] [PubMed] [Google Scholar]
- 17.Nighoghossian N, Berthezene Y, Philippon B, Adeleine P, Froment JC, Trouillas P. Hemodynamic parameter assessment with dynamic susceptibility contrast magnetic resonance imaging in unilateral symptomatic internal carotid artery occlusion. Stroke 1996;27:474–479 [DOI] [PubMed] [Google Scholar]
- 18.Liu HL, Pu Y, Liu Y, et al. Cerebral blood flow measurement by dynamic contrast MRI using singular value decomposition with an adaptive threshold. Magn Reson Med 1999;42:167–172 [DOI] [PubMed] [Google Scholar]
- 19.Ellinger R, Kremser C, Schocke MF, et al. The impact of peak saturation of the arterial input function on quantitative evaluation of dynamic susceptibility contrast-enhanced MR studies. J Comput Assist Tomogr 2000;24:942–948 [DOI] [PubMed] [Google Scholar]
- 20.Müller-Gärtner HW, Links JM, Prince JL, et al. Measurement of radiotracer concentration in brain gray matter using positron emission tomography: MRI-based correction for partial volume effects. J Cereb Blood Flow Metab 1992;12:571–583 [DOI] [PubMed] [Google Scholar]
- 21.Speck O, Chang L, DeSilva NM, Ernst T. Perfusion MRI of the human brain with dynamic susceptibility contrast: gradient-echo versus spin-echo techniques. J Magn Reson Imaging 2000;12:381–387 [DOI] [PubMed] [Google Scholar]
- 22.Otte A, Nitzsche EU, Hoegerle S, Simon GH, Moser E. PET and SPECT in whiplash syndrome: a new approach to a forgotten brain? J Neurol Neurosurg Psychiatry 1997;63:368–372 [DOI] [PMC free article] [PubMed] [Google Scholar]
- 23.Ebmeier KP, Prentice N, Ryman A, Halloran E, Goodwin GM, et al. Temporal lobe abnormalities in dementia and depression: a study using high resolution single photon emission tomography and magnetic resonance imaging. J Neurol Neurosurg Psychiatry 1997;63:597–604 [DOI] [PMC free article] [PubMed] [Google Scholar]
- 24.Harris GJ, Codori AM, Lewis RF, Schmidt E, Bedi A, Brandt J. Reduced basal ganglia blood flow and volume in pre-symptomatic, gene-tested persons at-risk for Huntington’s disease. Brain 1999;122:1667–1678 [DOI] [PubMed] [Google Scholar]
- 25.Krausz Y, Bonne O, Gorfine M, Karger H, Lerer B, Chisin R. Age-related changes in brain perfusion of normal subjects detected by 99m Tc-HMPAO SPECT. Neuroradiology 1998;40:428–434 [DOI] [PubMed] [Google Scholar]
- 26.Kazumata K, Antonini A, Dhawan V, et al. Preoperative indicators of clinical outcome following stereotaxic pallidotomy. Neurology 1997;49:1083– 1090 [DOI] [PubMed] [Google Scholar]
- 27.Perlmuter JS, Powers WJ, Herscovitch P, Fox PT, Raichle ME. Regional asymmetries of cerebral blood flow, blood volume and oxygen utilization and extraction in normal subjects. J Cereb Blood Flow Metab 1987;7:64–67 [DOI] [PubMed] [Google Scholar]
- 28.Winstein CJ, Grafton ST, Pohl PS. Motor task difficulty and brain activity: investigation of goal-directed reciprocal aiming using positron emission tomography. J Neurophysiol 77 ;1997. :1581–1594 [DOI] [PubMed] [Google Scholar]
- 29.Seitz RJ, Roland PE. Vibratory stimulation increases and decreases the regional cerebral blood flow and oxidative metabolism: a positron emission tomography (PET) study. Acta Neurol Scand 1992;86:60– 67 [DOI] [PubMed] [Google Scholar]
- 30.Boecker H, Dagher A, Ceballos-Baumann AO, et al. Role of the human rostral supplementary motor area and the basal ganglia in motor sequence control: investigations with H2 15O PET. J Neurophysiol 1998;79:1070–1080 [DOI] [PubMed] [Google Scholar]
- 31.Bartzokis G, Mintz J, Sultzer D, et al. In vivo MR evaluation of age-related increases in brain iron. AJNR Am J Neuroradiol 1994;15:1129–1138 [PMC free article] [PubMed] [Google Scholar]
- 32.Drayer B, Burger P, Darwin R, Riederer S, Herfkens R, Johnson GA. MRI of brain iron. AJR Am J Roentgenol 1986;147:103–110 [DOI] [PubMed] [Google Scholar]
- 33.Drayer BP. Imaging of the aging brain: I. normal findings. Radiology 1988;166:785– 796 [DOI] [PubMed] [Google Scholar]
- 34.Aoki S, Okada Y, Nishimura K, et al. Normal deposition of brain iron in childhood and adolescence: MR imaging at 1.5 T. Radiology 1989;172:381–385 [DOI] [PubMed] [Google Scholar]
- 35.Davis PC, Mirra SS, Alazraki N. The brain in older persons with and without dementia: findings on MR, PET and SPECT images. AJR Am J Roentgenol 1994;162:1267–1278 [DOI] [PubMed] [Google Scholar]
- 36.Stewart GN. Researches on the circulation time in organs and on the influences which affect it: parts I–III. J Physiol 1894;15:1–89 [DOI] [PMC free article] [PubMed] [Google Scholar]
- 37.Meier P, Zierler KL. On the theory of the indicator-dilution method for measurement of blood flow and volume. J Appl Physiol 1954;6:731–744 [DOI] [PubMed] [Google Scholar]
- 38.Drayer B, Burger P, Hurwitz B, Dawson D, Cain J. Reduced signal intensity on MR images of thalamus and putamen in multiple sclerosis: increased iron content? AJNR Am J Neuroradiol 1987;8:413– 419 [DOI] [PubMed] [Google Scholar]
- 39.Chen JC, Hardy PA, Kucharczyk W, et al. MR of human postmortem brain tissue: correlative study between T2 and asssays of iron and ferritin in Parkinson and Huntington disease. AJNR Am J Neuroradiol 1993;14:275– 281 [PMC free article] [PubMed] [Google Scholar]
- 40.Østergaard JR, Christensen T, Hansen KN. In vivo diagnosis of Hallervorden-Spatz disease. Dev Med Child Neurol 1995;37:827– 833 [DOI] [PubMed] [Google Scholar]
- 41.Roth GM, Sun B, Greensite FS, Lott IT, Dietrich RB. Premature aging in persons with Down syndrome: MR findings. AJNR Am J Neuroradiol 1996;17:1283– 1289 [PMC free article] [PubMed] [Google Scholar]
- 42.Dietrich RB, Bradley WG Jr. Iron accumulation in the basal ganglia following severe ischemic-anoxic insults in children. Radiology 1988;168:203–206 [DOI] [PubMed] [Google Scholar]
- 43.Cross PA, Atlas SW, Grossman RI. MR evaluation of brain iron in children with cerebral infarction. AJNR Am J Neuroradiol 1990;11:341–348 [PMC free article] [PubMed] [Google Scholar]
- 44.Ollenberger GP, West NH. Distribution of regional cerebral blood flow in voluntarily diving rats. J Exp Biol 1998;201:549–558 [DOI] [PubMed] [Google Scholar]
- 45.Flacke S, Urbach H, Folkers PJ, et al. Ultra-fast three-dimensional MR perfusion imaging of the entire brain in acute stroke assessment. J Magn Reson Imaging 2000;11:250–259 [DOI] [PubMed] [Google Scholar]
- 46.Andrews RJ. Transhemispheric diaschisis, a review and comment. Stroke 1991;22:943–949 [DOI] [PubMed] [Google Scholar]
- 47.Iglesias S, Marchal G, Rioux P, et al. Do changes in oxygen metabolism in the unaffected cerebral hemisphere underlie early neurological recovery after stroke? Stroke 1996;27:1192–1199 [DOI] [PubMed] [Google Scholar]
- 48.Wise R, Gibbs J, Frackowiak R, Marshall J, Jones T. No evidence for transhemispheric diaschisis after human cerebral infarction. Stroke 1986;17:853–861 [DOI] [PubMed] [Google Scholar]