Abstract
BACKGROUND AND PURPOSE: In patients with clinical symptoms suggestive of a retrocochlear disorder, contrast-enhanced T1-weighted spin-echo (SE) high-field-strength MR imaging is considered the criterion standard in assessing vestibular schwannoma. However, only 10–20% of its findings are pathologic. Our purpose was to prospectively compare the performance of low-field-strength MR imaging in screening for retrocochlear disorders, with high-field-strength MR imaging as the criterion standard.
METHODS: A total of 287 patients with suspected retrocochlear disease underwent axial 1.5-T MR imaging with a T1-weighted SE sequence before and after contrast enhancement and with a high-resolution T2-weighted construction interference in steady state sequence. At immediate follow-up, the same patients underwent axial 0.2-T T1-weighted SE imaging without additional contrast enhancement. Results were classified as negative, positive, or uncertain and were analyzed in light of the patients’ clinical symptoms.
RESULTS: MR imaging at 1.5 T depicted 63 disorders (21.95%), including 53 schwannomas, three other tumors, and seven other disorders (ie, gadolinium-enhancing inner ear, facial nerve, or meninges). MR imaging at 0.2 T showed evidence of 58 disorders; five disorders were not detected, although all schwannomas and other tumors were seen, including those smaller than 2 mm, and only two (28.6%) of the other disorders were detected. When correlated with clinical data, results showed that the five undetected disorders occurred in patients with unusual clinical signs.
CONCLUSION: MR imaging at 0.2 T provided high sensitivity in detecting vestibular schwannoma of the internal auditory canal or cerebellopontine angle; it can be used for mass screening for this disease. Positive and uncertain imaging findings should be followed up with high-field-strength MR imaging.
Vestibular schwannoma is the most common mass of the internal auditory canal (IAC) and the cerebellopontine angle (CPA) that is responsible for unilateral sensorineural hearing loss (1, 2). Contrast-enhanced T1-weighted spin-echo (SE) high-field-strength MR imaging has rapidly become the accepted criterion standard for the evaluation of vestibular schwannoma (3–5). However, the frequency of positive MR findings in cases in which clinical circumstances suggest a vestibular schwannoma is low; only 10–20% of the results are pathologic (3–7). Therefore, high-field-strength MR imaging findings are often normal in patients with these schwannomas, and many authors have searched for a method that reduces imaging time and cost (1, 3, 5, 8)
The object of our study was to compare the diagnostic results of low-field-strength (0.2-T) and high-field-strength (1.5-T) MR imaging of the ear in detecting retrocochlear diseases. We were mainly looking for tumors of the IAC or CPA, in particular, vestibular schwannoma. The purpose of the study was to compare the sensitivity of both techniques in detecting small tumors (intracanalicular vestibular schwannomas smaller than 5 mm) in the same patients. We sought to answer the question: Can a small vestibular schwannoma be reliably diagnosed by using low-field-strength MR imaging?
Methods
A total of 286 patients who underwent examination for retrocochlear disorders were included in the longitudinal study. Clinical signs included sensorineural hearing loss with or without vertigo and with or without tinnitus. Informed consent was obtained from the patients, and our institutional review board approved this study.
Patients initially underwent MR imaging with a 1.5-T machine (Vision; Siemens, Erlangen, Germany). Acquisitions involved the use of a T2-weighted turbo SE sequence of the entire skull, an axial T1-weighted SE sequence centered on the IAC before contrast administration, (TR/TE, 550/20; 2-mm section thickness; 300 × 512 matrix; 280 × 280 FOV; three acquisitions, acquisition time, 5 minutes 10 seconds), a CISS sequence centered on the IAC (12.25/5.90, 230 × 512 matrix, 165 × 220 FOV, 0.7-mm section thickness, 8-minute 40-second acquisition time), and an axial T1-weighted SE sequence after the administration of gadolinium-based contrast agent (same parameters as those of the precontrast T1-weighted SE sequence).
During immediate follow-up, the patients underwent MR imaging with a 0.2-T machine (Magnetom Open; Siemens). The patients left the room containing the 1.5-T machine and immediately went to the 0.2-T machine; the time between both examinations was less than 1 minute. No additional contrast material was injected. An axial T1-weighted SE sequence, centered on the IAC, was performed with the optimal high-resolution parameters for this MR unit (4-mm section thickness, 230 × 512 matrix, 225 × 300 FOV, three acquisitions, 650/15, 6-minute 11-second acquisition time).
Two observers (FD, PB) read the investigations. Observer 1 had extensive experience in MR imaging and with ear, nose, and throat disorders. Observer 2 was a general radiologist with less experience in otolaryngologic MR imaging. MR images were read randomly (0.2- or 1.5-T images), and observers were given no information about the patients’ identity. The images were simply numbered; the 0.2- and 1.5-T images had different numbers, and the reviewers never read both of the 0.2- and 1.5-T images for the same patient at the same time. Images in the two piles (one pile of 0.2-T images and one pile of 1.5-T images) were well mixed. Both observers completed a reading grid by using the following classification: negative, which indicated no disorder in the IAC, CPA, or internal ear; positive, which indicated a disorder in the IAC, CPA, or internal ear; or uncertain.
When the image was classified as positive, the observer mentioned the type of disorder (tumoral or other). If a tumor was detected, the type of tumor was indicated (vestibular schwannoma, meningioma, epidermoid cyst, or other), along with its size, extension into the IAC (percentage) and extension into the fundus of the IAC. In particular, the observer described its extension into the cochlear fossa, that is, the cochlear aperture where the lesion may arise along the distal cochlear division of the vestibulocochlear nerve in the vicinity of the modulus (9, 10). Therefore, the extension in the cochlear fossa was indicated (cochlear fossa affected, not affected, or not readable). In nontumoral disorders, the observers indicated the gadolinium-enhancing structures (eg, the labyrinth, facial nerve, meninges) and the final diagnosis.
We also asked patients which of the two examinations (0.2 or 1.5 T) they preferred, with respect to overall comfort and noise, without taking investigation duration into account. A more in-depth clinical study of the patients was also undertaken to analyze clinical and audiometric results, as well as the auditory brain stem response. Patients were subsequently classified into four groups: group 1, with a probable retrocochlear disorder; group 2, with a possible retrocochlear disorder; group 3, unlikely to have a retrocochlear disorder; and group 4, with atypical clinical signs (eg, hearing loss with acute onset, mixed-type hearing loss, associated facial paralysis.)
Results
A total of 286 patients were enrolled in the study. Five patients did not undergo 1.5-T MR imaging on account of claustrophobia; they underwent only 0.2-T MR imaging, because it used an open magnet. Therefore, the data of 281 patients were included in the comparative statistical analysis.
On the 1.5-T images, results were identical for both observers. A total of 63 disorders were detected (prevalence, 22.4%), among which 53 were vestibular schwannomas (eight small [2–5 mm] and intracanalar), three other tumors in the CPA, three cases of gadolinium enhancement of the labyrinth, three cases of nontumoral gadolinium enhancement of the facial nerve, and one case of nontumoral gadolinium enhancement of the meninges.
On the 0.2-T images, observer 1 detected 58 disorders (57 positive and one uncertain); five disorders were not seen. Comparative results for observer 1 with the 1.5- and 0.2-T images, respectively, were as follows: 53 and 53 vestibular schwannomas (52 positive, one uncertain), three and three other tumors, two and three cases of enhancement in the labyrinth, no and three cases of enhancement of the facial nerve, and no and one case of enhancement of meninges (Table 1).
TABLE 1:
Comparative results for observer 1
| Findings at 1.5 T | |||
|---|---|---|---|
| Findings at 0.2 T | Retrocochlear Disorder | No Retrocochlear Disorder | Total |
| Positive | 58* | 0 | 58 |
| Negative | 5 | 218 | 223 |
| Total | 63 | 218 | 281 |
Note.—Concordance κ value = 0.95.
Of these, 57 were positive, and one was uncertain.
On the 0.2-T images, observer 2 detected 58 disorders (52 positive, six uncertain); five disorders were not seen. Comparative results for observer 2 with the 1.5- and 0.2-T images, respectively, were as follows: 53 and 53 schwannomas (48 positive, five uncertain), three and three other tumors, two and three cases of enhancement in the labyrinth (one positive, one uncertain), no and three cases of enhancement of the facial nerve, no and one case of enhancement of meninges, and one false-positive finding (Table 2).
TABLE 2:
Comparative results for observer 2
| Findings at 1.5 T | |||
|---|---|---|---|
| Findings at 0.2 T | Retrocochlear Disorder | No Retrocochlear Disorder | Total |
| Positive | 58* | 1† | 59 |
| Negative | 5 | 217 | 222 |
| Total | 63 | 218 | 281 |
Note.—Concordance κ value = 0.93.
Of these, 51 were positive, and seven were uncertain.
This finding was uncertain.
With the 1.5-T images as the criterion standard, the sensitivity profile of the 0.2-T examination for observer 1 was as follows: sensitivity, 92.06%; specificity, 100%; positive predictive value, 100%; negative predictive value, 97.75%. For observer 2, the profile was as follows: sensitivity, 92.06%; specificity, 100%; positive predictive value, 98.3%; negative predictive value, 97.74%. Concordance κ values between 0.2- and 1.5-T findings were 0.95 for observer 1 and 0.93 for observer 2.
Interobserver results yield a global κ of 0.943, according to the χ2 test. No significant difference was found between both observers, with χ2 = 0.435 (confidence interval ranging from 0.91 to 0.97; P = .8)
In group 1 (patients with probable retrocochlear disorder), the 1.5-T images depicted 63.6% of the pathologic conditions. In the group 2 (patients with possible retrocochlear disorder), they depicted 17.6%. In the group 3 (those unlikely to have a retrocochlear disorder), they depicted 4%, and in the group 4 (those with atypical clinical signs), they depicted 57.1%. Results according for observer 1 (Table 3) showed that, in groups 1, 2 and 3, all pathologic conditions were found by using both the 1.5- and the 0.2-T images. For group 4, 57.1% of the findings were pathologic on the 1.5-T images, but only 33.3% were pathologic on the 0.2-T images.
TABLE 3:
Comparative results according with clinical groups
| Result | Group 1(n = 33) | Group 2(n = 153) | Group 3(n = 74) | Group 4(n = 21) |
|---|---|---|---|---|
| Findings on 1.5-T images | ||||
| Total disorders | 21 (63.6) | 27 (17.6) | 3 (4.1) | 12 (57.1) |
| Tumoral disorders | 20 (60.6) | 27 (17.6) | 3 (4.1) | 6 (28.6) |
| Nontumoral disorders | 1 (3.0) | 0 (0) | 0 (0) | 6 (28.6) |
| Findings on 0.2-T images | ||||
| Total disorders | 21 (63.6) | 27 (17.6) | 3 (4.1) | 7 (33.3) |
| Tumoral disorders | 20 (60.6) | 27 (17.6) | 3 (4.1) | 6 (28.6) |
| Nontumoral disorders | 1 (3.0) | 0 (0) | 0 | 1 (4.8) |
Note.—Data in parentheses are percentages.
Discussion
The aim of this study was to analyze the sensibility of low-field-strength MR imaging in detecting retrocochlear disorders in patients with clinical symptoms of vestibular schwannoma, in particular, small schwannomas. High-field-strength MR imaging with gadolinium enhancement has been considered the criterion standard since the 1990s. However, this examination has a 4–8% false-negative rate (6, 7), and patients with symptoms such as sensorineural hearing loss, vertigo, and tinnitus must undergo clinical follow-up. A lot of patients with clinical findings suggestive of vestibular schwannoma have normal findings on with high-field-strength MR images; only 10–20% of the imaging findings are pathologic (3, 5, 6). Therefore, given the present efforts to reduce healthcare costs and the time needed for on high-field-strength examination, several groups (1, 3, 5, 8) have tried to find a simple, fast, acceptable MR method for the screening of peripheral vestibulo-cochlear disorders. To our knowledge, our group is the first to assess mass screening for retrocochlear disease with low-field-strength MR imaging and the first to compare low- and high-field-strength imaging of the ear in the same patients. Recently, low- and high-field-strength MR systems were compared in several studies (11–14). Low-field-strength MR units are cheaper and potentially more cost-effective, but they produce lower quality images because of their poor signal-to-noise ratio, their inability to permit the use of thin sections, and their poor spatial resolution (11, 15–18). The aim of this study was to analyze the usefulness of low-field-strength imaging in detecting small disorders of the IAC, despite its inability to permit the use of thin sections and its poor spatial resolution. To become a reliable method for the screening of retrocochlear disorders, the low-field-strength examination must have the same sensibility as that of the high-field-strength examination in detecting acoustic schwannoma.
Global Analysis of Results
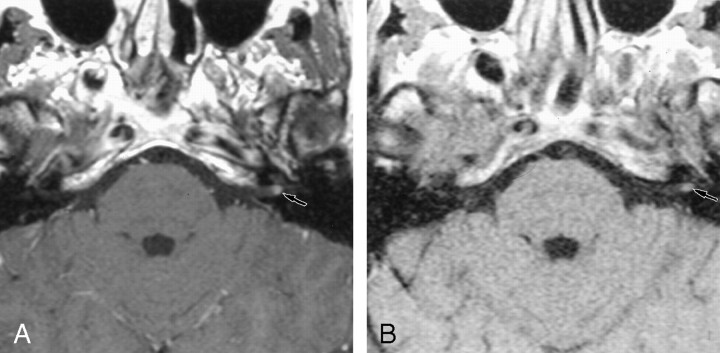
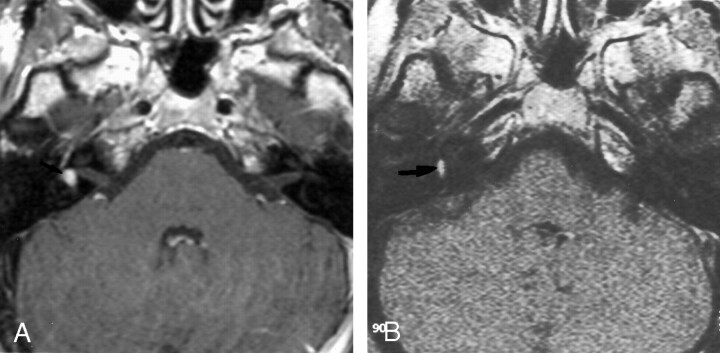
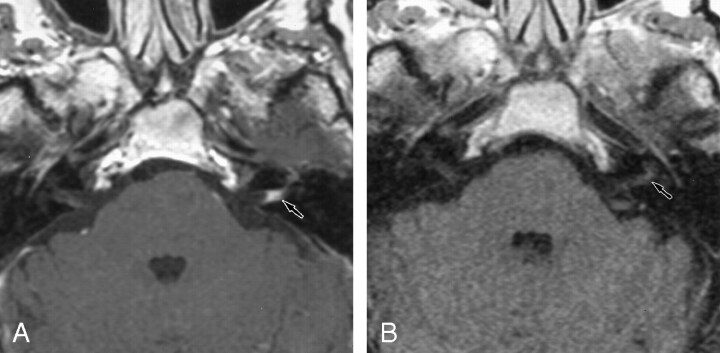
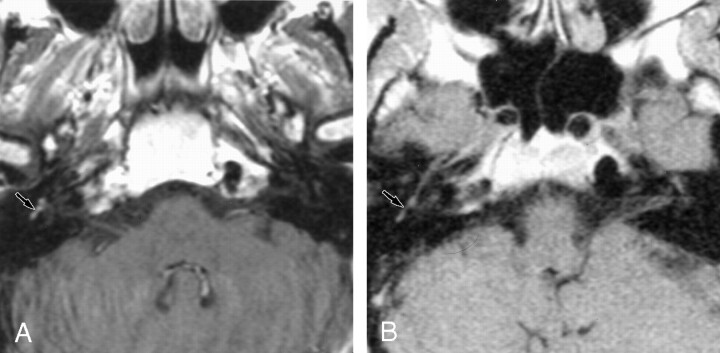
Retrocochlear tumors, whether vestibular schwannoma or other tumors of the CPA, were all detected on the 0.2-T images, even when they were very small (2 mm) (Fig 1). Two small intralabyrinthine schwannomas were seen on 0.2-T MR images (Fig 2). The five nontumoral undetected pathologic conditions were due to meningeal enhancement in the IAC (Fig 3), or facial nerve enhancement (Fig 4). The analysis of concordance between the 1.5- and 0.2-T yielded an excellent κ value that ranged from 0.93 to 0.95, depending on the observer.
Fig 1.
Axial contrast-enhanced T1-weight-ed MR images show a small vestibular schwannoma.
A, The 1.5-T image (550/20/3) obtained at the level of the IAC shows a small (2-mm) left vestibular schwannoma in the fundus of the IAC.
B, The 0.2-T image (650/15/3) obtained at the same level depicts the small vestibular schwannoma.
Fig 2.
Axial contrast-enhanced T1-weight-ed MR images show an intra-labyrinthine schwannoma.
A, The 1.5-T image (550/20/3) shows a posterior enhancement of the right labyrinth (arrow), which corresponds to a schwannoma in the vestibule.
B, The 0.2-T image (650/15/3) obtained at the same level depicts this intravestibular schwannoma (arrow).
Fig 3.
Axial contrast-enhanced T1-weight-ed MR images show meningeal enhancement in the IAC.
A, The 1.5-T image (550/20/3) obtained at the level of the IAC shows contrast enhancement in the left IAC, with concave limits corresponding to a meningeal enhancement (arrow).
B, The 0.2-T image (650/15/3) shows no contrast enhancement in the left IAC (arrow).
Fig 4.
Axial contrast-enhanced T1-weight-ed MR images show enhancement of the facial nerve.
A, The 1.5-T image (550/20/3) shows contrast enhancement of the second portion of the right facial nerve.
B, The 0.2-T image (650/15/3) depicts no significant contrast enhancement at this level.
Detailed Analysis of Results According to Clinical Group
The clinical signs of the five undetected nontumoral disorders were all atypical. They included sudden-onset hearing loss, facial paralysis, or mixed-type hearing loss; alternatively, they were seen in the context of postoperative follow-up. According to the classification in the four groups (made with the otologists), disorders that were not detected with 0.2-T images all belonged to group 4 (patients with atypical clinical signs). When we excluded patients in group 4, (ie, 21 patients excluded, resulting in 265 patients included in the study), the sensitivity and positive predictive value of the study was 100% with the 0.2-T images, with the 1.5-T images as a criterion standard.
Five (71.4%) of the seven nontumoral disorders detected with the 1.5-T images were missed on the 0.2-T images; six of these disorders were classified in group 4. This finding confirms the fact that this clinical group should not undergo examination with a 0.2-T machine.
Interobserver Analysis
The interobserver analysis showed concordant results, with a global κ of 0.943. The χ2 test revealed that no significant difference was present between the observers (P = .8). This result suggests that a radiologist with less experience in reading MR images of the ear had results that were statistically concordant with those of a more experienced reader.
Analysis of Tumor Extension
Among the 53 schwannomas detected with the 0.2-T images, extension to the cochlear fossa was impossible to assess in 50% of the cases. However, this information is essential when schwannomas are small (stage I or II), because this is one of the criteria used to determine the surgical approach (10). Thus, for 21 small schwannomas (39.6%) detected with the 0.2-T images, further investigation with 1.5-T imaging was necessary. Therefore, patients in group 1 with signs that are highly suggestive of schwannoma should probably also be excluded from 0.2-T MR examination, as the retrocochlear disorder was confirmed in 61.8% of cases.
Analysis of Patient Comfort
The 0.2-T examination was better tolerated than the 1.5-T examination, mostly because it uses an open magnet and is not likely to make patients feel “closed in.” Five patients felt so claustrophobic in the 1.5-T machine that the investigation had to be cancelled, whereas four of the same patients were able to undergo MR imaging with the 0.2-T machine with no problem. (The remaining patient also felt claustrophobic in the 0.2-T machine.) Results of a questionnaire given to the 286 patients after both investigations showed that a large majority (98.9%) had a marked preference for the 0.2-T examination; patients stated that they did not feel as “closed-in” and that the noise level was more tolerable.
Conclusion
The 0.2-T examination appears to be reliable in detecting vestibular schwannomas and, more generally, retrocochlear disorders. It fails, however, to expose many other nontumoral diseases, or it does so poorly. Therefore, an accurate description of the patient groups that may benefit from 0.2-T screening (eg, patients in whom a retrocochlear disorder is possible or unlikely) is important. Patients with atypical clinical signs should be excluded from the group, because their disorders are poorly detected with 0.2-T imaging. After this restriction is applied, the patients (ie, those in groups 2 and 3 in our study) who may undergo 0.2-T MR imaging to detect or rule out a vestibular schwannoma still number 231 (81%) of the initial 286 who were referred for MR imaging of the ear. In our center, approximately 250 of our annual patients belong to the groups 2 or 3. If a schwannoma is detected or if the interpretation is uncertain with the 0.2-T images, patients should undergo 1.5-T MR imaging. This situation occurred in only 6% of the examined patients.
Given the present efforts to reduce overall healthcare costs, the use of low-field-strength MR units seems to be a cost-effective alternative for screening vestibular schwannomas.
References
- 1.Armington WG, Harnsberger HR, Smoker WRK, Osborn AG. Normal and diseased acoustic pathway: evaluation with MR imaging. Radiology 1988;167:509–515 [DOI] [PubMed] [Google Scholar]
- 2.Davidson HC. Imaging evaluation of sensorineural hearing loss. Semin Ultrasound CT MRI 2001;22:229–249 [DOI] [PubMed] [Google Scholar]
- 3.Allen RW, Harnsberger HR, Shelton C, et al. Low-cost high-resolution Fast spin-echo MR of acoustic schwannoma: an alternative to enhanced conventional spin-echo MR? AJNR Am J Neuroradiol 1996;17:1205–1210 [PMC free article] [PubMed] [Google Scholar]
- 4.Enzmann DR, O’Donohue J. Optimizing MR imaging for detecting small tumors in the cerebellopontine angle and internal auditory canal. AJNR Am J Neuroradiol 1987;8:99–106 [PMC free article] [PubMed] [Google Scholar]
- 5.Stuckey SL, Harris AJ, Mannolini SM. Detection of acoustic schwannoma: use of constructive interference in steady state three-dimensional MR. AJNR Am J Neuroradiol 1996;17:1219–1225 [PMC free article] [PubMed] [Google Scholar]
- 6.Jackler RK. Cost-effective screening for acoustic neuroma with unenhanced MR: a clinician’s perspective. AJNR Am J Neuroradiol 1996;17:1226–1228 [PMC free article] [PubMed] [Google Scholar]
- 7.Jackler R. Acoustic neuroma (vestibular schwannoma). In: Jackler R, Brackmann DE, eds. Neurotology. St Louis, Mo: Mosby-Year Book;1994. :729–785
- 8.Fukui MB, Weissman JL, Curtin HD, Kanal E. T2-weighted MR characteristics of internal auditory canal masses. AJNR Am J Neuroradiol 1996;17:1211–1218 [PMC free article] [PubMed] [Google Scholar]
- 9.Salzman KL, Davidson HC, Harnsberger HR, et al. Dumbbell schwannomas of the internal auditory canal. AJNR Am J Neuroradiol 2001;23:1368–1376 [PMC free article] [PubMed] [Google Scholar]
- 10.Dubrulle F, Ernst O, Vincent C, Lejeune JP, Vaneecloo FM, Lemaitre L. Cochlear fossa enhancement at MR evaluation of vestibular schwannoma: correlation with success at hearing preservation surgery. Radiology 2000;215:458–462 [DOI] [PubMed] [Google Scholar]
- 11.Cotten A, Delfaut E, Demondion X, et al. MR imaging of the knee at 0.2 and 1.5 T: correlation with surgery. AJR Am J Roentgenol 2000;174:1093–1097 [DOI] [PubMed] [Google Scholar]
- 12.Gehl HB, Lorch H, Amblank OB, Engerhoff B, Weiss HD. Comparative magnetic resonance imaging of renal space-occupying lesions with a high and low field MRI system. Rofo Fortschr Geb Rontgenstr Neuen Bildgeb Verfahr 1998;169:484–489 [DOI] [PubMed] [Google Scholar]
- 13.Loew R, Kreitner KF, Runkel M, Zoellner J, Thelen M. MR arthrography of the shoulder: comparison of low-field (0.2 T) vs high-field (1.5 T) imaging. Eur Radiol 2000;10:989–996 [DOI] [PubMed] [Google Scholar]
- 14.Tung GA, Entzian D, Green A, Brody JM. High-field and low-field MR imaging of superior glenoid labral tears and associated tendon injuries. AJR Am J Roentgenol 2000;174:1107–1114 [DOI] [PubMed] [Google Scholar]
- 15.Parizel PM, Dijkstra H, Geenen G, et al. Low field versus high field MR imaging of the knee: a comparison of signal behavior and diagnostic performance. Eur J Radiol 1995;19:132–138 [DOI] [PubMed] [Google Scholar]
- 16.Rand T, Imhof H, Turetschek K, et al. Comparison of low field (0.2T) and high field (1.5T) MR imaging in the differentiation of torned from intact menisci. Eur J Radiol 1999;30:22–27 [DOI] [PubMed] [Google Scholar]
- 17.Kreitner KF, Hansen M, Schadmand-Fischer S, Krummenauer F, Runkel M. Low-field MRI of the knee joint: results of a prospective, arthroscopically controlled study. Rofo Fortschr Geb Rontgenstr Neuen Bildgeb Verfahr 1999;17:35–40 [DOI] [PubMed] [Google Scholar]
- 18.Woertler K, Strothmann M, Tombach B, Reimer P. Detection of articular cartilage lesions: experimental evaluation of low- and high-field-strength MR imaging at 0.18 and 1.0 T. J Magn Reson Imaging 2000;11:678–685 [DOI] [PubMed] [Google Scholar]


