

Abstract
PURPOSE: From neuroradiologic experience, it is evident that the adaptation of the ventricular system secondary to pathologic processes or surgery is not uniform. To describe changes entirely, one must consider, in particular, information about volume and shape. In this study, we address specifically the information encoded in the change of shape. To exemplify the technique, we used time-series MR imaging examinations of patients with surgically treated chronic or acute occlusive hydrocephalus.
METHODS: Preoperative and postoperative MR imaging at different time-steps was performed in 2 patients with occlusive hydrocephalus with a different time course of ventricular enlargement. The third and lateral ventricles were segmented with an automated classification scheme. Ventricular surfaces were binarized, mapped to a spheric coordinate system, and modeled by harmonic-basis functions. This approach allows simplification of the complex shape by stepwise filtering of the details that form the surface. The ventricles can be directly compared on the level of the simplified shape.
RESULTS: Although the relative volumetric change was comparable between patients, analysis of shape revealed notable regional differences in the pattern of adaptation. Comparing subacute and chronic hydrocephalus, the analysis reflected fundamental differences in the pattern of ventricular enlargement.
CONCLUSION: In addition to the mere volumetric description, this approach identifies regions that re-adjust differently to the altered pressure. The pattern of re-adaptation depends on the time course and history of the hydrocephalus. Furthermore, the different patterns of ventricular adaptation in patients with chronic or subacute hydrocephalus suggest a contiguity with properties of the surrounding parenchymal tissue.
Quantitative morphologic assessment of individual brain structures in neuroimaging most often includes segmentation followed by volume measurements.1,2 Volume changes are intuitive features that cannot sufficiently reflect structural changes like bending, flattening, or specific regional changes. It is evident from neuroradiologic experience that the adaptation processes of the ventricular system secondary to increase or decrease of intracranial pressure are not uniform.3–5 Hence, a morphologic change must be described by both volumetry and shape composition. Some aspects of the ventricular system show more adaptational capacity than others. One can assume that the ability to change shape composition depends on surrounding parenchymal properties that allow or impede regional adaptations of the ventricles.
3D shape analysis, as presented here, is a mathematic approach that allows mimicking of the pattern of postoperative ventricular adaptation at different time-steps. At what time-step particular regional adaptation processes stop or continue is specifically addressed. This information is expressed in an increased or diminished variance on the ventricular surface. The 2 patients are characterized by a time-series examination: one with a subacute hydrocephalus with a short history and one with a long-standing history of a chronic hydrocephalus. Treatment was an endoscopic third ventriculostomy in either case.
This information on shape analysis is useful for the understanding a time course of adaptation, even if the volumetric change is negligible. To our knowledge, the time course of adaptation has never been visualized in terms of shape composition. Also, we think that the model presented here can contribute to the understanding of parenchymal properties that accompany development and therapy of hydrocephalus and, therefore, lead at discussion.
Methods
MR Examination
A 3D T1-weighted MR image was assessed preoperatively and at different postoperative time-steps. Standard MR imaging protocol consisted of a 3D MDEFT sequence6 on a 3T Bruker MedSpec 30/100 scanner (Bruker, Ettlingen, Germany), followed by sagittal and coronal T2-weighted imaging in a 2-mm thickness to demonstrate flow void phenomena as indirect markers for stoma patency in postoperative imaging. In time-series examinations, the scanning protocol was identical.
Segmentation of the Ventricles
To reconstruct the ventricular surface, we followed a multistep approach: First, 3D T1-weighted MR imaging volumes (192 × 250 × 250) at 1 mm were reoriented to the bicommissural plane and transformed to the standard Talairach stereotactic coordinate system.7 On reorientation, the images were processed for gray-scale normalization and removal of intensity inhomogeneities. A fuzzy C-means algorithm was used to segment the tissue types into gray matter, white matter, and ventricles.8,9 The ventricular surfaces were generated as smooth triangular meshes. On the basis of this procedure of segmentation, infratentorial ventricular system components were removed.
In addition, a volumetric measure of the ventricles was assessed. A region-growing algorithm was applied according to the method described by Hojjatoleslami and Kruggel10 and adapted by Schnack et al.11 The region-growing algorithm produced a count of isotropic voxels of 1-mm3 volume.
Spheric Harmonic Functions
The ventricular surfaces as generated from the segmentation algorithm were binarized and mapped to a spheric coordinate system. The following process of modeling the ventricular systems by harmonic-basis functions can be understood as mathematically simplifying the complex ventricular surface to a simple spheroid geometry, which is the most natural parameterization domain for the ventricular surface.12,13 A single step modifying the surface toward the spheroid is mathematically expressed as a harmony. Each harmony consists of a number of coefficients. Low-order harmonies form the coarse shape; high-order harmonies model subtle superficial changes. Hence, the number of harmonies applied indirectly indicates the complexity of a particular surface (Fig 1). Distinct harmony steps were selected and visualized allowing a direct comparison of the different ventricular systems on the level of the simplified shape.
Fig 1.

3D shape decomposition with spheric harmonic-basis functions. The figure shows the reconstruction of the ventricular surface from order 1 (H1, left upper image) up to order 20 (H20, right lower image). The shape detail is effectively filtered as the number of harmonics is reduced.
Selection and Characterization of Patients
Two patients with hydrocephalus from different causes were sent from the Department of Neurosurgery for preoperative MR imaging and postoperative control at several time-steps. Both patients underwent neurosurgical therapy with endoscopically guided ventriculostomy of the third ventricle.14–16 The decision for this kind of treatment was not based on our MR imaging analysis. Patients gave written informed consent to participate in the study according to institutional rules. Detailed information on patients’ clinical status and MR imaging morphology follows.
Patient 1.
A 28-year-old tiler with intermittent attacks of nausea, vertigo, and headaches underwent cranial MR imaging, which revealed a triventricular hydrocephalus secondary to aqueductal stenosis. Most likely, a recent respiratory infection had triggered an already narrow aqueduct to block. An endoscopic third ventriculostomy was performed to drain CSF into the interpeduncular cistern. Postoperative MR imaging was performed 4 days, 3 months, and 8 months after surgery. The patient recovered from his initial symptoms soon after surgery.
Patient 2.
A 46-year-old dentist complained of progressive nervousness, mnestic deficits, and gait disturbances that had slowly progressed during the past 2 years. Cranial MR imaging showed an enlarged supratentorial ventricular system suggestive of occlusive hydrocephalus. The patient benefitted from a third ventriculostomy, which greatly eased his symptoms. Postoperative scans were obtained 5 days, 4 months, and 13 months after third ventriculostomy.
Results
Figure 2A shows the pre- and second postoperative MR images and the segmented ventricular systems at different time-steps from patient 1. In Fig 2B, the models of the ventricular systems at harmonies 5, 8, and 14 are depicted. When one interprets the images column by column, the differences in variance occur as early as in the first few harmonies. Interestingly, the preoperative condition and the latest postoperative condition have the most similar underlying shape configurations. This finding can be explained by the discrete adaptation processes taking place in the late postoperative course. In contrast, the 2 early postoperative conditions widely differ from the more stable pre- and late postoperative conditions. Harmony steps 5 and 10 reveal extensive differences in the variance in the area of the posterior ventricular horn. Noteworthy, the adaptational configuration is more discrete in the area of the third ventricular floor as the target structure of the ventriculostomy.
Fig 2.
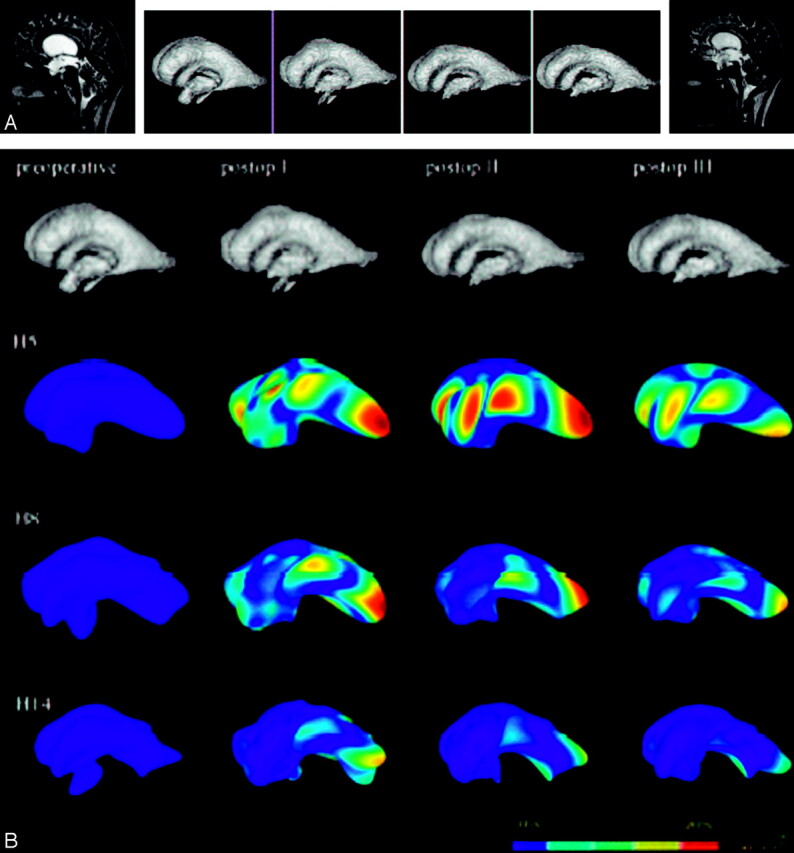
A, Pre- and second postoperative MR images of patient 1 (subacute hydrocephalus, left and right images) and segmented ventricular systems at preoperative and 3 postoperative time-steps (center). The segmented ventricular systems suggest a consecutive decrease in ventricular size (volumetric estimation, 218, 177, 132, 111 mL in the time course, respectively). Successful surgery is also documented by a flow void at the bottom of the third ventricle (right), indicating patency of the stoma.
B, The upper row shows the segmented ventricular systems at the different pre- and postoperative time-steps. The 3 consecutive rows depict the models of the ventricular systems at harmonies 5, 8, and 14, respectively. Color-coding reveals differences in variance to the respective preoperative ventricle. Postoperative adaptational processes are most pronounced in the early postoperative course, whereas later adaptations are discrete. In the more complex harmony steps, the changes are less obvious than those in the simpler ones.
The results in chronic hydrocephalus are quite different (Fig 3A, -B). The variance is smaller, as expected, but also less accentuated in the early postoperative course. The adaptation process is more prolonged than that in subacute hydrocephalus. All readjustment processes can be seen in the early harmony steps, but the longer the postoperative course, the more detailed adaptations are revealed, even in the more complex harmony steps. Interestingly, the spots of variance are less intense than those in subacute hydrocephalus, and they appear to be more widespread throughout the ventricular surface.
Fig 3.
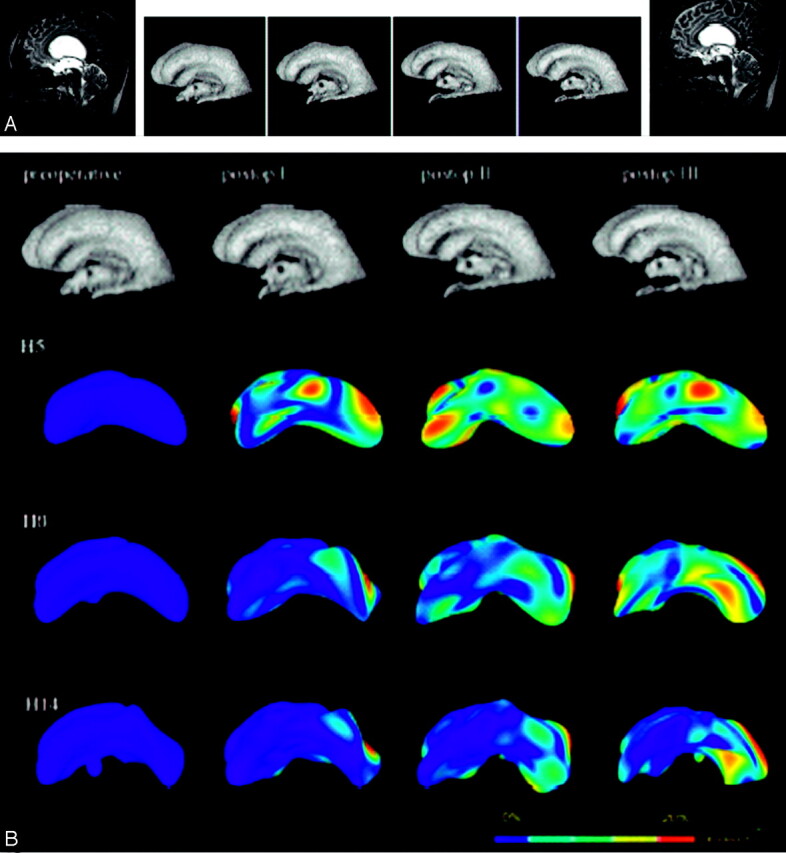
A, Left and right images show pre- and second postoperative MR images of patient 2 (chronic hydrocephalus). Segmented ventricular systems at preoperative and 3 postoperative time-steps are shown in the center. Although the segmented ventricular systems diminished in volume, the change in shape appears discrete (compared to T2-weighted midsagittal MR imaging scans [not shown]). (Volumetric estimation, 170, 128, 106, and 84 mL in the time course, respectively).
B, The adaptational processes are more pronounced in the later postoperative course. The underlying simplified shapes of the ventricles (see harmony 5, Fig. 2B) differ substantially. Most changes occur in the posterior parts of the ventricles. As in the previous case, the changes are less impressive in the more complex harmonics.
Both patients presented here had comparable loss of CSF of approximately 50% from the preoperative to the latest postoperative scan. The dynamics of CSF loss were also comparable with 20% and 25% in the first postoperative MR images, 40% and 38% in the second, and 50% and 51% in the latest postoperative image for subacute and chronic hydrocephalus, respectively.
In summary, the 2 cases show parallel dynamics of volumetric decline in ventricular size, whereas the underlying pattern of adaptation is widely different in terms of the time course, the intensity, and regional preponderance.
Discussion
The key parameter to evaluate successful treatment of hydrocephalus is the radiologic diminishment of the ventricles, aside from clinical improvement. This parameter may be appropriate in cases in which therapy success is obvious and consistent with clinical improvement. Nevertheless, in some cases—as after ventriculostomy in noncommunicating chronic hydrocephalus—the decrease in ventricular size can be minimal, and early postoperative scans may fail to depict changes in size for 3–4 weeks, if at all,5,17perhaps because of the duration of the history of hydrocephalus development. In addition, a flow void signal intensity at the third ventricular floor does not sufficiently indicate successful treatment.15
The understanding of the mechanisms underlying ventricular enlargement and diminishment is crucial and needs an appropriate visualization to serve as a surrogate parameter in radio-morphologic assessment of successful intracranial pressure relief.
From the literature on normal-pressure hydrocephalus, the concepts of ventricular enlargement due to hyperdynamic CSF flow are known.18,19 The current opinion is that the bioelastic limit of the brain is very low, maintaining the ventricular width at a steady state, even if treatment is successfully accomplished.18
Surrogate parameters indicating even subtle regional differences in the adaptation process of the ventricles may aid in our understanding of parenchymal texture properties and could aid in the evaluation of postoperative MR images when the success of ventriculostomy is morphologically questioned.
Our rather theoretic approach is meant to mimic the pattern of re-adaptation by filtering details that form the ventricular surface and reducing the ventricle to a common underlying geometric shape. We exemplified the technique in 2 cases of noncommunicating hydrocephalus. Our data support the observation of the time dependency of adaptation to the history of hydrocephalus development. Additional evidence supports the nonuniform pattern of adjustment after surgical relief of elevated intracranial pressure. The underlying geometry of the ventricles at different time-steps and in the 2 different hydrocephali differs remarkably. Finally, regions with higher variance suggest that some portions of the ventricles have a greater potential to change the configuration than others do—especially secondary to texture properties of the surrounding parenchyma. To our knowledge, the time-course that ventricles go through in their adaptation period has never been visualized with respect to shape.
We are aware that a report on 2 cases cannot sufficiently answer the questions generated but can give only an idea for further discussion of an approach that could be promising or appropriate to visualize shape characteristics. Our data would benefit from a synoptic evaluation with neuropathologic findings in these particular areas and also from a model of the tissue properties—for instance from diffusion tensor imaging—to rethink the mechanism and pattern of ventricular adaptation.
Footnotes
Presented as a scientific poster at the 43rd annual meeting of the American Society of Neuroradiology, Toronto, ON, Canada, April–May 2005.
References
- 1.Schwartz TH, Ho B, Prestigiacomo CJ, et al. Ventricular volume following third ventriculostomy. J Neurosurg 1999;91:20–25 [DOI] [PubMed] [Google Scholar]
- 2.Bandiera P, Pirino A, Conti M, et al. Morphometric analysis of the lateral ventricles in living human. It J Anat Embryol 1996;101:203–09 [PubMed] [Google Scholar]
- 3.Preul C, Tittgemeyer M, Lindner D, et al. Quantitative assessment of parenchymal and ventricular readjustment to intracranial pressure relief. AJNR Am J Neuroradiol 2004;25:377–81 [PMC free article] [PubMed] [Google Scholar]
- 4.Kulkarni AV, Drake JM, Armstrong DC, et al. Imaging correlates of successful endoscopic third ventriculostomy. J Neurosurg 2000;92:915–19 [DOI] [PubMed] [Google Scholar]
- 5.Schwartz TH, Yoon SS, Cutruzzola FW, et al. Third ventriculostomy: post-operative ventricular size and outcome. Minim Invasive Neurosurg 1996;39:122–29 [DOI] [PubMed] [Google Scholar]
- 6.Norris DG. Reduced power multislice MDEFT imaging. J Magn Reson Imaging 2000;11:445–51 [DOI] [PubMed] [Google Scholar]
- 7.Talairach J, Tournoux P. Co-Planar Stereotaxis Atlas of the Human Brain. New York; Thieme;1988
- 8.Tittgemeyer M, Wollny G, Kruggel F. Visualising deformation fields computed by non-linear image registration. Comput Visual Sci 2002;5:45–51 [Google Scholar]
- 9.Wollny G, Kruggel F. Computational cost of non-rigid registration algorithms based on fluid dynamics. IEEE Trans Med Imaging 2002;21:946–52 [DOI] [PubMed] [Google Scholar]
- 10.Hojjatoleslami SA, Kruggel F. Segmentation of large brain lesions. IEEE Trans Med Imaging 2001;20:666–69 [DOI] [PubMed] [Google Scholar]
- 11.Schnack HG, Hulshoff HE, Baare WF, et al. Automatic segmentation of the ventricular system from MR images of the human brain. Neuroimage 2001;14(1 pt 1):95–104 [DOI] [PubMed] [Google Scholar]
- 12.Quicken M, Brechbuehler C, Hug J, et al. Parameterization of closed surfaces for parametric surface description. Computer Vision and Pattern Recognition CVPR 2000;354–60
- 13.Kelemen A, Szekely G, Gerig G. Elastic model-based segmentation of 3-D neuroradiological data sets. IEEE Trans Med Imaging 1999;18:828–39 [DOI] [PubMed] [Google Scholar]
- 14.Wilcock DJ, Jaspan T, Worthington BS, et al. Neuro-endoscopic third ventriculostomy: evaluation with magnetic resonance imaging. Clin Radiol 1997;52:50–54 [DOI] [PubMed] [Google Scholar]
- 15.Goumnerova LC, Frim DM. Treatment of hydrocephalus with third ventriculocisternostomy: outcome and CSF flow patterns. Pediatr Neurosurg 1997;27:149–52 [DOI] [PubMed] [Google Scholar]
- 16.Schroeder HWS, Niendorf WR, Gaab MR. Complications of endoscopic third ventriculostomy. J Neurosurg 2002;96:1032–40 [DOI] [PubMed] [Google Scholar]
- 17.Bellotti A, Rapana A, Iaccarino C, et al. Intracranial pressure monitoring after endoscopic third ventriculostomy: an effective method to manage the ‘adaptation period.’ Clin Neurol Neurosurg 2001;103:223–27 [DOI] [PubMed] [Google Scholar]
- 18.Hakim CA, Hakim R, Hakim S. Normal-pressure hydrocephalus. Neurosurg Clin N Am 2001;12:761–73 [PubMed] [Google Scholar]
- 19.Conner ES, Foley L, Black PM. Experimental normal-pressure hydrocephalus is accompanied by increased transmantle pressure. J Neurosurg 1984;61:322–27 [DOI] [PubMed] [Google Scholar]