

Abstract
BACKGROUND AND PURPOSE: Increases in apparent diffusion coefficient (ADC) from diffusion-weighted (DW) imaging are thought to be due to axonal disruption, and changes have been well documented in multiple sclerosis lesions. DW imaging of the optic nerves, however, presents many challenges. The goal of this study was to measure ADC in patients with optic neuritis by using zonal oblique multisection echoplanar imaging.
METHODS: The optic nerves of eighteen patients who had experienced an attack of optic neuritis 1 year previously and 11 control subjects were imaged with the diffusion sequence (usable data were available from 16 patients and 10 control subjects). The orbital optic nerves were segmented by a blinded observer by using a computer-assisted threshold-based contouring technique, and the mean ADC was determined.
RESULTS: The mean ADC from diseased optic nerves was 1324 × 10−6mm2/s, compared with 990 × 10−6mm2/s from healthy contralateral optic nerves (P = .005 versus diseased optic nerves) and 928 × 10−6mm2/s from control optic nerves (P = .006 versus diseased optic nerves and P = .40 versus healthy contralateral optic nerves). The diseased optic nerve ADC correlated with both visual (e.g., rS = 0.73; P = .001 for logMAR visual acuity) and electrophysiological parameters (e.g., rS = −0.57, P = .021 for visual evoked potential central field amplitude [VEP]).
CONCLUSION: It has been possible to apply DW imaging in a patient population, and, in the chronic phase following optic neuritis, the correlation of mean ADC with the clinical and electrophysiological parameters suggests that the ADC is giving a surrogate measure of axonal disruption in the chronic, postinflammatory optic nerve lesion.
Diffusion of water molecules in vivo is affected by the structure of the tissue. White matter tracts are made up of bundles of tightly packed axons. Diffusion of water occurs preferentially along the orientation of the axons because cell membranes act as barriers to diffusion. Diffusion-weighted (DW) imaging refers to any MR imaging technique that has been made sensitive to the properties of molecular motion. For DW imaging, a spin-echo-based pulse sequence is usually applied both with and without extra magnetic-field-gradient pulses for diffusion encoding (1). The applied gradients do not affect stationary molecules but cause an unrefocused phase shift to molecules that move during the measurement period and hence loss of signal intensity relative to that acquired when no diffusion gradient is applied. The amount of signal intensity loss that can be measured in each voxel is determined by the apparent diffusion coefficient (ADC) in that voxel (so called to acknowledge the effect of hindered or restricted diffusion on the value measured). If white matter tracts are disrupted or the permeability of axonal membranes is increased, the ADC and mean diffusivity (MD), a measure of the average molecular motion, will increase, and the fractional anisotropy (FA), a measure of the directional dependence of the ADC (2), will decrease.
DW imaging therefore has the potential to increase understanding of the pathogenetic mechanisms behind CNS disorders, going beyond the T1 and T2 characteristics. Studies in multiple sclerosis (MS) have revealed increased ADC and MD values and decreased FA values in T1 hypointense lesions compared with T1 isointense lesions, in agreement with the view that the T1 hypointense lesions represent areas of greater tissue loss (3). The situation in gadolinium-enhancing (i.e., acute) lesions is more complex. FA values have been universally lower in enhancing compared with nonenhancing lesions, showing the effects of extracellular edema on the directionality of diffusion (4, 5). The ADC and MD results have been variable, however, possibly because of lesions of different ages being sampled (3), although in all cases the ADC and MD values have been higher than that of surrounding normal-appearing tissue (4, 6).
Optic neuritis is a frequent manifestation of MS and has been regarded as a forme fruste of the disease (7). The natural history of acute optic neuritis mirrors that of an acute MS relapse, and the response to corticosteroid therapy is the same (8). In comparison with single symptomatic lesions elsewhere in the CNS, optic neuritis provides a more attractive model to study the effects of relapses in MS: there are accurate clinical tests of visual function; conduction in the visual pathways can be measured by using VEPs (9); and MR imaging, with appropriate fat-saturation techniques, enables the symptomatic lesion in optic neuritis to be visualized (10). In the rest of the CNS, identification of lesions responsible for individual symptoms can rarely be achieved (11).
DW imaging of the optic nerves presents many challenges, as reported elsewhere (12). The optic nerves are small and mobile, with surrounding CSF and orbital fat. Rapid, high-resolution CSF and fat-saturated single-shot techniques are therefore desirable (13). Nearly all studies to date that have implemented DW imaging in the optic nerve have concentrated on measuring the ADC along a small number of directions (rather than the full diffusion tensor to give FA) because fewer acquisitions are required (12, 14, 15).
For optic nerve DW imaging, we have recently developed a fat- and CSF-suppressed zonal oblique multisection echoplanar imaging (ZOOM-EPI) sequence (12). In a pilot study, ZOOM-EPI DW imaging was carried out on three control subjects. After off-line postprocessing with magnitude signal intensity averaging (and correction for the effects of the Raleigh noise distribution), the mean ADC from the optic nerves, measured as a combination of the x, y, and z direction values, could be calculated over the length of the optic nerves and was found to be 1058 (standard deviation [SD], 101) × 10−6mm2/s.
The current study presents the results of ADC measurements in patients with optic neuritis by using the high-resolution ZOOM-EPI acquisition. The aims of the study were: 1) to investigate whether the ZOOM-EPI sequence could be applied in a clinical setting and to investigate its reproducibility; 2) to investigate whether the ZOOM-EPI sequence could detect changes in ADC following an attack of optic neuritis; 3) to assess the functional significance of any changes measured reference to clinical and electrophysiological parameters; and 4) to assess whether ADC measurements give a better indicator of functionally significant tissue damage following optic neuritis than measures of simple lesion length or of the degree of optic nerve atrophy that have been reported elsewhere (16, 17).
Methods
Eighteen patients were examined 1 year after their first episode of acute unilateral optic neuritis. The diagnosis of acute optic neuritis was based on previously accepted clinical criteria (18). Patients were assessed for the diagnosis of MS according to the Poser criteria (19). Patients with MS were eligible for the study as long as this was their first presentation with optic neuritis. In addition, 11 control subjects were imaged, nine of whom had repeat imaging between 1 and 456 days later so that the acquisition-reacquisition reproducibility could be assessed. Ethical approval was obtained for the study and informed consent in writing was obtained from each subject, in accordance with the Declaration of Helsinki.
Imaging was performed on a 1.5T Signa imager (General Electric, Milwaukee, WI). The optic nerve diffusion protocol consisted of three series of four interleaved sections each, acquired by using the ZOOM-EPI sequence with a spectral-spatial 90° pulse for fat saturation (20) and an inversion recovery prepulse for CSF signal intensity suppression. The 12 × 4 mm contiguous sections were combined into a single data set after reconstruction. The imaging parameters were TR 3400 ms, TE 96.7ms, TI 1160 ms, matrix size 64 × 32, FOV 80 × 40 mm, in-plane resolution 1.25 × 1.25 mm2 with four different diffusion weightings (i.e., b0 = 0, plus bmax = 600 s/mm2 applied sequentially along the three orthogonal axes). A minimum of 40 signal intensity averages were collected for off-line averaging; during imaging, subjects were asked to close their eyes and to avoid any deliberate eye movements. Each individual magnitude image at low signal-to-noise ratio is characterized by Rayleigh noise distribution, with a nonzero mean, which would introduce a bias in the measured signal intensity after simple magnitude averaging. By using a further series of images, acquired with the same sequence but with the excitation pulse turned off, it was possible to estimate the absolute noise level and correct for this signal intensity bias (12, 21). The total acquisition time for the above was 28 minutes. The resultant magnitude images were averaged off line after reconstruction with Rayleigh noise correction. A noise-reduction algorithm that preserved structure was also applied to improve the signal-to-noise ratio before calculating the ADC (22). The data were then processed to determine the ADC on a pixel-by-pixel basis for each of the 12 sections.
In addition, the patients (but not control subjects) also had their optic nerves imaged with a dual echo fast spin-echo (FSE) sequence (coronal-oblique, TR, 2300 ms; TEeffective, 58/145 ms; echo-train length, 8; NEX, 2; matrix size, 512 × 384; FOV, 24 × 18 cm; in-plane resolution, 0.5 × 0.5 mm; 16 × 3 mm interleaved contiguous sections; 11-minute acquisition time) and a fat-saturated short echo time fast fluid-attenuated inversion recovery (sTE fFLAIR) sequence (coronal-oblique, TR, 2740 ms; TE, 16 ms; TI, 1072 ms; NEX, 6; echo train length, 6; matrix size, 512 × 384; 24 × 18 cm FOV; in-plane resolution, 0.47 × 0.47 mm; 3-mm interleaved contiguous sections; acquisition time, 13.5 minutes). An experienced radiologist (K.A.M.), blinded to the lesion side and severity of visual loss, identified and measured the length of the lesion on the FSE images.
Figure 1 shows images produced from one orbital section in a patient from the nondiffusion weighted (b = 0) images, the ADC maps and, for comparison, the FSE and sTE fFLAIR sequences.
Fig 1.
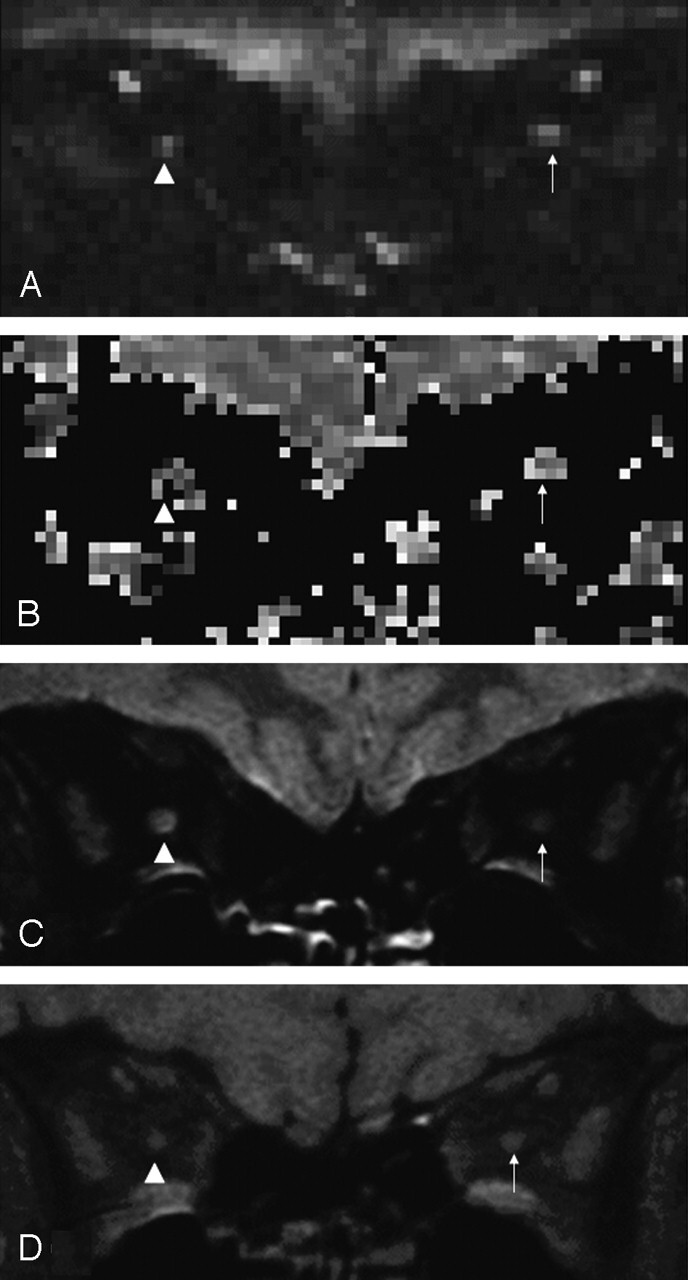
Orbital images from a 36-year-old woman 1 year after right-sided optic neuritis. Diseased optic nerve indicated by arrowhead, and contralateral healthy optic nerve indicated by arrow.
A, Nondiffusion weighted (b = 0) image.
B, ADC map.
C, FSE image demonstrating high signal intensity lesion in the right optic nerve.
D, sTE fFLAIR image demonstrating right optic nerve atrophy.
The patients were then examined clinically and electrophysiologically. Best visual acuity with appropriate spectacle or pinhole correction was measured by using a retroilluminated ETDRS chart and recorded as the 4-m logMAR acuity (23). The central 30° of the visual field was analyzed by using the 30–2 program on the Humphrey field analyzer (Allergan-Humphrey, San Leandro, CA). Wide-angle lenses were used to correct refractive errors where necessary. The overall field mean deviation was compared with a reference field derived from control data provided by the manufacturer. Color vision was measured by using the Farnsworth-Munsell 100 hue test, scored as square root of the error score (24). These parameters were chosen because they give continuously variable measures that are amenable to statistical analysis. Whole-field and central-field pattern-reversal VEPs were also measured on each patient (25).
The diffusion-weighted images were processed and analyzed on Unix workstations (Sun Microsystems, Mountain View, CA). ADC maps were calculated by using “in-house” software; all images were displayed and analyzed by using the DispImage display tool (26). The orbital optic nerves (from four sections) were segmented by a blinded observer, from the nondiffusion-weighted (b = 0) images, to avoid bias, by using a computer-defined threshold-based contouring technique. Unlike previous studies (eg, Iwasawa et al [15]), the size of each region of interest was allowed to vary between section positions and subjects. The orbital portion was selected because the intracanalicular optic nerve could not always be reliably identified, because of susceptibility induced artifacts from the adjacent bone and air-filled sinuses and it was not possible to reliably segment the intracranial optic nerve from the brain. The four regions of interest created for each optic nerve were automatically transferred to the Rayleigh noise-corrected ADC maps, and the mean ADC from the four sections was determined (Fig 2). The measurements were repeated twice on different days to determine the measure-remeasure reproducibility.
Fig 2.

Scatter graph showing ADCs for diseased optic nerves 1 year after acute optic neuritis, healthy contralateral optic nerves, and control optic nerves.
Four of the sets of images were excluded from further analysis. One patient data set, one baseline control data set, and one reacquisition control data set were excluded because the ADC could not be determined on all of the prescribed sections due to partial volume or motion effects. One patient data set was excluded because of unusually high mean ADC values from both diseased and healthy optic nerves (approximately twice the expected values). This left 10 control data sets (seven male subjects, three female subjects; median age, 34 years; range, 21–59 years; seven with reimaging) and 16 patient data sets (six male subjects, 10 female subjects; median age, 37 years; range, 25–54 years; including two who were imaged at baseline; imaged a median 370.5 days from onset of visual symptoms; range, 365–396 days). Two of these patients had recurrent optic neuritis in the contralateral eye in the preceding year (the data sets for the healthy optic nerves from these two patients were therefore excluded from further analysis), two had clinically definite MS, one had clinically probable MS, and the rest had clinically isolated optic neuritis.
The mean cross-sectional area of the intraorbital portion of each optic nerve was calculated by the same blinded observer from five consecutive 3-mm sections anteriorly from the orbital apex from the sTE fFLAIR images by using a computer-assisted contouring technique as reported elsewhere (16).
Statistical Analysis
Statistical analysis was performed by using the SPSS 9.0 for Windows statistical package (SPSS Inc., Chicago, IL). To assess measurement and acquisition-reacquisition reproducibility the within- and between-subject SD, and hence, coefficient of variation and reliability coefficients were obtained from random effects analysis of variance (27–29). Paired and independent samples t tests were used for the group analyses as appropriate. Analysis of correlations was by Spearman’s rank correlation.
Results
The analysis-reanalysis and image-reimage reproducibility results are given in Table 1.
TABLE 1:
ADC measurement reproducibility for the different subgroups
| Variable | Mean (×10−6 mm2/s) | Within-Subject SD | 95% Reference Rangea | CV (%)b | Reliability Coefficientc |
|---|---|---|---|---|---|
| Analysis/re-analysis: | |||||
| Control mean (n = 10) | 928 | 23 | ±45 | 2.5 | 0.99 |
| Diseased optic nerves (n = 16) | 1324 | 97 | ±189 | 7.3 | 0.94 |
| Healthy contralateral optic nerves (n = 14) | 990 | 31 | ±61 | 3.2 | 0.96 |
| Image/reimage: | |||||
| Control mean (n = 7) | 946 | 95 | ±186 | 10.0 | 0.58 |
1.96 × within-subject SD; 95% of measurements are expected to lie within this departure from the true value.
CV, coefficient of variation.
The proportion of total variance due to between-subject variation. Under assumptions that are plausible here, 1 minus this value is the proportion of variation due to measurement error.
The mean ADC from diseased optic nerves was 1324 (SD 379) × 10−6 mm2/s, compared with 990 (SD 159) × 10−6 mm2/s from healthy contralateral optic nerves (P = .005 versus diseased optic nerves) and 928 (SD 196) × 10−6 mm2/s from control optic nerves (P = .006 versus diseased optic nerves and P = .40 versus healthy contralateral optic nerves; Fig 2).
The associations between the diseased optic nerve ADC and the clinical and electrophysiological parameters are given in Table 2. The association between logMAR visual acuity and diseased optic nerve ADC and is illustrated in Figure 3, and the association between VEP central field amplitude and diseased optic nerve ADC is illustrated in Figure 4.
TABLE 2:
Association between diseased optic nerve ADC and clinical and electrophysiologic measurements
| SRCC | P Value | |
|---|---|---|
| logMAR visual acuity | 0.73 | 0.001 |
| 30-2 Humphrey mean deviation (dB) | −0.80 | <0.001 |
| FM 100 Hue square root of error score | 0.83 | <0.001 |
| VEP whole-field amplitude (μV) | −0.64 | 0.008 |
| VEP whole-field latency (ms) | 0.58 | 0.019 |
| VEP central-field amplitude (μV) | −0.57 | 0.021 |
| VEP central-field latency (ms) | 0.58 | 0.019 |
Note.—FM 100 Hue, Farnsworth Munsell 100 Hue test; SRCC, Spearman’s rank correlation coefficient; VEP = visual evoked potentials.
Fig 3.

Association between logMAR visual acuity and diseased optic nerve ADC (rS = 0.73; P = .001).
Fig 4.

Association between 1-year VEP central field amplitude and diseased optic nerve ADC (rS = −0.57, P = .021).
The mean area of diseased optic nerves from the sTE fFLAIR images was 11.1 mm2 (SD 2.3) compared with 12.7 mm2 (SD 1.7) for healthy contralateral optic nerves (P = .063). In contradistinction with the significant correlations seen with ADC (Table 2), there was no significant association between the FSE lesion lengths and optic nerve mean areas and any of the clinical and electrophysiological parameters. There was a modest association between diseased optic nerve ADC and FSE lesion length (rS = 0.52; P = .04) but not with optic nerve mean area.
Discussion
By using the zoom-EPI sequence, it has been possible to apply DW imaging to the optic nerves in a patient population. The protocol is time consuming, requiring three acquisitions of four sections each and a separate noise acquisition. Off-line averaging of the data in the image domain, including Rayleigh noise correction, is also needed to compensate for optic nerve motion between successive single-shot acquisitions. The total acquisition time is about 28 minutes per subject. The resulting b = 0 images allowed the optic nerve to be identified and segmented from four 4-mm sections in the orbit in most subjects (Fig 1). The intracanalicular optic nerve could not be identified in many of the subjects because of susceptibility artifacts, and it was not possible to segment the intracranial optic nerve reliably from the brain because of the relatively low resolution. The measurement reproducibility figures are comparable with previous studies measuring atrophy in the optic nerves (16, 30).
Iwasawa et al (15) studied the optic nerves with a spin-echo sequence that had low diffusion weighting (b-factor, 262.05 s/mm2) and cardiac gating for a single section through the orbital optic nerve. Three acquisitions were performed with the diffusion gradients in the x, y, and z directions, respectively. Because of motion artifacts, the ADC could be measured only in the y and z directions, and then not always reliably. The ADC was measured from a 1-mm-diameter circular region of interest placed in the center of the nerve. In seven control subjects, the mean ADC was 982 (SD 741) × 10−6 mm2/s in the y direction and 1559 (SD 675) × 10−6 mm2/s in the z direction. In four nerves with acute optic neuritis the mean ADC was 843 (SD 742) × 10−6 mm2/s in the y direction and 941 (SD 431) × 10−6 mm2/s in the z direction. In nine nerves with previous optic neuritis the mean ADC was 1560 (SD 690) × 10−6 mm2/s in the y direction and 4180 (SD 1130) × 10−6 mm2/s in the z direction (P < .001 versus control subjects and acute optic neuritis).
The results presented here with a higher resolution sequence over more sections suggest that mean ADC of the control subjects and of the healthy contralateral eyes is much more similar to the ADC of white matter in the brain than previous results have suggested (14, 15). One year after an attack of optic neuritis, the mean ADC was significantly increased compared with the contralateral healthy optic nerves and control optic nerves. The association between the mean ADC and the clinical and electrophysiologic parameters suggests that the increase in mean ADC may be due to disruption of functional neural channels in the optic nerve, probably due to a combination of axonal damage, caused by the acute inflammatory lesion with subsequent Wallerian degeneration, and demyelination. The lack of significant association between the lesion length on the FSE images and optic nerve mean area on the sTE fFLAIR images and the clinical and electrophysiologic measures supports the view that DW imaging is giving more information about functionally relevant pathologic change in the ultrastructure of the optic neuritis lesion than that obtained from these other measures.
The question remains whether some of the increase in ADC measured in the diseased optic nerves may be due to the increased influence of partial volume voxels in the region of interest that will occur with optic nerve atrophy because the surface area-volume ratio will have increased. The mean decrease in optic nerve area, however, was small (∼13%) and the images were CSF- and fat-suppressed, as can be seen from Figure 1 (A and B), limiting the possibility that partial volume voxels were influencing the result. Also of note was the lack of correlation between optic nerve mean area and ADC, which suggests that tissue destruction causing optic nerve atrophy was not influencing ADC, possibly because of optic nerve demyelination, which allows nerve conduction, having a larger influence on changes in nerve size than axonal loss, which will cause irreversible loss of function. ADC may be more sensitive to axonal loss. The modest correlation observed between lesion length and mean ADC may indicate that longer lesions are prone to be associated with more tissue disruption, although a simple measure of the lesion length per se is insufficient to explain the functional deficits measured.
In future studies, methodologic improvements are needed. Higher resolution sequences would lessen the potential impact of partial volume voxels. It would also be desirable to obtain the full diffusion tensor as this gives a better indicator of the cellular integrity than ADC. To do these things in the optic nerves with adequate fat and CSF suppression, in light of the present sequences and imaging technology, however, would require much longer imaging times or less coverage of the optic nerve.
Chabert et al (31) recently developed an axial FSE acquisition that could measure both ADC and FA in individual optic nerves. In four volunteers, the mean diffusivity was 1670 (SD, 450) × 10−6 mm2/s with a mean FA of 0.59 (SD, 0.08), reflecting strong anisotropy in the optic nerve. The fiber directions followed the expected nerve fiber directions on anisotropy maps. The sequence was free of susceptibility artifacts, although it was neither fat- nor CSF-suppressed, and so the results should be interpreted with caution.
We are currently working to develop fat- and CSF-suppressed diffusion tensor imaging in the optic nerve. Preliminary results over a single coronal section in a normal subject have been encouraging with an FA value of 0.62 (SD, 0.005), comparable with the above study and studies in the white matter of the brain (32). Future developments to increase resolution and coverage may require higher gradient strengths or parallel imaging.
Conclusion
This study has shown that it is possible to apply DW imaging in a patient population to give quantitative measures of ADC and, in the chronic phase following optic neuritis, the mean ADC correlated with clinical and electrophysiologic parameters. This suggests that the ADC is giving a surrogate measure of functionally relevant axonal pathway disruption in the postinflammatory chronic nerve lesions following optic neuritis. At present, the long acquisition time of the DW imaging sequence will limit its use in clinical practice, but DW imaging may be of use in the study of novel treatments that aim to prevent axonal damage in patients with optic neuritis.
Footnotes
Supported by the Wellcome Trust. The NMR Research Unit and C.W.K. are supported by the Multiple Sclerosis Society of Great Britain and Northern Ireland, which also supported G.J.B. at the time of this study.
References
- 1.Stejskal EO, Tanner JE. Spin diffusion measurements: spin echoes in the presence of a time-dependent field gradient. J Chem Phys 1965;42:288–292 [Google Scholar]
- 2.Basser PJ, Mattiello J, LeBihan D. MR diffusion tensor spectroscopy and imaging. Biophys J 1994;66:259–267 [DOI] [PMC free article] [PubMed] [Google Scholar]
- 3.Filippi M, Inglese M. Overview of diffusion-weighted magnetic resonance studies in multiple sclerosis [Suppl 1]. J Neurol Sci 2001;186:S37–S43 [DOI] [PubMed] [Google Scholar]
- 4.Werring DJ, Clark CA, Barker GJ, et al. Diffusion tensor imaging of lesions and normal-appearing white matter in multiple sclerosis. Neurology 1999;52:1626–1632 [DOI] [PubMed] [Google Scholar]
- 5.Filippi M, Cercignani M, Inglese M, et al. Diffusion tensor magnetic resonance imaging in multiple sclerosis. Neurology 2001;56:304–311 [DOI] [PubMed] [Google Scholar]
- 6.Roychowdhury S, Maldjian JA, Grossman RI. Multiple sclerosis: comparison of trace apparent diffusion coefficients with MR enhancement pattern of lesions. AJNR Am J Neuroradiol 2000;21:869–874 [PMC free article] [PubMed] [Google Scholar]
- 7.Ebers GC. Optic neuritis and multiple sclerosis. Arch Neurol 1985;42:702–704 [DOI] [PubMed] [Google Scholar]
- 8.Brusaferri F, Candelise L. Steroids for multiple sclerosis and optic neuritis: a meta-analysis of randomized controlled clinical trials. J Neurol 2000;247:435–442 [DOI] [PubMed] [Google Scholar]
- 9.Halliday AM, McDonald WI, Mushin J. Delayed pattern-evoked responses in optic neuritis in relation to visual acuity. Trans Ophthalmol Soc U K 1973;93:315–324 [PubMed] [Google Scholar]
- 10.Gass A, Moseley IF, Barker GJ, et al. Lesion discrimination in optic neuritis using high-resolution fat- suppressed fast spin-echo MRI. Neuroradiology 1996;38:317–321 [DOI] [PubMed] [Google Scholar]
- 11.Behan CMH, Hickman SJ, Scolding NJ, et al. Identification of the clinically symptomatic lesion in multiple sclerosis: implications for remyelination therapy [Suppl 3]. Rev Neurol (Paris) 2000;156:S28 ; abstract presented at the 16th Congress of ECTRIMS, Toulouse, France, 2000 [Google Scholar]
- 12.Wheeler-Kingshott CA, Parker GJ, Symms MR, et al. ADC mapping of the human optic nerve: increased resolution, coverage, and reliability with CSF-suppressed ZOOM-EPI. Magn Reson Med 2002;47:24–31 [DOI] [PubMed] [Google Scholar]
- 13.Barker GJ. Technical issues for the study of the optic nerve with MRI [Suppl 1]. J Neurol Sci 2000;172:S13–S16 [DOI] [PubMed] [Google Scholar]
- 14.Freeman AJ, Ballinger R, Werner M, Guy J. Diffusion weighted EPI of the human optic nerve at 3T. Proc Intl Soc Mag Reson Med 1998;6:1265 ; abstract presented at the 6th Annual Meeting of ISMRM, Sydney, Australia, 1998 [Google Scholar]
- 15.Iwasawa T, Matoba H, Ogi A, et al. Diffusion-weighted imaging of the human optic nerve: a new approach to evaluate optic neuritis in multiple sclerosis. Magn Reson Med 1997;38:484–491 [DOI] [PubMed] [Google Scholar]
- 16.Hickman SJ, Brex PA, Brierley CMH, et al. Detection of optic nerve atrophy following a single episode of unilateral optic neuritis by MRI using a fat-saturated short-echo fast FLAIR sequence. Neuroradiology 2001;43:123–128 [DOI] [PubMed] [Google Scholar]
- 17.Inglese M, Ghezzi A, Bianchi S, et al. Irreversible disability and tissue loss in multiple sclerosis: a conventional and magnetization transfer magnetic resonance imaging study of the optic nerves. Arch Neurol 2002;59:250–255 [DOI] [PubMed] [Google Scholar]
- 18.Compston DA, Batchelor JR, Earl CJ, McDonald WI. Factors influencing the risk of multiple sclerosis developing in patients with optic neuritis. Brain 1978;101:495–511 [DOI] [PubMed] [Google Scholar]
- 19.Poser CM, Paty DW, Scheinberg L, et al. New diagnostic criteria for multiple sclerosis: guidelines for research protocols. Ann Neurol 1983;13:227–231 [DOI] [PubMed] [Google Scholar]
- 20.Block W, Pauly J, Kerr A, Nishimura D. Consistent fat suppression with compensated spectral-spatial pulses. Magn Reson Med 1997;38:198–206 [DOI] [PubMed] [Google Scholar]
- 21.Miller AJ, Joseph PM. The use of power images to perform quantitative analysis on low SNR MRI images. Magn Reson Imaging 1993;11:1051–1056 [DOI] [PubMed] [Google Scholar]
- 22.Parker GJM, Schnabel JA, Symms MR, et al. Nonlinear smoothing for reduction of systematic and random errors in diffusion tensor imaging. J Magn Reson Imaging 2000;11:702–710 [DOI] [PubMed] [Google Scholar]
- 23.Ferris FL III, Kassoff A, Bresnick GH, Bailey I. New visual acuity charts for clinical research. Am J Ophthalmol 1982;94:91–96 [PubMed] [Google Scholar]
- 24.Farnsworth D. The Farnsworth-Munsell 100-hue and dichotomous tests for color vision. J Opt Soc Am 1943;33:568–578 [Google Scholar]
- 25.Brusa A, Jones SJ, Plant GT. Long-term remyelination after optic neuritis: a 2-year visual evoked potential and psychophysical serial study. Brain 2001;124:468–479 [DOI] [PubMed] [Google Scholar]
- 26.Plummer DL. DispImage: a display and analysis tool for medical images. Rivista Neuroradiol 1992;5:489–495 [Google Scholar]
- 27.Bland JM, Altman DG. Measurement error and correlation coefficients. Br Med J 1996;313:41–42 [DOI] [PMC free article] [PubMed] [Google Scholar]
- 28.Bland JM, Altman DG. Measurement error proportional to the mean. Br Med J 1996;313:106. [DOI] [PMC free article] [PubMed] [Google Scholar]
- 29.Bland JM, Altman DG. Measurement error. Br Med J 1996;313:744. [DOI] [PMC free article] [PubMed] [Google Scholar]
- 30.Hickman SJ, Kapoor R, Jones SJ, et al. Corticosteroids do not prevent optic nerve atrophy following optic neuritis. J Neurol Neurosurg Psychiatry 2003;74:1139–1141 [DOI] [PMC free article] [PubMed] [Google Scholar]
- 31.Chabert S, Molko N, Cointepas Y, et al. “Functional” diffusion tensor imaging of the optic nerve using a non-CPMG fast spin echo sequence. Proc Intl Soc Mag Reson Med 2002;10:1115 ; abstract presented at the 10th Annual Meeting of ISMRM, Honolulu, 2002 [Google Scholar]
- 32.Wheeler-Kingshott CA, Trip A, Symms MR, et al. In vivo anisotropy and diffusivity of the optic nerve: pilot study. Proc Intl Soc Mag Reson Med 2004;11:2471 ; abstract presented at the 12th Annual Meeting of ISMRM, Kyoto, 2004 [Google Scholar]