

Abstract
BACKGROUND AND PURPOSE: Gliomas are heterogeneous tumors with increased microvasculature, hypoxia, and necrosis. The purpose of this study was to examine the distribution and relationship of the MR-derived relative cerebral blood volume (rCBV), lactate (Lac), and mobile lipids (Lip), which have been proposed as markers for these phenomena of gliomas in vivo.
METHODS: Twenty-three patients with newly diagnosed gliomas were examined before surgical biopsy and/or resection (seven grade II, five grade III, and 11 grade IV), and 27 patients were studied after surgery but before radiation treatment and/or chemotherapy (11 grade II, two grade III, and 14 grade IV gliomas). Lac and Lip were estimated from Lac-edited three-dimensional MR spectroscopic images. Dynamic susceptibility–contrast MR imaging was applied to obtain perfusion-weighted images and rCBV maps.
RESULTS: Before surgical biopsy/resection, one low-grade and 12 of 16 high-grade gliomas had significantly elevated Lac. No low-grade and 10 of 16 high-grade gliomas had significantly elevated Lip. In presurgical high-grade gliomas, volumes of elevated Lip and macronecrosis were significantly correlated. rCBV was significantly increased in regions with elevated Lac. After we excluded macronecrosis, the rCBV for regions with elevated Lip but no Lac was significantly higher than rCBV in regions with elevated Lac but no Lip. After surgical biopsy/resection, more low-grade patients showed significantly elevated Lac and Lip than before.
CONCLUSION: The in vivo distribution of rCBV, Lac, and Lip, as evaluated with three-dimensional MR spectroscopic imaging, may help in the diagnosis and selection of the most appropriate therapy for patients with gliomas.
It is widely accepted that neoplastic transformation entails major biochemical changes, including modifications in energy metabolism. With increasing tumor growth, the patient’s respiratory capacity decreases, and the reliance on glycolysis for energy production increases in tumors (1). Evaluation of cellular metabolic activities in human tumor tissue has the potential to improve diagnosis and guide treatment planning and monitoring of tumors. In particular, assessment of the level of oxygenation has been of increasing interest because hypoxia in tumors is a predictor of a poor response to radiation therapy and chemotherapy, the metastatic spread of a tumor, and generally aggressive disease (2, 3).
MR spectroscopic techniques can be applied to noninvasively study the bioenergetics and metabolism in tumor tissues. In brain tumors, increased resonance of choline and choline-containing compounds (Cho) at 3.2 ppm and decreased or diminished resonances of N-acetylaspartate (NAA) at 2.0 ppm have been observed in numerous studies (4–9). Two other peaks that have been observed in brain tumors are lactate (Lac) at 1.33 ppm and mobile lipids (Lip), with its most prominent peaks at 0.9 and 1.3 ppm. Lac is the end product of the nonoxidative glycolysis, and therefore, its presence may be correlated with poor oxygenation levels or hypoxia in the tumor tissue (10, 11). The presence of Lip has been correlated with necrosis in which cells die and membranes break down (12). In gliomas, Lip peaks are mostly observed in high-grade tumors, particularly in glioblastoma multiforme ([GBM], grade IV) (13), whereas the relationship between Lac and tumor grades remains elusive (6, 9, 14).
In the conventional MR spectroscopic acquisition, Lac and Lip peaks overlap within the region from 0.9 to 1.3 ppm. Spectral editing is therefore necessary to reliably detect the intensity of these two metabolites. Methods based on J-difference editing allow for the distinction between coupled and uncoupled spins and achieve full sensitivity of the Lac doublet (15). This class of techniques needs two acquisition cycles per phase-encoding step, and the total acquisition time is generally too long for clinical applications. A reduced k-space sampling technique is therefore beneficial to reduce the acquisition time to be practical for patient studies.
Changes in hemodynamic parameters are other important factors that affect the metabolism and oxygenation levels in tumor tissue. Tumor hypoxia is closely related to insufficient blood flow caused by chaotic and partially nonfunctional tumor vasculature (16). Perfusion-weighted MR imaging has been developed to noninvasively access the vascular characteristics of tumors after the administration of intravenous contrast agents (17, 18). With T2- or T2*-weighted echo-planar imaging, changes in signal intensity with the passage of an intravascular paramagnetic contrast agent can be calculated on a pixel-by-pixel basis. The resulting relative cerebral blood volume (rCBV) map is correlated with the histopathologic findings, including mitotic activity and microvascular attenuation (18, 19).
The goals of presented study were to explore a practical and robust method to evaluate the in vivo distribution of Lac and Lip and to study their relationship with MR-derived rCBV, because these three parameters have been proposed as markers of hypoxia, necrosis, and angiogenesis in gliomas.
Methods
Patient Population
Twenty-three patients with newly diagnosed gliomas were examined before surgical biopsy and/or resection, and 27 patients were examined after surgical biopsy/resection but before radiation treatment and/or chemotherapy. (Eleven of the patients were examined both before and after surgery.) The presurgical data were typically acquired 1 day before surgery. The postsurgical data were acquired before radiation treatment (high-grade tumors) or chemotherapy (low-grade tumors), which was generally 2–3 weeks after surgery. Tissue samples obtained during surgical resection or open biopsy were graded during histologic examination by using World Health Organization II criteria. For the presurgical data, seven patients had grade II tumors (one astrocytoma, five oligodendrogliomas, and one mixed), five had grade III tumors (three anaplastic astrocytomas, two anaplastic oligodendrogliomas), and 11 had grade IV tumors (all GBM). For the postsurgical data, 11 patients had grade II tumors (five astrocytomas, four oligodendrogliomas, and two mixed), two had grade III tumors (one anaplastic astrocytoma, one anaplastic oligodendroglioma), and 14 had grade IV tumors (all GBM). All patients provided informed consent, as approved by the Committee on Human Research at our institution.
MR Imaging and Spectroscopic Imaging
MR data were acquired by using a 1.5-T unit (Signa Echospeed; GE Medical Systems, Milwaukee, WI) with a standard quadrature head coil. The protocol consisted of anatomic imaging, perfusion-weighted imaging, and spectroscopic imaging.
Anatomic Imaging
The imaging protocol included T1-weighted sagittal scout imaging (TR/TE = 400/12), axial fluid-attenuated inversion recovery imaging (TR/TE/TI = 10000/143/ 2200, 220 × 220 × 160 mm field of view [FOV] with a 256 × 256 × 32 matrix), axial T2-weighted fast spin-echo imaging (TR/TE = 3000/105, 260 × 260 × 180 mm FOV with 256 × 256 × 120 matrix), and pre- and post-contrast T1-weighted volume spoiled gradient-echo imaging (SPGR; TR/TE = 27/6, 40° flip angle, 180 × 240 × 186 mm FOV with a 192 × 256 × 124 matrix).
Perfusion-Weighted Imaging
A bolus of contrast material (0.1 mmol/kg body weight) was rapidly injected into the antecubital vein at a rate of 4–5 mL/second. Dynamic susceptibility contrast echo-planar, gradient-echo images were acquired before, during, and after the bolus injection. Parameters for perfusion-weighted imaging were TR/TE = 1250/54, bandwidth = 120 KHz, FOV = 260 × 260 with a 128 ×128 matrix resulting an in-plane resolution of 2 × 2 mm, seven or eight sections with section thickness of 4 mm, and a total of 60 time points.
Spectroscopic Imaging
Three-dimensional (3D), J-difference, Lac-edited MR spectroscopic imaging data were obtained by using a point-resolved spectral selection (PRESS) technique incorporated with dual band-selective inversion with gradient-dephasing pulses previously developed in our laboratory (15), with TR/TE = 1000/144. Chemical shift selective saturation, or CHESS, pulses were applied for water suppression. Very selective saturation, or VSS, pulses were applied for outer volume suppression to provide a sharper PRESS-selected volume and to reduce chemical-shift misregistration effects compared with conventional techniques (20).
The PRESS-selected volume was in the range of 200–300 cm3. The excitation box was positioned to cover as much of the lesion as possible and to include contralateral normal tissue as a reference for postprocessing and analysis while avoiding bone, subcutaneous fat, and other materials that could complicate shimming and water suppression. The phase encoding matrix was 12 × 12 × 8 or 16 × 8× 8 with FOVs of 120 × 120 × 80 and 160 × 80 × 80 mm, respectively. Ellipsoidal k-space sampling was implemented, and the radius of the ellipsoid was set to cut the acquisition time to approximately one-half of that for full rectangular sampling (20 minutes) (21). Table 1 presents the acquisition times and signal-to-noise ratios (SNRs) obtained in experiments on phantoms and in volunteers. The SNR was approximately 1.2 times that of a normal acquisition. By using the equation SNR ∝  · ΔX, with assumptions that all the other conditions were similar, this result suggested that the nominal voxel size with an elliptical acquisition would be approximately 1.7 times that of the rectangular acquisition.
TABLE 1:
Acquisition times and SNRs in phantoms and volunteers
| Acquisition | Time (min:sec) | SNR |
|---|---|---|
| Phantom | ||
| Cubic | 38:24 | 53.85 |
| Ellipsoidal | 17:12 | 65.53 |
| Volunteer | ||
| Cubic | 38:24 | 13.77 |
| Ellipsoidal | 17:12 | 15.69 |
The imaging and spectral data were transferred to a workstation (Sun Microsystems, Palo Alto, CA) for off-line postprocessing.
MR Data Postprocessing
The 3D MR spectroscopic images were referenced to the postcontrast 3D SPGR image acquired just before the spectroscopic sequence was performed during the same examination. The assumption was that patient movement between the acquisitions was negligible. The remaining MR images were aligned to the 3D SPGR image so that the spectroscopic image was registered with all of the images.
The summed and difference spectra from the two acquisition cycles were automatically quantified by using software developed in our laboratory (22). Relative levels of Cho, Cr, NAA, and Lip were estimated from the summed spectra at 3.2, 3.0, 2.0, and 1.3 ppm, respectively. The correction parameters for baseline, phase, and frequency from the summed spectra were applied to the difference spectra, and the level of the Lac doublet was estimated by using the peaks at 1.3 ppm. The 3D metabolic images of Lac and Lip were resampled with sinc interpolation to have the same pixel size as that of the MR images. Lac and Lip peaks with a height more than four times the standard deviation (SD) for noise were considered significantly elevated. Contour plots of the significantly elevated Lac and Lip values were automatically created by using the resampled Lac and Lip images, respectively. The contours of morphologic abnormalities, namely, the T2 hyperintensity, contrast enhancement, and marconecrosis (defined as hypointense regions within contrast enhancement on enhanced T1-weighted images) were manually drawn on the basis of the MR images. Volumes of these metabolic and morphologic abnormalities were calculated by using software developed in our laboratory and written in the Interactive Data Language (RSI, Boulder, CO). The spatial relationship between the morphologic and metabolic abnormalities was also studied. The coincidence of the morphologic and metabolic abnormalities was defined as at least one spectral voxel with significantly elevated Lac or Lip value within a certain morphologic abnormality (T2 hyperintensity, contrast enhancement, marconecrosis, or resection cavity).
The perfusion-weighted images were analyzed as described in a previous publication (23) to produce parametric maps of the rCBV. The map was then resampled to have the same FOV and section center as those of the anatomic images acquired in the same examination. The contours for significantly elevated Lac and Lip were overlaid on the rCBV maps. A radiologist (S.C.) who was blinded to the identification of the contours at that time drew three to six small regions of interest (ROIs) within the Lac and Lip contours. Macrovessels, choroid plexus, and regions with macronecrosis were avoided. The rCBV was measured within these small ROIs, and the maximum and mean level of rCBV within the Lac and Lip contours were calculated. A t test was applied to study the difference in rCBV between regions with elevated Lac and those with elevated Lip, with a significant level ∝ = 0.05. Spearman rank correlation was performed for the relationship between volumes of morphologic abnormalities and volumes of elevated Lac and Lip.
Results
Presence and Volumes of Elevated Lac and Lip Levels
According to the data obtained before surgical biopsy/resection, one (14.3%) of seven grade II tumors, three (60.0%) of five grade III tumors, and nine (81.8%) of 11 grade IV tumors had significantly elevated Lac values. No grade II tumor, one (20.0%) grade III tumor, and nine (81.8%) grade IV tumors had significantly elevated Lip values. One grade III and seven grade IV tumors had both elevated Lac and Lip values.
According to the data obtained after surgical biopsy/resection but before radiation treatment and/or chemotherapy, four (36.4%) of 11 grade II tumors, no grade III tumors, and 11 (78.6%) of 14 grade IV tumors had significantly elevated Lac values. Five (45.5%) grade II, no grade III, and seven (50.0%) grade IV tumors had significantly elevated Lip values. Three grade II and six grade IV tumors had both elevated Lac and Lip value. (Because we had only two postsurgical grade III datasets, the elevated Lac and Lip values were not considered representative of such lesions.)
The volume of the elevated Lac and Lip varied considerably for each grade. From the presurgical data, the volume of elevated Lac was 6.69 mL for grade II, 1.01–29.85 mL with a median of 12.32 mL for grade III, and 1.93–39.15 mL with a median of 3.74 mL for grade IV. The elevated Lip value was 2.45 mL for grade III and 1.41–48.52 mL with a median of 12.48 mL for grade IV. From the postsurgical data, the elevated Lac value was 1.39–11.75 mL with a median of 7.48 mL for grade II and 1.31–18.17 mL with a median of 3.24 mL for grade IV. The elevated Lip value was 1.42–16.89 mL with a median of 4.87 mL for grade II and 1.17–17.31 mL with a median of 5.01 mL for grade IV.
Table 2 summarizes the number and percentage, median, and range of volumes for elevated Lac and Lip in patients by grade before and after resection. We noted an increasing trend for the volume of elevated Lac and Lip from before surgery to after surgery for low-grade tumors but a decreasing trend for high-grade tumors.
TABLE 2:
Presence and volumes of significantly elevated Lac and Lip values by tumor grade
| Value | Presurgical Tumor Grade |
Postsurgical Tumor Grade |
||||
|---|---|---|---|---|---|---|
| II (n = 7) | III (n = 5) | IV (n = 11) | II (n = 11) | III (n = 2) | GBM (n = 14) | |
| Lac | ||||||
| Present* | 1 (14.3) | 3 (60.0) | 9 (81.8) | 4 (36.4) | 0 | 11 (78.6) |
| Volume (mL)† | 6.69 | 12.32 (1.01–29.85) | 3.74 (1.93–39.15) | 7.48 (1.39–11.75) | NA | 3.24 (1.31–18.17) |
| Lip | ||||||
| Present* | 0 | 1 (20.0) | 9 (81.8) | 5 (45.5) | 0 | 7 (50.0) |
| Volume (mL)† | NA | 2.45 | 12.48 (1.41–48.52) | 4.87 (1.42–16.89) | NA | 5.01 (1.17–17.31) |
Note.—NA indicates not applicable.
No. of gliomas with elevated Lac or Lip/total no. gliomas in each grade. Data in parentheses are percentages.
Median (minimum − maximum) for gliomas with elevated Lac or Lip values. Data in parentheses are ranges.
Relationship between Morphologic Abnormalities and Elevated Lac and Lip Levels
No correlation was found between the volumes of T2 hyperintensity and elevated Lac or Lip. For presurgical high-grade gliomas, the volume of macronecrosis was significantly correlated with the volume of elevated Lip (Spearman rank correlation coefficient R2 = 0.844, P <.0011). The correlation between the volumes of contrast enhancement and elevated Lip was marginally significant (R2 = 0.526, P = .04). No correlation was found between the volume of elevated Lac and any morphologic abnormality.
Elevated Lac was coincident with the T2 hyperintensity but outside the area of contrast enhancement in the one grade II glioma that had an elevated Lac value before surgery. Two of three presurgical grade III gliomas had elevated Lac within the contrast enhancement. The third grade III glioma had a nonenhancing lesion that showed highly elevated Lac peaks within the T2 hyperintensity.
In three presurgical grade IV gliomas, T1-weighted contrast-enhanced images showed no visible macroscopic necrosis. Two of them had elevated Lac values within the contrast enhancement. The third had both elevated Lac and Lip values but with different spatial localization within the contrast enhancement. The rest of the grade IV tumors had typical ring enhancement with a necrotic core. Elevated Lac and Lip peaks were coincident with the area of necrosis and part of the contrast enhancement and the nonenhancing region around it. The spatial distribution of Lac and Lip was variable; in some cases it was similar, and in others it was different.
Elevated Lac was coincident with the resection cavity in 12 of 15 postsurgical patients who had elevated Lac values, showing the possible effect of surgery. Among them, four also had Lac in the residual area of contrast enhancement. For the other three patients, two had grade II gliomas with elevated Lac value in the nonenhancing region distant from the resection cavity, and one had a grade IV glioma with only elevated Lac within the contrast enhancement.
Elevated Lip was coincident with the resection cavity in eight of 12 postsurgical patients who had an elevated Lip value. Among them, four also had Lip in the area of contrast enhancement around the cavity. For the other four patients, two with grade II tumors had elevated Lip levels in the nonenhancing region, and two with grade IV tumors had elevated Lip levels in the area of residual contrast enhancement.
Figure 1 shows seven presurgical patients with varying spatial localizations of elevated Lac and Lip. Figure 2 shows two grade II and two grade IV postsurgical tumors with different spatial localizations for elevated Lac and Lip. Tables 3 and 4 summarize the localization of elevated Lac and Lip from the presurgical and postsurgical data, respectively.
Fig 1.
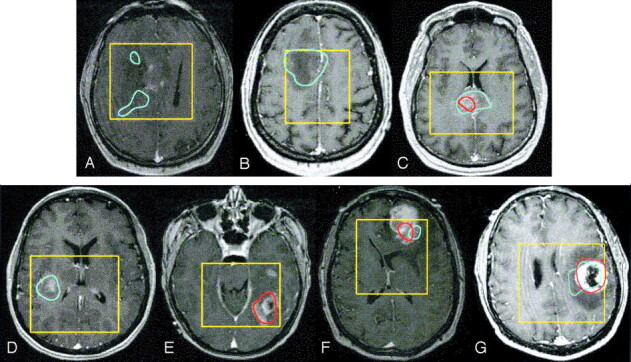
Spatial distribution of elevated Lac and Lip presented as contours overlaid on contrast-enhanced T1-weighted images in presurgical patients with the following tumors: grade II glioma with Lac within the T2 hyperintensity but out of the contrast enhancement (A), nonenhancing grade III glioma with only elevated Lac (B), enhancing grade III glioma with elevated Lac and Lip (C), grade IV glioma with only elevated Lac (D), grade IV glioma with only elevated Lip (E), grade IV glioma without macronecrosis but with elevated Lac and Lip (F), and grade IV glioma with ring enhancement and a necrotic core with elevated Lac and Lip (G). Blue = Lac contours, red = Lip contours, yellow = PRESS box.
Fig 2.

Spatial distribution of elevated Lac and Lip presented as contours overlaid on contrast-enhanced T1-weighted images in postsurgical patients with the following tumors: grade II glioma with Lip within the resection cavity and Lac within the contrast enhancement (A), grade II glioma with Lac and Lip within the nonenhancing region (B), grade IV glioma with Lip within the resection cavity and contrast enhancement and Lac in the enhancement and extended to the nonenhancing region (C), and grade IV glioma with Lac within the resection cavity and Lip partly in the resection cavity and mainly in the contrast enhancement (D). Blue = Lac contours, red = Lip contours, yellow = PRESS box.
TABLE 3:
Spatial localization of elevated Lac and Lip levels compared with morphologic abnormalities before surgery
| Patient | Pathology | Elevated Lac |
Elevated Lip |
||||
|---|---|---|---|---|---|---|---|
| Macronecrosis | CE | T2-CE | Macronecrosis | CE | T2-CE | ||
| 1 | A2 | No | No | No | No | No | No |
| 2 | OD2 | No | No | No | No | No | No |
| 3 | OA2 | No | No | No | No | No | No |
| 4 | OD2 | No | No | No | No | No | No |
| 5 | OD2 | No | No | No | No | No | No |
| 6 | OD2 | No | No | Yes | No | No | No |
| 7* | OD2 | No | No | No | No | No | No |
| 18 | AA3 | No | Yes | No | No | Yes | No |
| 19 | AA3 | No | Yes | No | No | No | No |
| 20 | OD3 | No | No | No | No | No | No |
| 21* | AA3 | No | No | No | No | No | No |
| 22* | OD3 | No | No | Yes | No | No | No |
| 23 | GBM | Yes | Yes | No | Yes | Yes | No |
| 24 | GBM | No | Yes | No | No | No | No |
| 25 | GBM | Yes | Yes | Yes | Yes | Yes | No |
| 26* | GBM | No | No | No | Yes | Yes | No |
| 27* | GBM | No | Yes | No | No | Yes | No |
| 28* | GBM | No | Yes | No | No | No | No |
| 29* | GBM | Yes | Yes | No | Yes | No | No |
| 30* | GBM | Yes | No | No | Yes | Yes | No |
| 31* | GBM | Yes | Yes | Yes | Yes | Yes | No |
| 32* | GBM | No | No | No | Yes | Yes | No |
| 33* | GBM | Yes | Yes | No | Yes | Yes | No |
Note.—Data before surgical resection or biopsy. CE indicates contrast enhancement; T2-CE, regions within T2 hyperintensity but outside contrast enhancement.
Patients with both presurgical and postsurgical data.
TABLE 4:
Spatial localization of elevated Lac and Lip levels compared with morphologic abnormalities after surgery
| Patient | Pathology | Elevated Lac |
Elevated Lip |
||||
|---|---|---|---|---|---|---|---|
| Resection Cavity | CE | T2-CE | Resection Cavity | CE | T2-CE | ||
| 7* | OD2 | No | No | No | No | No | No |
| 8 | A2 | No | No | No | No | No | No |
| 9 | A2 | No | No | No | No | No | No |
| 10 | OD2 | No | No | No | No | No | No |
| 11 | OD2 | No | No | No | No | No | Yes |
| 12 | OD2 | No | No | No | Yes | No | No |
| 13 | OA2 | No | No | Yes | No | No | No |
| 14 | OA2 | No | No | No | No | No | No |
| 15 | A2 | Yes | No | No | Yes | Yes | No |
| 16 | A2 | Yes | Yes | Yes | Yes | No | No |
| 17 | A2 | No | No | Yes | No | No | Yes |
| 21* | AA3 | No | No | No | No | No | No |
| 22* | OD3 | No | No | No | No | No | No |
| 26* | GBM | Yes | No | No | Yes | No | No |
| 27* | GBM | Yes | No | No | No | No | No |
| 28* | GBM | Yes | Yes | Yes | Yes | Yes | No |
| 29* | GBM | No | No | No | Yes | No | No |
| 30* | GBM | No | No | No | No | No | No |
| 31* | GBM | Yes | No | No | No | No | No |
| 32* | GBM | Yes | No | No | No | No | No |
| 33* | GBM | Yes | No | No | No | No | No |
| 34 | GBM | No | Yes | No | No | Yes | No |
| 35 | GBM | Yes | Yes | Yes | Yes | Yes | No |
| 36 | GBM | No | No | No | No | No | No |
| 37 | GBM | Yes | No | No | Yes | Yes | No |
| 38 | GBM | Yes | No | No | No | Yes | No |
| 39 | GBM | Yes | Yes | No | No | No | No |
Note.—Data after surgical resection or biopsy but before radiation treatment or chemotherapy. CE indicates contrast enhancement; T2-CE, regions within T2 hyperintensity but outside contrast enhancement; A2, grade-II astrocytomas; OA2, grade-II oligoastrocytomas; OD2, grade-II oligodendrogliomas; AA3, grade-III anaplastic astrocytomas; OA3, grade-III oligoastrocytomas; OD3, grade-III oligodendrogliomas.
Patients with both presurgical and postsurgical data.
rCBV in Regions with Elevated Lac and Lip Levels
Regions with macronecrosis were excluded from the measurement of rCBV in the Lac or Lip contours. The rCBV was normalized to the value in the contralateral normal white matter.
The maximum and average rCBVs within the Lac contour were 1.34 and 1.99, respectively, for the one grade II tumor with an elevated Lac value. One grade IV tumor was excluded from this measurement because of a technical failure during the acquisition of perfusion data. For the other 10 high-grade tumors (three grade III and seven grade IV), the maximum and average rCBVs within the Lac contours were higher than those for normal white matter, with mean (± SD) of 2.76 ± 1.05 and 3.98 ± 1.72, respectively. Figure 3 shows one nonenhancing grade III glioma with a highly elevated Lac value and with significantly increased rCBV within the Lac contour.
Fig 3.

Images in a 59-year-old woman with nonenhancing infiltrative grade III glioma in the right frontal lobe with a highly elevated Lac level and increased rCBV before surgery: post-contrast T1-weighted image with an overlying PRESS box and voxel grid (A); difference spectra showing huge, elevated Lac peaks (B); Lac image overlaid on the post-contrast T1-weighted image (C), and rCBV (color) overlaid on the post-contrast T1-weighted image (D). White = PRESS box, blue = Lac contour.
The normalized rCBV was measured in the exclusive regions of elevated Lac and Lip, ie, regions within Lac contours but outside Lip contours and in regions within Lip contours but outside Lac contours, for the six grade IV tumors that had both elevated Lac and Lip. Macronecrosis was excluded for all of these measurements. The average rCBV within the Lac and Lip contours were 1.39 ± 0.97 and 3.61 ± 1.58, respectively. The maximum CBV within the Lac and Lip contours were 1.72 ± 1.22 and 4.80 ± 2.30 respectively. The differences for both average and maximum levels were significant (P = .004 and P = .005, respectively; t test), as shown in Figure 4.
Fig 4.

Mean, SD, and maximal (Max) rCBV in regions of elevated Lac but no Lip (within Lac) and in regions with elevated Lip but no Lac (within Lip) for six presurgical grade IV tumors with both elevated Lac and Lip. Both mean and maximal rCBV within Lac were significantly lower than those within Lip.
Figure 5 shows the overlay of the Lac map, Lip map, and rCBV map for a grade IV tumor. The Lip level was elevated within the necrotic core and in the contrast enhancement on the lateral side. The Lac level was elevated within the necrotic core and the contrast enhancement on the medial side and extended to the nonenhancing region within the T2 hyperintensity. rCBV was increased in portions of the contrast-enhancing tumor. The mean and maximum rCBVs were 0.63 and 0.73, respectively, within the region of elevated Lac but exclusive of Lip (the nonenhancing region medial to the contrast enhancement); the rCBVs were 5.03 and 6.15, respectively, within the region with elevated Lip but exclusive of Lac (lateral side of the contrast enhancement).
Fig 5.
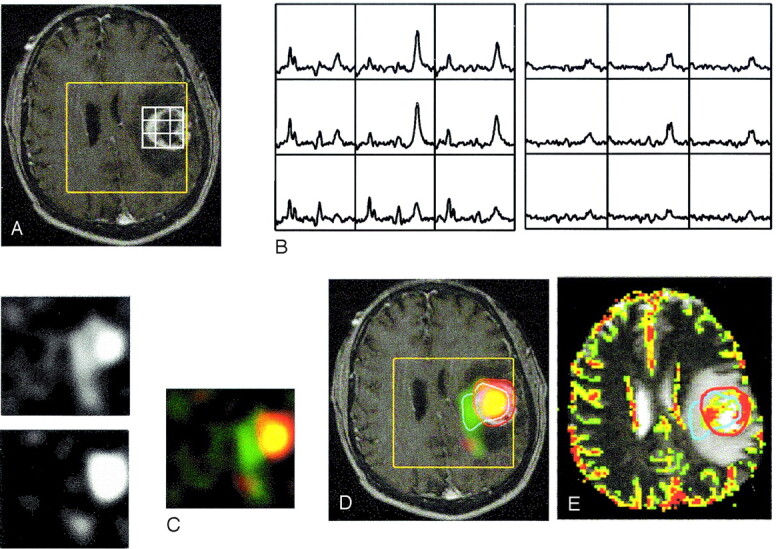
Images in a 49-year-old man with grade IV glioma in the left frontal lobe. Presurgical data show increased mean and maximal rCBV within regions having elevated Lac but no Lip and within regions having elevated Lip but no Lac: contrast-enhanced T1-weighted images with PRESS box (yellow) and part of the voxel grid (white) (A); spectra showing the summed spectra for Cho, Cr, NAA, and elevated Lip (left) and difference spectra showing elevated Lac (right) (B); resampled metabolic images show Lac (upper left), Lip (lower left), and the color overlays (right) for elevated Lac only (green), Lip only (red), and both (yellow) (C); Lac and Lip overlaid on T1-weighted images (D); and rCBV overlaid on T2-weighted images with contours for significantly elevated Lac (blue) and Lip (red) (E).
Discussion
In this study, the in vivo distribution of MR-derived Lac, Lip, and rCBV were estimated for both presurgical and postsurgical patients with glioma by using 3D Lac-edited MR spectroscopic imaging and perfusion-weighted MR imaging. This method may help to obtain a better understanding of the complicated relationship among hypoxia, necrosis, and angiogenesis in gliomas in vivo.
The concentration of Lac may increase when the anaerobic glycolytic pathway exceeds the capacity of the Lac-catabolizing pathways and/or when the cellular capacity for exporting Lac to the bloodstream is impaired. Although several groups reported that the Lac resonances at 1.3 ppm are more frequently present in high-grade gliomas than in others (24, 25), the correlation between Lac and tumor malignancy remains uncertain (6, 9, 14). In this study, a significantly elevated Lac level was present in one of seven presurgical low-grade tumors; thus, it cannot be considered unique to high-grade gliomas. Larger patient populations should be examined to estimate the proportion of Lac presence in low-grade glioma. We were conservative in using a threshold of four times instead of two times the SD of noise to define a significantly elevated Lac or Lip level. During preparation of this manuscript, we found two other patients with low-grade tumors with significantly elevated Lac values. All of these three low-grade tumors were oligodendrogliomas. It would be of interest to further investigate whether Lac may be an indicator of an oligodendrytic histologic subtype of low-grade lesion.
Previous studies have shown that broad resonances at 1.3 and 0.9 ppm represent methylene and methyl groups from Lip and that they are related to necrosis with brain tumors (12, 13). The significant correlation between the volume of necrosis and the elevated Lip levels in this study supports this association. Although all the patients with macronecrosis have elevated Lip values, we noted that one grade III tumor and one grade IV tumor with no macronecrosis and two grade IV tumor with minor macronecrosis (< 1 mL) also had significantly elevated Lip peaks. This finding may be explained by the fact that the Lip resonance is more sensitive for detecting necrosis than conventional MR imaging results. In this study, no low-grade and most high-grade presurgical tumors had significantly elevated Lip peaks. This observation is consistent with that of previous studies that suggested that Lip is associated with high-grade lesions and that it can therefore be considered an indicator of tumor malignancy (6, 9, 12, 13).
After surgery, most high-grade gliomas had elevated Lac and/or Lip levels. More low-grade gliomas had elevated Lac and/or elevated Lip than before surgery. A high proportion of the Lac and Lip abnormalities (78.6% for elevated Lac and 63.6% for elevated Lip) were coincident with the resection cavity, showing the possible effects of surgery.
All presurgical patients who had macronecrosis had elevated Lac coincident with the necrosis, though we found no significant correlation between the volumes of necrosis and elevated Lac. Four of six patients had regions of maximal Lac within the necrotic core. The results suggested that Lac tends to accumulate in necrotic regions of in vivo brain tumor tissue. This finding is consistent with results from an in vivo PET/MR spectroscopic study (11). The accumulation of in vivo Lac within the necrotic core supports the hypothesis that even if no Lac is produced in the necrotic area, it tends to remain in high concentrations as a result of diffusion (26). However, a study in rat C6 gliomas showed a weak tendency of the Lac concentration to decrease with an increasing fractional area of necrosis (27).
It was no surprise that an elevated Lac value was observed in the region of contrast enhancement because of the association between the degeneration of the blood-brain barrier and the presence of tumor cells (28). However, no significant correlation was found between the volumes of elevated Lac and contrast enhancement.
Elevated Lac was observed not only in necrotic and contrast-enhancing regions but also in nonenhancing regions, as shown in Figures 3 and 5. One explanation for these observations is that the tumor cells infiltrate into the nonenhancing region. This supports the concept that contrast enhancement may be unreliable in detecting active tumor. Another factor that may have contributed to the presence of elevated Lac in the nonenhancing region is the high glycolytic activity in macrophages and inflammatory cells (29).
Dynamic susceptibility–contrast MR imaging was applied to study the perfusion activity in tumor tissue. This technique can be used to noninvasively assess tumor vascularity because it provides hemodynamic parameters such as cerebral blood volume, cerebral blood flow, and mean transit time (17). Previous studies have shown correlations between rCBV and histologic grades (30), mitotic activity (18) and microvascular attenuation (18, 19), and Cho signal intensity in malignant gliomas (31). In this study, we explored the relationship among elevated Lac, Lip, and rCBV.
It is well known that perfusion is low in central avascular areas during tumor growth. This fact is consistent with our observation that the perfusion time curves were flat in necrotic cores. Therefore, visible regions of necrosis or macronecrosis were excluded when we studied the relationship among elevated Lac, Lip, and rCBV.
The mean and maximum rCBVs within Lac contours were significantly higher than those in normal white matter. This correlation may result from the close relationship between hypoxia and angiogenesis in tumors (32). Proliferation of tumor cells causes hypoxia when they grow large enough. Under hypoxic conditions, glycolytic metabolism may increase, and as the end product of glycolytic activities, the concentration of Lac may be abnormally high. In this case, the hypoxia-inducible factor HIF-1α may stimulate the dilation of existing anatomic vessels and generation of new blood vessels, or the complicated process of angiogenesis (33).
The resultant heterogeneous perfusion, in addition to elevated metabolic rates, leads to more hypoxic regions. This hypoxia is followed by energy failure and cell death that produces necrosis. Before this necrosis can be observed on MR images (defined as macronecrosis), micronecrosis may be detected as elevated Lip peaks on MR spectroscopic imaging.
This process is illustrated in data from a grade III tumor, as shown in Figure 6. Anatomic images of the lesion showed no necrosis. Significantly elevated Lac and Lip were observed in the area of contrast enhancement, with the Lip contour in the center of the Lac contour. The rCBV map showed decreased rCBV within the Lip contour and elevated rCBV within the Lac contour. Further evaluation of the dynamic curves during the first pass of the bolus of contrast agent also suggested the formation of necrosis in the center of the contrast enhancement.
Fig 6.
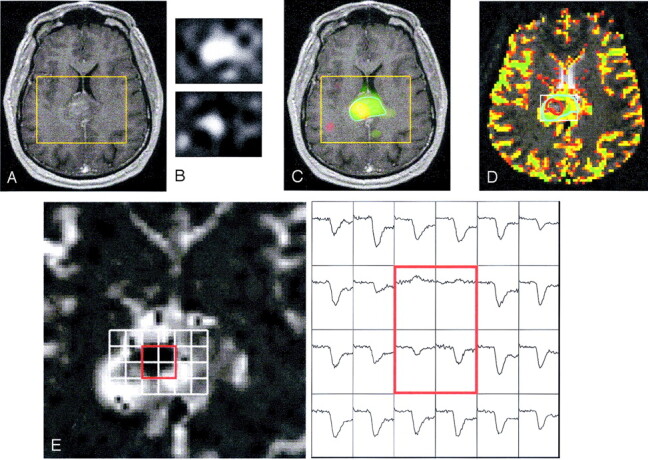
Images in a 45-year-old man with enhancing grade III glioma involving the splenium of the corpus callosum. Presurgical data show elevated Lip in the center of the region with elevated Lac: T1-weighted image showing contrast enhancement but no macronecrosis (A); resampled Lac (upper) and Lip (lower) images (B); Lac (green), Lip (red), and both (yellow) overlaid on a T1-weighted image (C); rCBV overlaid on a T2-weighted image with contours for elevated Lac (blue) and Lip (red) (D); and rCBV curves for voxels in the contrast enhancement (E). Dynamic signal intensity curves for voxels (red square) suggest necrosis, which is consistent with elevated Lip peaks.
Of interest, in the six presurgical grade IV tumors that had both elevated Lac and Lip levels, we observed that the mean and maximum rCBVs within the Lip contours but outside the Lac contours were significantly higher than those within the Lac contours but outside the Lip contours, after we excluded the region with macronecrosis. This finding suggested that the different spatial distributions of Lac, Lip, and rCBV may represent areas of different tumor biology.
The current study was limited by the intrinsic low sensitivity and therefore the low spatial resolution of in vivo MR technologies, as hypoxia and proliferation happens on a scale of hundreds of micrometers (34). Despite this limitation, these studies were important and interesting because they provided a picture of the overall metabolic activities and of the oxygenation and perfusion levels in tumors. The results of similar studies may be useful for classifying tumors and predicting the clinical outcome in terms of treatment response or survival. The mean Lac concentration in biopsy samples has been correlated to the incidence of metastasis (35), and in vivo Lac levels are important factors for predicting the survival of patients with glioma (36).
Conclusion
Our report suggests a practical and robust scheme to estimate in vivo levels of Lac and Lip and to evaluate the in vivo distribution of MR-derived Lac, Lip, and rCBV values in gliomas. MR spectroscopic imaging and perfusion imaging provided complementary information on tumor biology and may help with diagnosis and treatment planning in patients with brain tumors. Further studies with larger populations of patients and longer follow-up are underway and include the direct correlation of imaging results with histologic standards. That information may strengthen the validity of MR-derived Lac, Lip, and rCBV measures as noninvasive imaging markers of tumor hypoxia, necrosis, and angiogenesis.
Footnotes
Supported by National Institutes of Health grants R01-CA79719, R01NS40117, and P50 CA97297.
Presented in part at the 11th meeting of the International Society for Magnetic Resonance in Medicine; Toronto, Ontario, Canada; July, 2003.
References
- 1.Allen M. Oxidative metabolism of brain. Prog Exp Tumor Res 1972;17:192–209 [DOI] [PubMed] [Google Scholar]
- 2.Stone HB, Brown JM, Phillips TL, Sutherland RM. Oxygen in human tumors: correlations between methods of measurement and response to therapy—summary of a workshop held November 19–20, 1992, at the National Cancer Institute, Bethesda, Maryland. Radiat Res 1993;136:422–434 [PubMed] [Google Scholar]
- 3.Evans SM, Koch CJ. Prognostic significance of tumor oxygenation in humans. Cancer Lett 2003;195:1–16 [DOI] [PubMed] [Google Scholar]
- 4.Usenius JP, Vainio P, Hernesniemi J, Kauppinen RA. Choline-containing compounds in human astrocytomas studied by 1H NMR spectroscopy in vivo and in vitro. J Neurochem 1994;63:1538–1543 [DOI] [PubMed] [Google Scholar]
- 5.Chang L, McBride D, Miller BL, et al. Localized in vivo 1H magnetic resonance spectroscopy and in vitro analyses of heterogeneous brain tumors. J Neuroimaging 1995;5:157–163 [DOI] [PubMed] [Google Scholar]
- 6.Negendank WG, Sauter R, Brown TR, et al. Proton magnetic resonance spectroscopy in patients with glial tumors: a multicenter study. J Neurosurg 1996;84:449–458 [DOI] [PubMed] [Google Scholar]
- 7.Nelson SJ, Vigneron DB, Dillon WP. Serial evaluation of patients with brain tumors using volume MRI and 3D 1H MRSI. NMR Biomed 1999;12:123–138 [DOI] [PubMed] [Google Scholar]
- 8.Li X, Lu Y, Pirzkall A, McKnight TR, Nelson SJ. Analysis of the spatial characteristics of metabolic abnormalities in newly diagnosed glioma patients. J Magn Reson Imaging 2002;16:229–237 [DOI] [PubMed] [Google Scholar]
- 9.Kaminogo M, Ishimaru H, Morikawa M, et al. Diagnostic potential of short echo time MR spectroscopy of gliomas with single-voxel and point-resolved spatially localized proton spectroscopy of brain. Neuroradiology 2001;43:353–363 [DOI] [PubMed] [Google Scholar]
- 10.Alger JR, Frank JA, Bizzi A, et al. Metabolism of human gliomas: assessment with H-1 MR spectroscopy and F-18 fluorodeoxyglucose PET. Radiology 1990;177:633–641 [DOI] [PubMed] [Google Scholar]
- 11.Herholz K, Heindel W, Luyten PR, et al. In vivo imaging of glucose consumption and lactate concentration in human gliomas. Ann Neurol 1992;31:319–327 [DOI] [PubMed] [Google Scholar]
- 12.Remy C, Fouilhe N, Barba I, et al. Evidence that mobile lipids detected in rat brain glioma by 1H nuclear magnetic resonance correspond to lipid droplets. Cancer Res 1997;57:407–414 [PubMed] [Google Scholar]
- 13.Kuesel AC, Sutherland GR, Halliday W, Smith ICP. 1H MRS of high grade astrocytomas: mobile lipid accumulation in necrotic tissue. NMR Biomed 1994;7:149–155 [DOI] [PubMed] [Google Scholar]
- 14.Cheng LL, Chang IW, Louis DN, Gonzalez RG. Correlation of high-resolution magic angle spinning proton magnetic resonance spectroscopy with histopathology of intact human brain tumor specimens. Cancer Res 1998;58:1825–1832 [PubMed] [Google Scholar]
- 15.Star-Lack J, Spielman D, Adalsteinsson E, Kurhanewicz J, Terris DJ, Vigneron DB. In vivo lactate editing with simultaneous detection of choline, creatine, NAA, and lipid singlets at 1.5 T using PRESS excitation with applications to the study of brain and head and neck tumors. J Magn Reson 1998;133:243–254 [DOI] [PubMed] [Google Scholar]
- 16.Yetkin FZ, Mendelsohn D. Hypoxia imaging in brain tumors. Neuroimaging Clin N Am 2002;12:537–552 [DOI] [PubMed] [Google Scholar]
- 17.Rosen BR, Belliveau JW, Chien D, Perfusion imaging by nuclear magnetic resonance. Magn Reson Q 1989;5:263–281 [PubMed] [Google Scholar]
- 18.Aronen HJ, Gazit IE, Louis DN, et al. Cerebral blood volume maps of gliomas: comparison with tumor grade and histologic findings. Radiology 1994;191:41–51 [DOI] [PubMed] [Google Scholar]
- 19.Cha S, Johnson G, Wadghiri YZ, et al. Dynamic, contrast-enhanced perfusion MRI in mouse gliomas: correlation with histopathology. Magn Reson Med 2003;49:848–855 [DOI] [PubMed] [Google Scholar]
- 20.Tran TK, Vigneron DB, Sailasuta N, et al. Very selective suppression pulses for clinical MRSI studies of brain and prostate cancer. Magn Reson Med 2000;43:23–33 [DOI] [PubMed] [Google Scholar]
- 21.Li X, Graves EE, Vigneron DB, Cha S, McKnight TR, Nelson SJ. Reliable estimate of lactate and lipid for newly-diagnosed gliomas patients using lactate-edited 3D 1H-MRSI with ellipsoidal k-space sampling. In: Proceedings of the 11th ISMRM. Berkeley: International Society for Magnetic Resonance in Medicine;2003. :753
- 22.Nelson SJ. Analysis of volume MRI and MR spectroscopic imaging data for the evaluation of patients with brain tumors. Magn Reson Med 2001;46:228–239 [DOI] [PubMed] [Google Scholar]
- 23.Knopp EA, Cha S, Johnson G, et al. Glial neoplasms: dynamic contrast-enhanced T2*-weighted MR imaging. Radiology 1999;211:791–798 [DOI] [PubMed] [Google Scholar]
- 24.Go KG, Kamman RL, Mooyaart EL, et al. Localised proton spectroscopy and spectroscopic imaging in cerebral gliomas, with comparison to positron emission tomography. Neuroradiology 1995;37:198–206 [DOI] [PubMed] [Google Scholar]
- 25.Tien RD, Lai PH, Smith JS, Lazeyras F. Single-voxel proton brain spectroscopy exam (PROBE/SV) in patients with primary brain tumors. AJNR Am J Neuroradiol 1996;167:201–209 [DOI] [PubMed] [Google Scholar]
- 26.Garcia-Martin ML, Herigault G, Remy C, et al. Mapping extracellular pH in rat brain gliomas in vivo by 1H magnetic resonance spectroscopic imaging: comparison with maps of metabolites. Cancer Res 2001;61:6524–6531 [PubMed] [Google Scholar]
- 27.Terpstra M, High WB, Luo Y, de Graaf RA, Merkle H, Garwood M. Relationships among lactate concentration, blood flow and histopathologic profiles in rat C6 glioma. NMR Biomed 1996;9:185–194 [DOI] [PubMed] [Google Scholar]
- 28.Engelhard H, Groothuis D. In: Berger M, Wilson C, eds. The Gliomas. Philadelphia: W. B. Saunders;1999. :115–121
- 29.Bental M, Deutsch C. Metabolic changes in activated T cells: an NMR study of human peripheral blood lymphocytes. Magn Reson Med 1993;29:317–26 [DOI] [PubMed] [Google Scholar]
- 30.Sugahara T, Korogi Y, Kochi M, et al. Correlation of MR imaging-determined cerebral blood volume maps with histologic and angiographic determination of vascularity of gliomas. AJR Am J Roentgenol 1998;171:1479–1486 [DOI] [PubMed] [Google Scholar]
- 31.Henry RG, Vigneron DB, Fischbein NJ, et al. Comparison of relative cerebral blood volume and proton spectroscopy in patients with treated gliomas. AJNR Am J Neuroradiol 2000;21:357–366 [PMC free article] [PubMed] [Google Scholar]
- 32.Folkman J. Tumor angiogenesis. Adv Cancer Res 1974;19:331–358 [DOI] [PubMed] [Google Scholar]
- 33.Zagzag D, Zhong H, Scalzitti JM, Laughner E, Simons JW, Semenza GL. Expression of hypoxia-inducible factor 1alpha in brain tumors: association with angiogenesis, invasion, and progression. Cancer 2000;88:2606–2618 [PubMed] [Google Scholar]
- 34.Ljungkvist AS, Bussink J, Rijken PF, Kaanders JH, van der Kogel AJ, Denekamp J. Vascular architecture, hypoxia, and proliferation in first-generation xenografts of human head-and-neck squamous cell carcinomas. Int J Radiat Oncol Biol Phys 2002;54:215–228 [DOI] [PubMed] [Google Scholar]
- 35.Walenta S, Salameh A, Lyng H, et al. Correlation of high lactate levels in head and neck tumors with incidence of metastasis. Am J Pathol 1997;150:409–415 [PMC free article] [PubMed] [Google Scholar]
- 36.Tarnawski R, Sokol M, Pieniazek P, et al. 1H-MRS in vivo predicts the early treatment outcome of postoperative radiotherapy for malignant gliomas. Int J Radiat Oncol Biol Phys 2002;52:1271–1276 [DOI] [PubMed] [Google Scholar]