Abstract
BACKGROUND AND PURPOSE: The purpose of this study was to investigate the effects of unequal physiologic flow conditions in the internal carotid arteries (ICAs) on the hemodynamics of anterior communicating artery aneurysms.
METHODS: Patient-specific computational fluid dynamics models of 2 cerebral aneurysms were constructed from bilateral 3D rotational angiograms. The flow dynamics of the aneurysm sac were analyzed under the effect of unequal mean flows, phase shifts, and waveforms between the ICAs. A total of 9 simulations were performed for each patient; cine flow velocity simulations and unsteady wall shear stress (WSS) maps were created for each flow condition. Time-dependent curves of average WSS magnitude over selected regions on the aneurysms were constructed.
RESULTS: Mean flow unbalances in the feeding vessels tended to shift the regions of elevated WSS towards the dominating inflow jet and to change the magnitude of the WSS peaks. The overall qualitative appearance of the WSS distribution and velocity simulations was not substantially affected. Phase and waveform asymmetry increased the temporal complexity of the hemodynamic patterns and tended to destabilize the flow pattern.
CONCLUSIONS: Differences in the relative phase and waveform shape in ICAs can significantly affect the complexity and stability of the hemodynamic force distributions. The magnitude of these effects is related to the geometry of the aneurysm and the feeding vessels. Conditions affecting the flow characteristics in the parent arteries of cerebral aneurysms with more than 1 avenue of inflow should be incorporated into flow models.
It is widely believed that the initiation, growth, and, ultimately, rupture of cerebral aneurysms is related to an interaction between the hemodynamic forces with the vessel wall biology and the resulting weakening of the wall. The flow dynamics of cerebral aneurysms have been studied in numerous experimental models and clinical studies to investigate the role of hemodynamics in their initiation, growth, and rupture.1–4 Although these authors have characterized the complexity of intra-aneurysmal hemodynamics, the studies have largely focused on idealized aneurysm geometries or surgically created aneurysms in animals. Because of numerous technical limitations, these previous approaches have not been able to replicate the complex geometries found in many patients so that, to our knowledge, the hemodynamics of complex aneurysms have seldom been studied.
The anterior communicating artery (AComA) is a recognized site of aneurysm predilection, accounting for nearly one fourth of all cerebral aneurysms in several large studies.5,6 The AComA has a unique function in the vascular system of the body because it serves as a collateral channel between the cerebral anterior circulations. The AComA is the only cerebral artery that evolves from an arterial plexus in the deep intrahemispheric fissure; this origin may account for the high frequency of anomalies such as duplication, fenestration, and plexus formation at this location. Inequality of the proximal segment of the anterior cerebral artery (ACA) has been reported to occur in 7%–46% of selected cases,7 adding to the complexity of the flow patterns in this region. Lifelong physiologic factors and aging may further influence the geometry in time, as a result of vascular remodeling and pathologic responses. Because of the complexity and diversity to the geometry of the AcomA, aneurysms of the AcomA are considered the most complex of the anterior circulation. The AcomA receives blood flow from the 2 A1 segments of the ACAs, so inequality in pressures transmitted from the internal carotid arteries (ICAs) determines the flow in the AcomA. Thus, in addition to the complex geometry of the parent arteries and the sac, study of AcomA aneurysms is more difficult because of the interaction of 2 sources of inflow.
Computation-based models provide an attractive method for the study of intra-aneurysmal hemodynamics because of the ability to study all possible geometries.8,9 We have recently developed a new methodology to model aneurysms with multiple avenues of inflow from multiple-injection 3D rotational angiograms.10 Using this methodology, we focused on the effects of instantaneous flow differences in the feeding vessels on the intra-aneurysmal hemodynamics of AcomA aneurysms. Particular attention was paid to the influence of the inflow conditions on the stability and complexity of the hemodynamic force distribution, which, as indicated by our pilot study, may play an important role in the mechanism of aneurysm growth and rupture.9
Patients and Methods
Images from 2 patients with AComA aneurysms were selected from our data base to represent 2 geometries of the A1 confluence. Patient 1 was a 54-year-old man with an incidentally discovered 10-mm AcomA aneurysm who was treated with elective endosaccular coiling. The second patient was a 45-year-old woman who presented emergently to our hospital with a Hunt and Hess grade II subarachnoid hemorrhage. An 8-mm AcomA aneurysm was diagnosed and coiled. The first patient had more symmetric A1s, with both A1s horizontally arranged. In the second patient, there was more asymmetry of the A1s, but a more superiorly located AComA caused the 2 A1s to meet in an acute angle. In both cases, during conventional cerebral angiography, rotational acquisitions were obtained in the ICA bilaterally, by using an Integris system (Philips Medical Systems, Best, The Netherlands). These images were obtained during a 180° rotation with imaging at 15 frames per second for a total of 8 seconds. The corresponding 120 projection images were reconstructed into a 3D dataset of 128 × 128 × 128 voxels, covering a field of view of 54.02 mm on a dedicated Integris 3DRA Release 4.2 Workstation (Philips Medical Systems). The voxel data were exported into a PC for mathematic vascular modeling by using a recently developed methodology.10,11
Vascular Modeling
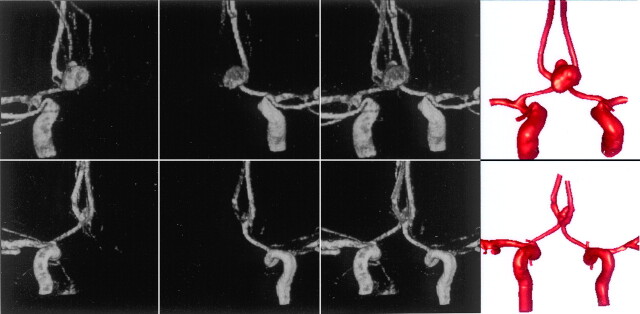
The 3D rotational angiograms obtained by contrast injection in the left and right carotid arteries of each patient were manually coregistered. Vascular models of the left and right portion of the arterial tree were then independently reconstructed from the corresponding 3D rotational angiograms by using geometric deformable models. We then fused these models by using a surface-merging algorithm after applying the same rigid registration transformation that was used for the images. The surface models were then smoothed, and vessel branches were truncated and extruded along the vessel axis. The 3D rotational angiograms and vascular models for the 2 patients are shown in Fig 1. High-quality volumetric finite-element grids composed of tetrahedral elements were then generated by using an advancing front technique to fill the space inside these geometrica models. The mesh minimum resolution was approximately 0.16 mm, which resulted in grids of approximately 2.95 and 2.35 million elements for patients 1 and 2, respectively. Details of the procedures can be found in Castro et al10 and Cebral et al.11
Fig 1.
Construction of 2 vascular models of AComA aneurysms from bilateral 3D rotational angiograms. The top row corresponds to patient 1, whereas the bottom row corresponds to patient 2. From left to right, the columns show volume renderings of the 3D rotational angiograms obtained by contrast injection in the right and left ICAs, the coregistered 3D rotational angiograms, and the reconstructed vascular models.
Blood Flow Analysis
Blood flow was modeled as an incompressible Newtonian fluid. The governing equations were the unsteady Navier-Stokes equations in 3D. The blood attenuation was ρ = 1.0 g/cm3 and the viscosity was μ = 0.04 poise. Vessel walls were assumed rigid, and no slip boundary conditions were applied at the walls. Assuming that all the distal vascular beds have similar total resistance to flow, we applied traction-free boundary conditions with the same pressure levels to all the model outlets. At the inflows, pulsatile velocity profiles were prescribed by using the Womersley solution for the fully developed pulsatile flow in a rigid straight pipe. These velocity profiles were computed from the Fourier decomposition of the prescribed flow-rate curves. Numeric solutions of the Navier-Stokes equations were obtained by using a fully implicit finite element formulation that allows arbitrary time-step sizes. Two cardiac cycles were computed by using 100 time-steps per cycle, and all the results presented correspond to the second cardiac cycle. Further details can be found in Cebral et al.11
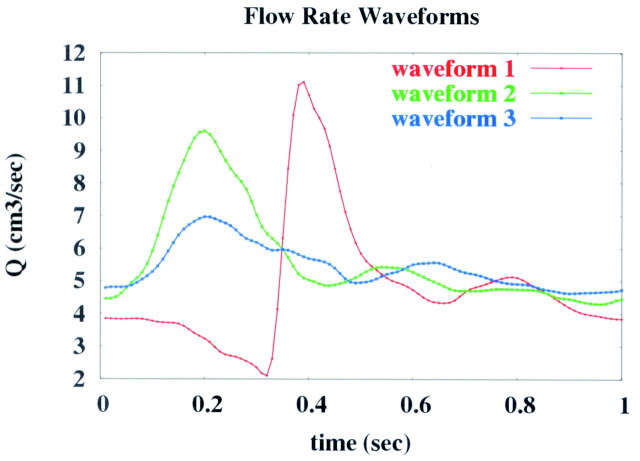
To study the effects of flow differences between the left and right ICAs, we performed a total of 9 computational fluid dynamics (CFD) simulations for each patient. The range of these flow parameters (mean flows, phase shift, and waveform shape) were estimated from phase-contrast MR imaging measurements of flow rates obtained in the carotid arteries of 5 healthy volunteers.12 The flow conditions used for each of these runs, called “cases,” are listed in the Table. The base case 1 corresponded to equal flow conditions in the left and right ICAs. In all cases except 4 and 5, the flow waveform shape corresponded to curve 1 of Fig 2. Cases 2 and 3 corresponded to increasing and decreasing the mean flow between the left and right ICAs by 10%, respectively. Cases 4 and 5 corresponded to changing the flow waveform shape. In cases 4 and 5, curves 2 and 3 of Fig 2 were prescribed to the left and right ICAs and vice versa. Cases 6 and 7 corresponded to shifting the relative phase of the left and right ICA waveforms by ±2%, respectively, while maintaining the same mean flows. A positive (negative) shift meant that the peak of the flow curve occurred earlier (later) in the left ICA than in the right ICA. Cases 8 and 9 corresponded to phase shifts of ±4% between these waveforms.
Flow conditions used for the numerical models of aneurysm hemodynamics
| Case | QLICA (mL/s) | QRICA (mL/s) | Δφ | SLICA | SRICA |
|---|---|---|---|---|---|
| 1 | 4.82 | 4.82 | 0% | 1 | 1 |
| 2 | 4.58 | 5.06 | 0% | 1 | 1 |
| 3 | 5.06 | 4.58 | 0% | 1 | 1 |
| 4 | 5.42 | 5.64 | 0% | 2 | 3 |
| 5 | 5.64 | 5.42 | 0% | 3 | 2 |
| 6 | 4.82 | 4.82 | +2% | 1 | 1 |
| 7 | 4.82 | 4.82 | −2% | 1 | 1 |
| 8 | 4.82 | 4.82 | +4% | 1 | 1 |
| 9 | 4.82 | 4.82 | −4% | 1 | 1 |
Note:—QLICA and QRICA denote mean flows in the left and right internal carotid arteries (ICAs), respectively; Δφ, the phase shift between the left and right waveforms; SLICA and SRICA, the waveform shapes in the left and right ICAs, respectively; these numbers indicate the curves shown in Figure 2.
Fig 2.
Flow waveforms used in the numeric models of aneurysm hemodynamics.
Postprocessing and Data Analysis
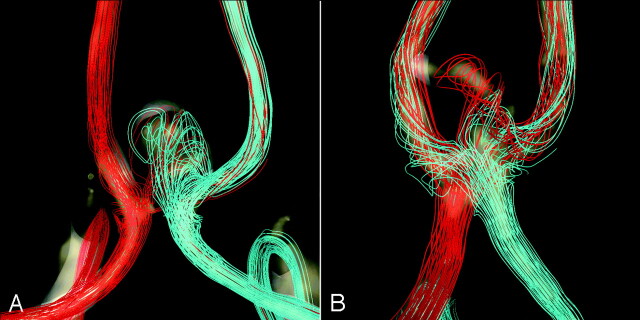
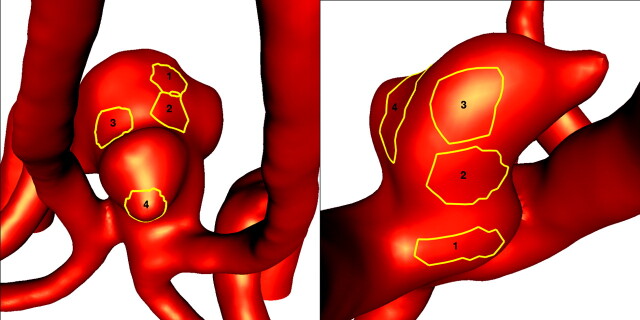
Animations or cine loops of the wall shear stress (WSS) magnitude and flow velocity were produced for the 2 patients and for all the flow conditions described in the previous section. Instantaneous streamlines at peak systole of the base case (1) are shown in Fig 3 for both patients. To compare the distributions of WSS for the different flow conditions, we selected 4 regions of approximately 0.02 cm2 in each aneurysm. These regions were manually selected by looking at the locations of the peaks of the WSS in the corresponding animations. They corresponded to approximately 1.5% of the area of the aneurysm. For each timeframe, the spatial average of the WSS magnitude over each region was calculated and plotted against the time (Fig 4). The pulsatile flow fields for each aneurysm were computed for all the flow conditions described previously, and the corresponding distributions of WSSs were calculated. Plots of the time-dependent average WSS magnitude over each of the 4 regions were made. Four instants of time near the peak of the curves of Fig 5 and Fig 6 were selected, and visualizations of the instantaneous WSS distribution at these instants of time for all flow conditions were made.
Fig 3.
Visualization of the inflow and intra-aneurysmal flow patterns: Instantaneous streamlines at peak systole of the base case (1) are plotted for patient 1 (A) and patient 2 (B). The streamlines originating in the left and right A1 segments are rendered in red and light blue, respectively. The dominance of the left inflow in patient 2 and the more symmetric inflow pattern of patient 1 can be clearly seen.
Fig 4.
Selected regions for comparison of WSSs obtained under different flow conditions. The left and right panels correspond to the aneurysms of patients 1 and 2, respectively.
Fig 5.
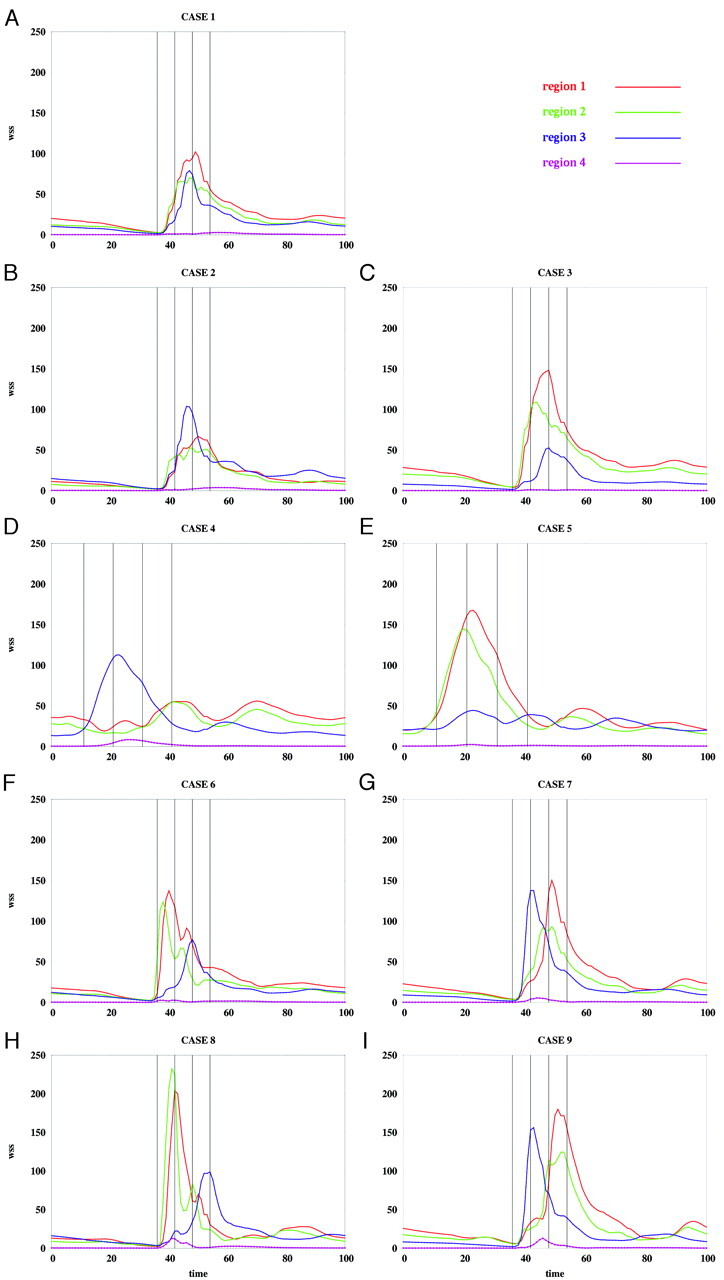
Average WSS magnitude over each region of patient 1 for the flow conditions listed in the Table. WSS magnitudes are in dynes per square centimeter, and time is in percentage of the cardiac cycle.
Fig 6.
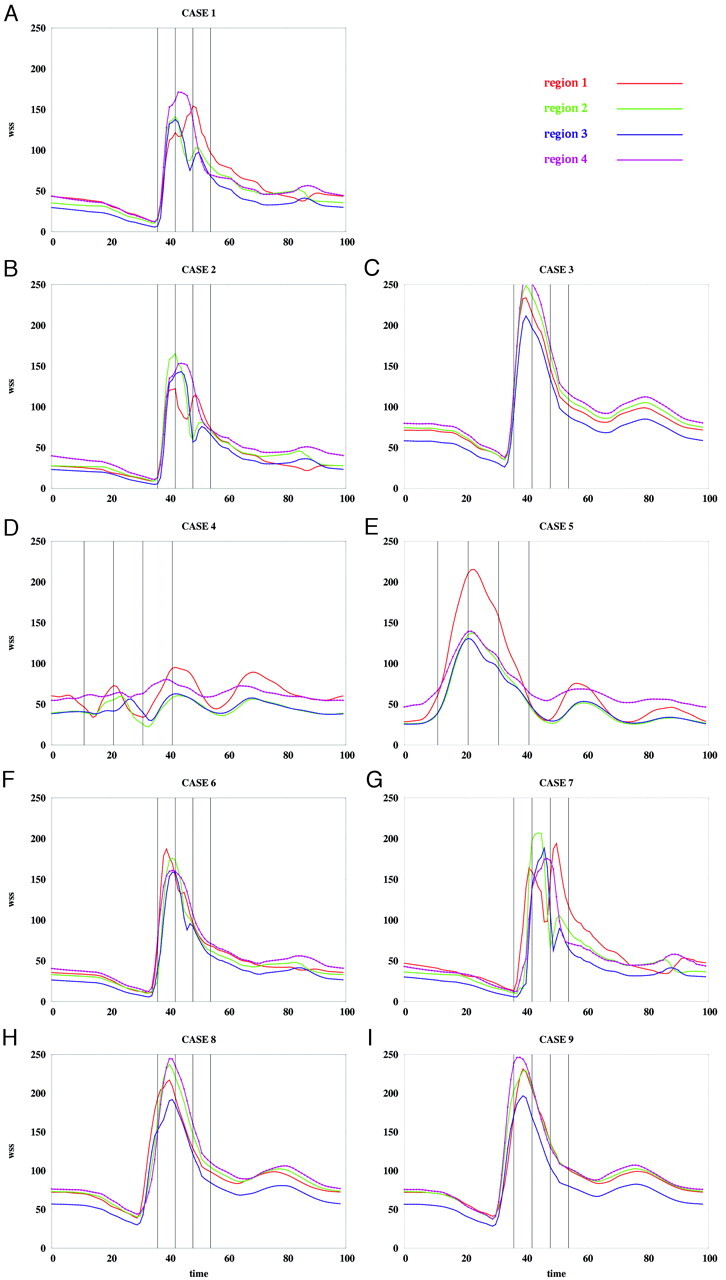
Average WSS magnitude over each region of patient 2 for the flow conditions listed in the Table. WSS magnitudes are in dynes per square centimeter, and time is in percentage of the cardiac cycle.
Results
The base case flow velocity cine loops for each patient showed complex intra-aneurysmal flow patterns with 2 inflow jets meeting and creating several vortices. Each inflow jet had a corresponding zone of impingement, but collision of the 2 jets caused some dispersion of flow. In patient 2, the zones of impingement were separated significantly and associated with discrete areas of increased focal elevated WSS in the aneurysm dome. For patient 1, the impingement regions were in close proximity and were seen as a confluence of more modestly elevated WSS within the dome centrally. The 2 inflow jets appeared synchronized, reaching maximum velocity at essentially the same point in the cardiac cycle. The directions of the inflow jets were constant through the cardiac cycle with a stable overall pattern of recirculation.
In patient 1, the flow patterns in the parent arteries were symmetric, with the ipsilateral A1 accounting for most flow in the ipsilateral A2. Only a small amount of cross-filling was seen from the right A1 to the left A2. The inflow jets met well within the aneurysm near the dome, accounting for the near confluence of the zone of impingement. In patient 2, there was significant merging of flows of the parent arteries at the AcomA confluence. Therefore, each A1 contributed to both A2 segments. For this patient, the inflow jets met closer to the neck, resulting in the 2 more separated zones of impingement.
Effects of Mean Flow Imbalance
The instantaneous WSS magnitude corresponding to the base case (1) and the unbalanced mean flow cases (2 and 3) for each of the regions defined in Fig 4 are presented in Fig 5A–C and Fig 6A–C, for patients 1 and 2, respectively. These curves show that unbalancing the mean flow between the left and right ICA changes the relative magnitude of the WSS curves while maintaining the time coherence of these curves. This effect can be understood by looking at the WSS distributions presented in Fig 7A–C and Fig 8A–C. These figures show that changing the flow balance in the feeding vessels produces a shift of the peaks of WSS on the aneurysm sac. This corresponds to a shift of the flow impaction zone toward the feeding vessel with larger mean flow. In addition, it can be observed that the absolute magnitude of the peaks of the WSS distribution also changes between these cases. In particular, the magnitude of the peak WSS for case 3 is higher for both patients. This finding is due to the different ways in which the 2 inflow jets merge or collide before impacting the aneurysm wall. The 2 inflow jets can interfere destructively or constructively and diffuse (as in case 2) or concentrate (as in case 3) the peaks of the WSS distribution.
Fig 7.
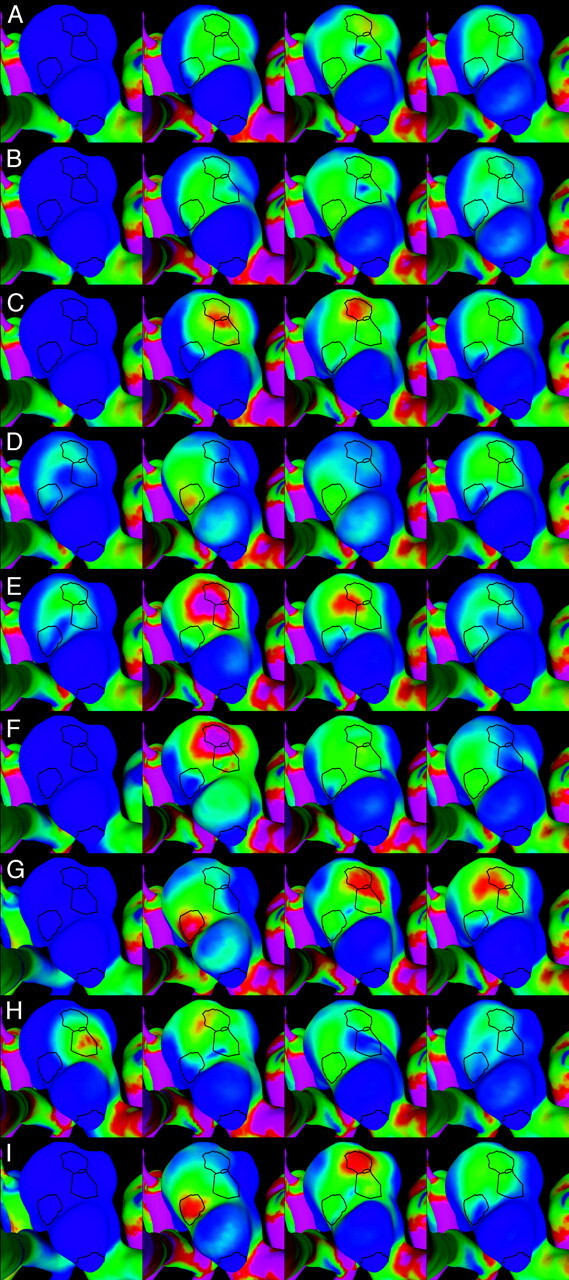
Visualizations of the instantaneous WSS distribution over the aneurysm of patient 1. Each column corresponds to each of the 4 selected instants of time defined in Fig 5. Each row corresponds to each of the 9 flow conditions listed in the Table. The regions defined in Fig 4 (left) are also shown for reference. WSS magnitudes range from 0 (blue) to 200 dyne/cm2 (magenta).
Fig 8.
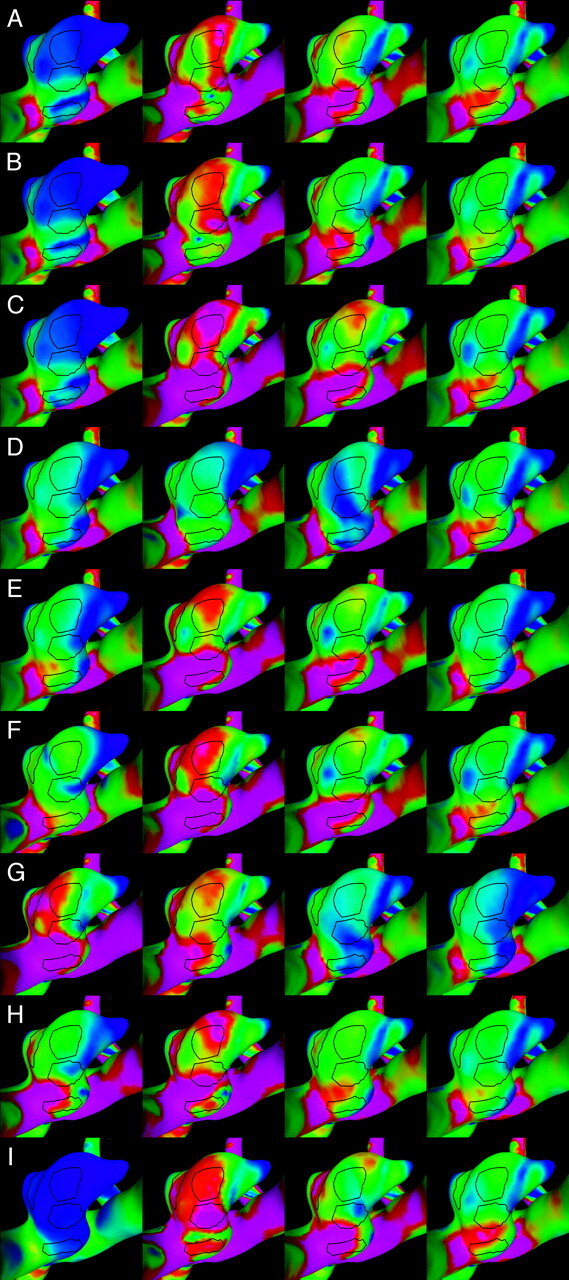
Visualizations of the instantaneous WSS distribution over the aneurysm of patient 2. Each column corresponds to each of the 4 selected instants of time defined in Fig 6. Each row corresponds to each of the 9 flow conditions listed in the Table. The regions defined in Fig 4 (right) are also shown for reference. WSS magnitudes range from 0 (blue) to 200 dyne/cm2 (magenta).
Effects of Phase Differences
Changing the relative phase between the inflow waveforms produces more complex effects than changing the mean flow balance. The instantaneous WSS for the different phase shifts listed in the Table are shown in Fig 5F–I and Fig 6F–I for patients 1 and 2, respectively. The corresponding maps of WSS magnitude are shown in Fig 7F–I and Fig 8F–I. Overall, these curves show that shifting the phase of the inflows tends to make the peak in each of the selected regions occur at different times. For instance, for patient 1 (Fig 5F, -G), the peak of region 1 occurs before the peak of region 3 when the phase shift is positive (case 6), and it occurs after that of region 3 when the phase shift is negative (case 7). These 2 peaks occur at roughly the same time in the absence of any phase shift (base case 1). For patient 2, the phase shift tends to produce a temporal alignment of the peaks of WSS in the different regions (Fig 6F, -G). Thus, adding a phase shift between the inflows tends to separate in time or align the peaks of WSS of the different regions. This result means that a phase shift introduces extratemporal dependency (extra-Fourier modes) to the velocity field, making the overall pattern more temporally complex and unstable. This can also be observed in Fig 7F, -G and Fig 8F, -G, where it can be clearly seen that when a phase shift is introduced, the peak of WSS moves around the aneurysm surface during the cardiac cycle, whereas in the previous cases, it remained roughly at the same location during the entire period. Increasing the phase shift from 2% to 4% of the period of the cardiac cycle yielded larger magnitudes of the peaks of WSS in the selected regions (Fig 5H, -I, and Fig 6H, -I). This again can be attributed to instantaneous constructive interference between the inflow jets or simply reduction of a disruptive interference by an opposing flow jet.
Effects of Flow Waveform Shape
When the shape of the flow waveforms in the left and right ICAs are different, the peaks of WSS in the selected regions occur at different instants during the cardiac cycle and also have different absolute magnitudes (Fig 5D, -E and Fig 6D, -E). As can be observed in Fig 7D, -E and Fig 8D, -E, changing the inflow waveforms changes the location, relative magnitude, and temporal dependence of the peaks of WSS. These figures also show that these effects are more pronounced in patient 1 than in patient 2. Overall, the aneurysm of patient 2 is less sensitive to changes in the inflow conditions.
Discussion
Our previous work on computational modeling9 showed a correlation between certain hemodynamic features and the clinical event of prior aneurysmal rupture. We also identified technical limitations in our ability to model some cerebral aneurysms because of the potential of multiple avenues of inflows, in particular aneurysms of the AComA. The aim of our current work was to extend our method to include these common aneurysms.
Two issues make AComA aneurysms a particularly difficult challenge to modeling. First is obtaining the accurate 3D geometry. CT and MR techniques image both avenues of inflow into an AComA aneurysm simultaneously but have problems of resolution, particularly in the region of the aneurysm neck. Also, MR angiography may be affected by the complex low-velocity flows found in an aneurysm and, therefore, may not give a complete visualization of the aneurysm dome. Because intra-aneurysmal hemodynamics are very sensitive to the aneurysmal geometry,11 using these modalities may introduce significant distortion into patient-specific intra-aneurysmal flows. Conventional angiography is limited to imaging only a single avenue of inflow at a time. We have developed a new technique for combining the results of 2 independently acquired 3D rotational angiograms into an accurate numeric model, allowing for the use of the higher resolution provided by conventional angiography. This avoids the need for simultaneous injections into both ICAs, through 2 catheters or the flooding of the intracranial circulation from an aortic arch injection.
The second challenge is the potential for 2 possible meeting-pressure waves from 2 sources of inflow. Aneurysms of the AComA accept blood flow from 2 sources, the left and right A1 segments of the ACAs, which, in turn, receive blood from the corresponding ICAs. This pattern raises the possibility that mean and instantaneous flow unbalances between the left and right ICAs will have an effect on the intra-aneurysmal hemodynamics. In effect, AComAs are a site of meeting (or even colliding) pressure waves transmitted through the arterial tree from the heart. Flow within the AComA is driven by differences in pressures between the A1 segments. So, there is potential for very rapid and severe shifts in flows within an associated aneurysm if there are differences in flow inputs between the ICAs or asymmetric changes in flow related to the pathology and geometry of the connecting intracranial arteries. Previous in vitro modeling by Kerber et al4 provided evidence of this effect. Using a silicone replica of a lethal AComA aneurysm and imaging of fluid slipstreams, they observed that with symmetric flow conditions, slipstreams rarely entered the aneurysm, but with asymmetric alterations in flow, complicated flow patterns were identified within the aneurysm.
Our results indicate that there is a potentially significant influence of imbalances of flow in the ICAs, but the sensitivity of particular aneurysms may differ. In these 2 aneurysms, the main effect of changing the mean flow balance between the feeding arteries is an intensification of the flow impaction zone, resulting in increased magnitude of the WSS for the inflow jet with increased flow. The magnitude of the peak in WSS depends on whether the inflow jets interfere constructively or destructively. Constructive interference may lead to a peak WSS in excess of the base case of balanced flow. In contrast, changing the relative phase or the shape of the inflow waveforms has a more dramatic effect. These changes introduce extratemporal dependencies of the velocity field that make the regions of elevated WSS travel along the surface of the aneurysm during the cardiac cycle. In the absence of aneurysms, phase or waveform shape differences in the inflows would induce to-and-fro motions of blood in the AComA during the cardiac cycle. This phenomenon has been observed during angiographic examinations that show contrast agent passing through the AComA in both directions (left to right and right to left) a few times during the cardiac cycle. It may also explain the mechanism for preserving patency of a large collateral pathway between the hemispheres, despite often not having any net flow.
If our sensitivity analysis points to a significant influence of these asymmetries in flow in some AComA aneurysms, do these asymmetries exist and how are they explained theoretically? Different mean flow rates between the left and right ICAs may be caused by differences in the flow resistances (or impedances) of the corresponding distal vascular beds. Phase shifts and waveform-shape differences may arise because of the differences in the impedance of the proximal segments of the carotid arteries. Because the wave propagation speeds in human vessels are quite high (of the order of a few meters per second), differences in the length of the carotid arteries will produce only very small phase shifts between the corresponding flow waveforms. However, differences in the compliance of the carotid arteries can produce a difference in the wave propagation speeds that, in turn, can yield a phase difference of a few percent of the period of the cardiac cycle. A back-of-the-envelope calculation can be used to illustrate this point. The propagation speed of pressure waves in an elastic tube filled with an ideal fluid is given by Mazumdar13:
 |
1) |
where E is the elasticity of the vessel (Young’s modulus); h, its thickness; ρ, its attenuation; and R, its un-deformed radius. Two waves propagating along 2 vessels (left and right carotid arteries) will have a phase difference that depends on the difference in the arrival time (Δt) of the corresponding waves. Therefore, according to this formula, 2 vessel segments with the elastic moduli of E1 = 2.0 × 10⁶ dyne/cm2 and E2 = 1.5 × 10⁶ dyne/cm2 (length, L1 = 20 cm and L2 = 21 cm; radii, R1 = 0.3 cm and R2 = 0.3 cm; wall thickness, h1 = 0.03 cm and h2 = 0.025 cm; and densities, ρ1 = 1.0 g/cm3 and ρ2 = 1.0 g/cm3) will have a relative phase shift of approximately 2.25%. In non-ideal fluids (ie, viscous fluids), different wave speeds are expected for each Fourier mode of the flow waveform, which tend to produce a dispersion or shape change of the flow waveform. Pathologies such as stenoses in the proximal segments can increase the amount of dispersion of the waveforms.14
We know of no specific studies attempting to measure asymmetry of waveforms or phase in carotid or intracranial vessels, so there is no body of evidence to prove that they exist. However, examination of prior works on carotid artery hemodynamics is compatible with their existence. Ford et al15 found that after adjusting for intra- and intersubject differences in cycle-averaged volumetric flow rates, flow dynamics at the internal carotid and vertebral arteries were markedly consistent both within and between normal subjects. Yet, median differences in phase from left to right of 6.1 ms (range, 0.7–23.2 ms) were found by using a mean period of 885 ms, which represents a phase difference of less than 1% for most patients but with outliers of up to 2.6% (D. A. Steinman, communication November 2005). Asymmetries of volumetric flow rates in the carotid arteries were more pronounced, on the order of 15%–20%, and differences in waveforms observed. Because of the inherent uncertainty in the MR imaging flow waveform fitting and analysis, these differences were at or close to the limits of the technique. Similar findings, by Yim et al,12 were present in the flow waveforms in the left and right ICAs of 5 healthy subjects, quantified by using phase-contrast MR imaging techniques on a 1.5T magnet. A difference between the mean flow rates of the left and right ICAs of up to approximately 30% was measured with phase shifts of up to approximately 3% of the period of the cardiac cycle. Differences in the shape of the left and right waveforms were also observed. Because of the limitation of phase contrast MR imaging, the temporal differences were only just above the temporal resolution of the technique. The range of flow conditions selected for our study was derived from these measurements and observations.
How these changes in hemodynamics related to asymmetric flow variations affect the risk of rupture is not known. Flow patterns in AcomA aneurysms were not considered in our previously published classification, and AcomA aneurysms were not included in the previous statistical analysis9. However, the flow patterns in these 2 cases were very complex with multiple varices. If phase changes were not included, then these aneurysms would be analogous to the complex stable-flow jet patterns (type III) but, with phase or waveform asymmetries, would be analogous to the unstable complex category (type IV). This complexity and possible instability of the flow in the AcomA may explain the high incidence of aneurysms at this site. Given the complexity of the flow patterns in these 2 patients and the wide variation of geometries in the AcomA in general, one needs a larger population of aneurysms to draw any conclusions, but this preliminary analysis can provide the basis for further study.
Our analysis has several potential limitations that may affect our results. As with all computational studies, we have used some assumptions that differ from the in vivo state. These include rigid walls, Newtonian flows, and approximations for the output flows. We believe, on the basis of our prior sensitivity analysis,11 that these assumptions have only a limited effect on the intra-aneurysmal flow patterns in our models, but these effects have not been studied in AcomA systems. Despite our efforts to include as much of the associated vascular network as possible, the model is simplified by eliminating small branch vessels and truncating distal vascular beds. In addition, the outflow conditions are defined geometrically rather than by using the physiologically determined natural resistances of the vascular beds. All of these assumptions can be further refined to include more sophisticated estimates of the phenomena, but this would require information that is currently unavailable (eg, wall compliance, 4D information of vascular motion, and flow or resistance information for the runoff vascular territories). Ultimately, any model requires validation against in vivo measurements of aneurysmal hemodynamics that are not readily available using current technology. Further work to improve the vascular CFD models, characterize the errors and accuracy, and validate the models with in vivo data is needed and is the focus of our current research.
Acknowledgments
We thank Dr. Alejandro Frangi (Pompeu Fabra University, Barcelona, Spain) for interesting discussions and for providing computational resources. We also thank Dr. Peter Yim (Robert Wood Johnson Medical School, NJ) for useful discussions and critiques and for providing MR flow measurements.
Footnotes
This work was supported by Philips Medical Systems and the Whitaker Foundation.
References
- 1.Gonzalez CF, Choi YI, Ortega V. Intracranial aneurysms: flow analysis of their origin and progression. AJNR Am J Neuroradiol 1992;13:181–88 [PMC free article] [PubMed] [Google Scholar]
- 2.Ujiie H, Tachibana H, Hiramtsu O. Effects of size and shape (aspect ratio) on the hemodynamics of saccular aneurysms: a possible index for the surgical treatment of intracranial aneurysms. Neurosurgery 1999;45:119–30 [DOI] [PubMed] [Google Scholar]
- 3.Liou TM, Liou SN. A review of in vitro studies of hemodynamic characteristics in terminal and lateral aneurysm models. Proc Natl Sci Counc Repub China B 1999;23:133–48 [PubMed] [Google Scholar]
- 4.Kerber CW, Imbesi SG, Knox K. Flow dynamics in a lethal anterior communicating artery aneurysm. AJNR Am J Neuroradiol 1999;20:2000–03 [PMC free article] [PubMed] [Google Scholar]
- 5.Horiuchi T, Tanaka Y, Hongo K. Surgical treatment for aneurysmal subarachnoid hemorrhage in the 8th and 9th decades of life. Neurosurgery 2005;56:469–75 [DOI] [PubMed] [Google Scholar]
- 6.Leipzip TJ, Morgan J, Horner TG. Analysis of intraoperative rupture in the surgical treatment of 1674 saccular aneurysms. Neurosurgery 2005;56:455–68 [DOI] [PubMed] [Google Scholar]
- 7.Huber P. Cerebral Angiography. Stuttgart, Germany: Thieme;1982. :79–93
- 8.Shojima M, Oshima M, Takaqi K, et al. Magnitude and role of wall shear stress on cerebral aneurysm: computational fluid dynamic study of 20 middle cerebral artery aneurysms. Stroke 2004;35:2500–05 [DOI] [PubMed] [Google Scholar]
- 9.Cebral JR, Castro MA, Burgess JE, et al. Characterization of cerebral aneurysm for assessing risk of rupture using patient-specific computational hemodynamics models. AJNR Am J Neuroradiol 2005;26:2550–59 [PMC free article] [PubMed] [Google Scholar]
- 10.Castro MA, Putman CM, Cebral JR. Computational modeling of cerebral aneurysms in arterial networks reconstructed from multiple 3D rotational angiography images. In: Amini AA, Manduca A, eds. Proceedings of the International Society for Optical Engineering (SPIE), Medical Imaging 2005; Physiology, Function, and Structure from Medical Images, Vol 5746. April2005. :233–44
- 11.Cebral JR, Castro MA, Appanaboyina S, et al. Efficient pipeline for image-based patient-specific analysis of cerebral aneurysm hemodynamics: technique and sensitivity. IEEE Trans Med Imaging 2005;24:457–67 [DOI] [PubMed] [Google Scholar]
- 12.Yim PJ, Demarco K, Castro MA, et al. Characterization of shear stress on the wall of carotid artery using magnetic resonance imaging and computational fluid dynamics. Stud Health Technol Inform 2005;113:412–42 [PubMed] [Google Scholar]
- 13.Mazumdar J. Models of Biofluid Flows. In: Biofluid Mechanics. Singapore: World Scientific;1992. :41–78
- 14.Calamante F, Yim PJ, Cebral JR. Estimation of bolus dispersion effects in perfusion MRI using image-based computational fluid dynamics. NeuroImage 2003;19:342–52 [DOI] [PubMed] [Google Scholar]
- 15.Ford MD, Alperin N, Lee SH, et al. Characterization of volumetric flow rate waveforms in the normal internal carotid and vertebral arteries. Physiol Meas 2005;26:477–88. Epub 2005 Apr 29 [DOI] [PubMed] [Google Scholar]


