

Abstract
BACKGROUND AND PURPOSE: In amyotrophic lateral sclerosis (ALS), fiber degeneration within the corticospinal tract (CST) can be quantified by diffusion tensor imaging (DTI) as an indirect marker of upper motor neuron involvement. A new method of measuring quantitative DTI parameters using a probabilistic mixture model for fiber tissue and background in the corticospinal tract of patients with ALS is evaluated.
Materials and METHODS: Axial echo-planar imaging (EPI) DTI datasets (6 gradient directions, 10 repetitions) were acquired for 10 patients and 20 healthy control subjects. The diffusion tensor was visualized in a multiplanar viewer using a unique color coding method. Pure fiber tissue inside a region is separated from background and mixture voxels using a probabilistic mixture model. This allows for a reduction of errors as a result of partial volume effects and measurement variability.
RESULTS: Fractional anisotropy (FA) was measured within the CST at levels ranging from internal capsule to pons. Mean coefficients of variation of intrarater, scan-rescan, and inter-rater reproducibility were 2.4%, 3.0%, and 5.7%, respectively. Optimal measurement positions along the CST with respect to minimum variability and maximum difference between patients and healthy subjects were identified in the caudal half of the internal capsule. Moreover, a negative correlation between the age-corrected FA and the disease duration but not the ALS Severity scale score was found.
CONCLUSION: The new software for fiber integrity quantification is suited to assess FA in the corticospinal tract with high reproducibility. Thus, this tool can be useful in future studies for monitoring disease status and potential treatment efficiency.
Amyotrophic lateral sclerosis (ALS) is a devastating and in many cases rapidly progressive neurodegenerative disease for which there is currently no effective treatment. In the classic type of ALS, both the upper motor neurons (UMN) and lower motor neurons (LMN) are affected. Diffusion tensor imaging (DTI) is an MR imaging technique that can detect and quantify degeneration of nerve fibers. In recent years, DTI has increasingly been used as a potential quantitative measure of UMN involvement. In ALS, damage to fibers of the corticospinal tract (CST) occurs secondary to UMN destruction. The CST connects, as a major white matter tract, the cerebral motor cortex with the spinal cord. Its fibers between internal capsule and pons form a compact bundle that can be assessed by DTI. Detection of abnormalities within the CST by conventional MR imaging is limited.1,2 In contrast, DTI provides an objective quantitative marker of water diffusion within living tissue and represents a surrogate marker for active neuronal degeneration. Refining the method of DTI evaluation may improve our ability to confirm early ALS diagnosis, monitor the course of the disease, and particularly evaluate new therapeutic approaches.
DTI
In DTI-MR images image contrast is modulated by the stochastic movement of water molecules within tissue. Cellular barriers found in highly directionally ordered structures, such as nerve fibers, result in anisotropic water diffusion. This directional dependence of diffusion properties can be described by tensor mathematics. The diffusion tensor is assessed by diffusion-weighted MR imaging.3 Fractional anisotropy (FA) is a measure of the degree of directionality of diffusion. Its values range from 0 (no directional dependence of the diffusion) to 1 (diffusion along a single direction).
Since the fundamental studies of Ellis et al,4 patients with ALS have been increasingly subjected to DTI measurements. Especially in the posterior limb of the internal capsule (PLIC), a disease-related reduction of FA has been found in several studies.1,4–7
A New DTI Quantification Model
Significant differences between the absolute FA values can be found in groups of age-matched healthy control subjects in several studies.1,4,5,8 This reflects the variety of the procedures of data acquisition, postprocessing, and data analysis and superimposes the biologic variability of FA. Until now, there has been no standard DTI analysis. Most current studies use region of interest (ROI) approaches for FA quantification, which often include manual ROI delineation in combination with coregistered anatomic MR imaging series. These procedures are vulnerable to mismatch problems, partial volume errors by non-CST contaminations, and interobserver differences. The clinical relevance of quantifying the precision of DTI measures has been emphasized by several authors and was assessed for the corpus callosum and recently for the hippocampus.9,10 To our knowledge, the reliability of the current methods of FA quantification in the CST has not yet been described.
In this study, we used a probabilistic mixture model that allowed robust assessment of DTI data. The details of the model have been described in recent publications.11,12 In brief, voxels inside a ROI surrounding the investigated fiber bundle are classified as belonging to: 1) pure fiber, 2) pure background, or 3) a partial volume class that is a mixture of fiber and background. As has been shown recently in the corpus callosum, this procedure makes the results largely independent of observer-specific choices of the ROI.13
In this study, we quantified the fiber integrity at different locations of the corticospinal tract of patients with ALS and healthy control subjects. The aim was to assess the reproducibility of FA and to optimize the analysis with respect to the measurement location.
Materials and Methods
Subjects
Ten patients (4 women, 6 men) aged from 36 to 76 years (mean ± SD, 55 ± 13 years) were classified according to the El Escorial Criteria14 as having clinically definite ALS. They were staged using the ALS Severity (ALSS) scale,15 ranging from 0 to 40 points; 40 points means the best clinical outcome. The subscales (each with 1 to 10 points) include speech, swallowing, lower extremities (walking), and upper extremities (dressing and hygiene). The scale is fast and reliable and is optimized for assessment of disease severity. The patients ranged between ALSS 16 and 34 (mean ± SD, 28 ± 5). The disease duration was 12 to 60 months (mean ± SD, 30 ± 19).
Twenty control subjects (9 women, 11 men) were free of chronic or acute neurologic or psychiatric diseases. They had no regular drug intake, and a standard neurologic examination revealed regular findings in all. The age range was 26–76 years (mean ± SD, 48 ± 16).
All study subjects had no contraindications for MR imaging and received the same measurement protocol. Written informed consent to participate in the study was obtained from all participants, and the local institutional review board approved the study.
Clinical examinations and enrollment of study subjects was done by an experienced senior neurologist. Data analysis and evaluation was performed by 3 experienced raters: a senior radiologist, a medical physicist, and a senior neurologist.
MR Imaging Protocol and Data Processing
MR imaging data were acquired on a 1.5T MR system with 30 mT/m maximum gradient strength using a quadrature head coil. Involuntary head movement was limited by lateral fixation. DTI was performed using a single-shot 2D EPI sequence (TR, 8500 ms; TE, 109 ms; section thickness, 2.5 mm; matrix, 128 × 128; resolution, 2.5 × 2.5 mm; acquisition time, 1 minute 10 seconds) resulting in 1 image without and 6 with diffusion weighting (b = 1000 s/mm2) in distinct noncoplanar gradient directions. Forty-seven contiguous axial sections were acquired to cover the whole brain down to the brain stem. All subjects received additional anatomic imaging according to a standardized MR imaging protocol that provided standardized positioning and control for image quality and abnormalities.
To increase signal-to-noise ratio (SNR) in the diffusion tensor images, data acquisition was repeated 10 times. Image quality was checked by calculation of the SNR in single nonaveraged DTI datasets with b = 0. Furthermore, images were evaluated visually to exclude images with large distortion or ghosting.
MR images were processed, visualized, and analyzed with software modules implemented in MeVisLab (MeVis, Bremen, Germany). The repeated DTI datasets were resampled to a matrix of 1.25-mm isotropic resolution, spatially matched, and averaged. The diffusion tensor was reconstructed from the resulting DTI dataset as described by Schlüter et al.11
DTI Parameter Quantification with the New Model
To separate neighboring fibers, we used the optimal color coding method, which has been described elsewhere.11,12 This method assigns the main principal eigenvector directions of the voxels in a complete image or a predefined region to a color scale. Local ambiguity of the coding is minimized by an automatic optimization of the projection plane. It can be used iteratively from large to smaller ROI to separate different projectional fibers. In detail, the process of DTI quantification is as follows.
In a first step, the color-coded DTI dataset is displayed in a 3D viewer, where an evaluation plane can be chosen at arbitrary levels orthogonal to the CST (Fig 1). Optimal color coding within the PLIC leads to a visually well detectable color (red) of the central part that is clearly different from the colors of the surrounding fibers. Thus, the central part of the PLIC can be well delineated by a smaller ROI for further classification (Fig 2). In the more caudal evaluation planes within the CST, no different projectional fibers with similar main direction could be identified.
Fig 1.
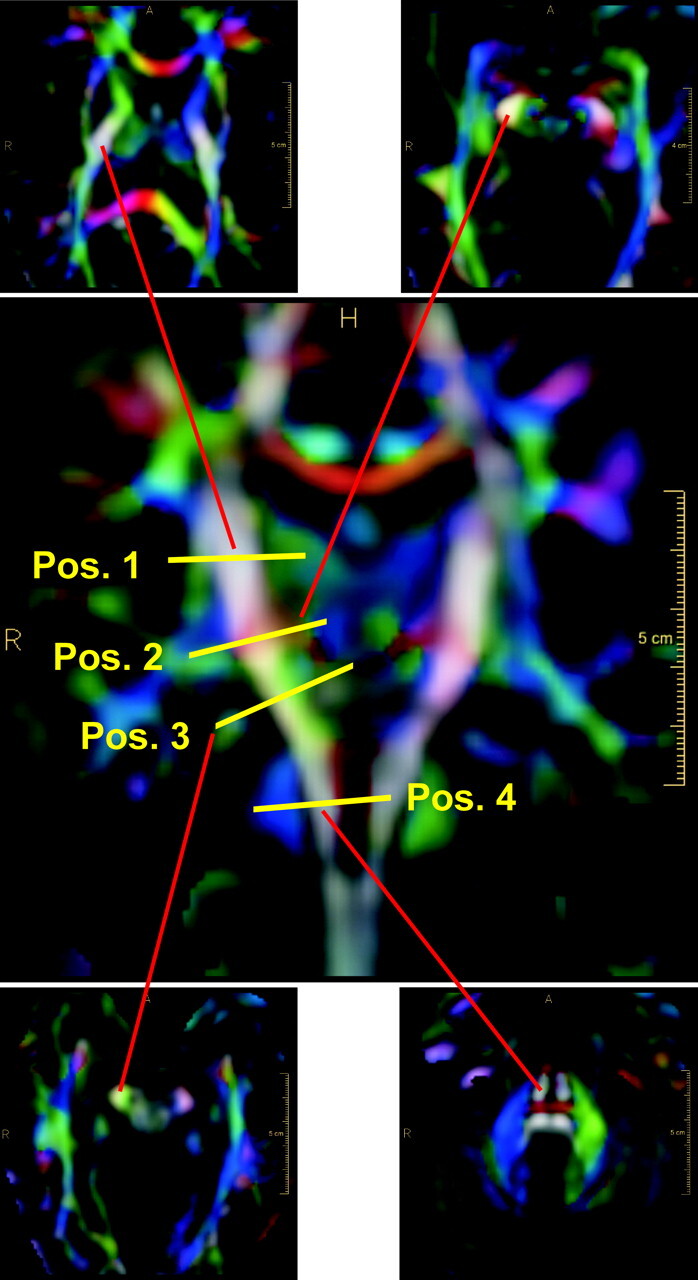
Definition of the evaluation planes along the CST. Coronal view depicts the definition of positions 1 to 4. Axial views show the corresponding reformatted sections. The end points of the red lines correspond to the right CST location within the axial sections.
Fig 2.

FA quantification procedure. Optimal color-coding in the right branch of the CST at the level of the internal capsule. Top, ROI delineation with fiber bundles of interest (red) and the bordering fibers (green, blue). Bottom left, probability map of ROI; yellow, light green, and blue area voxels belong to fiber, background, or mixture tissue, respectively.
In a second step, a ROI is placed that coarsely circumscribes the voxels containing the selected fiber tissue plus the surrounding background voxels. The probabilistic mixture model is applied to the voxels inside the ROI. Partial volume effects are explicitly modeled by a uniformly distributed mixture of the 2 pure tissue classes (“fiber” and “nonfiber”). The model parameters are adapted to the ROI histogram of the diffusion anisotropy by a maximum likelihood mixture model clustering algorithm.16,13 After clustering inside the fiber of interest, arbitrary combinations of the eigenvalues of the diffusion tensor (eg, FA or other quantitative DTI parameters) can be calculated.
Figure 2 shows the quantification procedure at the PLIC, including optimal color coding, ROI delineation, and clustering. In our study, FA in a specific ROI was calculated as the mean value in the “pure fiber” class (yellow). The total postprocessing time for quantification of FA at a specific level of the CST was less than 2 minutes.
ROI Positioning along the CST
The path of the CST was identified on the DTI color map with evaluation planes chosen orthogonal to the main fiber direction at different levels of the left and right branch. The datasets were evaluated either section-by-section in 1.25-mm steps along the CST or at 4 distinct levels (Fig 1). Position 1 is at the center of the internal capsule at the level of the maximal medial extension of the left and right thalamus, position 2 is at the caudal border of the internal capsule at the level of the medial bend of the CST (as can be located in the coronal view), position 3 is in the midbrain at the level of the cerebral peduncles, and position 4 is at the mid-pons level as seen in the sagittal view.
At position 1, the CST fibers were located and evaluated in the PLIC. We chose ROIs in the posterior half of the PLIC in accordance with findings of Holodny et al16 (Fig 2). At positions 2, 3, and 4, ROIs were chosen to circumscribe all CST fiber voxels. In Fig 1, the end points of the red lines correspond to the right CST location within the axial sections.
SNR
Image quality was checked by calculation of the SNR in single nonaveraged DTI datasets with b = 0. SNR was defined as the ratio of the mean MR image signal intensity in the posterior limb of the internal capsule to the SD of the signal intensity in a background ROI outside the brain. A SNR of at least 20 has been recommended for a reliable quantification of DTI parameters.17
Reproducibility of FA
The coefficients of variation (CV) of repeated measurements (intrarater, scan-rescan, inter-rater) were calculated according to the method of Bland and Altman.18
Intrarater Variability.
The intrarater variability was assessed by 19 double measurements of FA on 1 control subject at positions along the left and right branches of the CST, ranging from the upper margin of the internal capsule down to the cerebral peduncles. The CV was calculated as the mean of the absolute differences of the data pairs divided by the mean of all FA values. The data were evaluated by 1 observer with a time interval of at least 1 week between the measurements.
Scan-Rescan Variability.
To measure the scan-rescan variability, 1 normal control subject was scanned 2 times 1 week apart. The orientation of the image blocks was varied slightly to simulate the variability of realistic imaging conditions: in the first scan, the sections were aligned parallel to the lower borders of the corpus callosum; in the second scan, an orientation orthogonal to the posterior border of the brain stem was chosen. The resulting position differences between the scans were compensated by linear scaling with respect to the CST location of the pons and position 2 (Fig 1). FA was evaluated by 1 observer at 23 positions along the CST ranging from internal capsule to the cerebral peduncles. Scan-rescan CV was calculated from the differences of the data pairs.
Inter-Rater Variability.
The inter-rater variability was assessed by 3 independent observers on 2 healthy subjects and 2 patients with ALS. FA was measured at the typical measurement positions 1 to 4 along the CST each in 3 adjacent sections (Fig 1). All combinations of data pairs at each position were analyzed, and the CVinter-rater was calculated from the differences of the data pairs in all subjects.
Optimization of the Measurement Position along the Pyramidal Tract
To optimize the evaluation position, the DTI datasets of 2 patients with ALS and 2 control subjects were evaluated in small steps of 1.25 mm along the CST, ranging from the upper border of the internal capsule to the middle of the pons. The CST was covered by 25 to 30 measurements of FA on both the left and right branches. For comparison of the courses of the quantitative DTI parameters, the data of each subject were transformed linearly to a uniform position scale with respect to the CST locations of the pons (as the origin of the scale) and position 2.
Age-Correction of the FA Results
Age dependence of the FA results of the control group was modeled by linear regression, to account for an age correction of the data. An age-correction operation was performed by linear scaling according to the linear regression of the control group on all data, assuming that the patient data were subjected to the same age dependence as the control subjects.
Analysis of Group Differences between Patients with ALS and Control Subjects
The statistical significance of the group differences between patient and control group of the age-corrected mean FA values was evaluated by unpaired t testing and by the “difference versus SD ratio” (DSR). The DSR is the ratio of the difference of the mean FA between the patient and control groups and the SD of the control group. It is a composite measure of the significance of the measured group difference and the stability of the measurement; if 2 evaluation strategies yield the same mean intergroup difference, then the evaluation method with the lower variability should be preferred.
Corrrelation of FA with Clinical Disease Status
Because the patients with ALS in this study presented at different stages of the disease, a high intersubject FA variability had to be expected. Although it was no major aim of this study to use DTI to stage ALS, we analyzed our data for a correlation between FA and disease stage and duration. The dependence of the age-corrected FA on disease status and duration was examined by bivariate correlation analysis with the ALSS score as well as disease duration. All statistical tests were performed at the level of significance of 5% using SPSS software (ver. 12; SPSS, Chicago, Ill).
Results
SNR
Signal-to-noise gain due to averaging (n = 10) was considered by multiplication by (n). SNR was calculated for 10 control subjects and 10 patients and ranged from 51 to 63. This exceeds the SNR minimum of 20, which has been recommended for a reliable DTI quantification.17
Reproducibility of FA Quantification
Intrarater, scan-rescan, and inter-rater reproducibilities of the FA measurements are shown in Table 1 by the CV, the mean variability, and mean values of FA. Regarding intrarater and scan-rescan reproducibility, the values were calculated for the mean of all measurements at all positions along the CST. The inter-rater reproducibility was differentiated further and is presented for the mean of all positions and for the single positions 1 to 4. The CV at the positions 1 and 2 was significantly smaller than at the positions 3 and 4. This indicated that positions 1 and 2 are probably superior measurement locations for DTI quantification.
Table 1:
Intrarater, scan-rescan, and inter-rater variability of FA measurements along the CST
| Mean of All Positions |
Inter-Rater Variability at Different Positions along the CST |
||||||
|---|---|---|---|---|---|---|---|
| Intrarater | Scan-Rescan | Inter-rater | 1 | 2 | 3 | 4 | |
| CV | 2.4% | 3.0% | 5.7% | 4.5% | 4.6% | 7.9% | 6.0% |
| Mean value of abs. differences | 0.016 | 0.020 | 0.034 | 0.028 | 0.030 | 0.051 | 0.030 |
| FAmean | 0.67 | 0.66 | 0.602 | 0.619 | 0.658 | 0.642 | 0.492 |
Note:—FA indicates fractional anisotropy; CST, corticospinal tract; CV, coefficient of variation defined as mean value of absolute differences divided by FAmean; FAmean, mean value of FA measurements of the respective variability assessment. See Fig 1 for definition of positions 1 to 4.
Optimization of the Measurement Position
Figure 3 shows typical courses of FA along the CST for 2 patients with ALS (triangles) and 2 healthy control subjects (circles) dependent on the normalized distance to the pons for the left and right branches of the CST. The 4 gray bars mark the different ranges, which have been identified as positions 1 to 4 in all measurements.
Fig 3.

Individual FA courses along the CST. Circles, healthy subject 1 and healthy subject 2; triangles: patient 1 and patient 2. Gray bars mark the ranges of position 1 to 4.
The gross course of FA is similar in all analyzed subjects: from the center of the internal capsule (position 1) to the midbrain (position 3), there is an increase in FA with few individual local maxima. Below position 3, there is a steep decrease of FA down to position 4. At the level of the pons (position 4), we find high variability of FA. Comparing the 2 patients with the 2 control subjects, we find good agreement of FA values at the positions 1, 2, and 3 for the healthy subjects, whereas there are differences between the patient results depending on position and side (left/right).
Thus positions 1 and 2 seem to be best suited for DTI evaluation because FA has a small increase in these ranges. Position 3, on the other hand, is not well suited because it lies within the range of steep slope of the FA curve, so that small variations in position can result in high FA changes. Position 4 also seems to be less well suited to FA quantification because of high FA variability.
Based on these results, we concentrated our further evaluation on positions 1 and 2. Because FA courses still showed local maxima and minima in this range we compared the following evaluation strategies: FA mean value calculated from 3 adjacent sections: A) in position 1, B) in position 2, C) in the middle position between positions 1 and 2, and D) within the range between positions 1 and 2.
Patient and Control Data
Optimal Evaluation Strategy under Consideration of the Age Dependence of FA.
We studied FA results by all 4 evaluation methods regarding age dependency. Figure 4 shows the scatter plots of FA versus age, including the linear regression lines of the control group. The FA values of the control subjects showed an age-dependent decrease of −0.10%–0.21% per year (evaluation method A, −0.11%; B, −0.21%; C, −0.17%; D, −0.10%). We found no sex-specific differences within the results of the control subject group (data not shown.). The interindividual variability of FA in the control group was considerably lower when using evaluation method C than with the other evaluation strategies. The ±95% confidence range of the regression was 0.03 in C compared with 0.06 (A), 0.07 (B), and 0.08 (D) respectively. Thus, from the point of view of maximal stability of measurement results, evaluation strategy C (ie, FA measurement at the center between positions 1 and 2) seems to be optimal for quantification of FA in the CST.
Fig 4.

FA as measured using evaluation strategies. A, B, C, and D are dependent on subject age. Mean values of corresponding measurements in the left and right branch of the CST. Black circles, control group. Gray circles, patients with ALS. Lines, linear regression of the control group with 95% confidence range.
In the patient group, because of the variability of disease-induced effects, the range of measured FA values was generally broader than in the group of healthy control subjects. The quality of discrimination between the patient group and the control group gained by the different evaluation strategies was further evaluated by examining the age-corrected data.
In Table 2, the age-corrected mean FA values and SDs of the patient and control groups were compared for the different evaluation strategies. The statistical significance of the group differences and the DSR were also denoted. Although the group differences gained by evaluation strategies A and C were both highly significant, strategy A showed the most significant differences. However, the DSR was clearly highest when using strategy C, because of the very low variability of FA results in the control group. Although evaluation strategy B also led to significant group differences, the results were less satisfactory because of the high SD of the control group results. Strategy D yielded no significant difference between the patient group and the control group.
Table 2:
Age-corrected mean FA for patient and control groups by different evaluation strategies
| Group | Evaluation Strategy |
||||
|---|---|---|---|---|---|
| A | B | C | D | ||
| FAmean | Patients (n = 10) | 0.644 ± 0.049 | 0.728 ± 0.075 | 0.693 ± 0.076 | 0.672 ± 0.064 |
| (Age corrected) ± SD | Control subjects (n = 20) | 0.694 ± 0.045 | 0.770 ± 0.048 | 0.732 ± 0.020 | 0.691 ± 0.045 |
| Significance of group difference | P = .001 | P = .011 | P = .004 | P = .162 | |
| DSR | 1.12 | 0.86 | 1.96 | 0.43 | |
Note:—FA indicates fractional anisotropy; FAmean, mean value of FA measurements of the respective variability assessment; DSR, difference vs SD ratio.
In summary, the evaluation strategies A and C (ie, FA measurement at position 1 and at the center between positions 1 and 2, respectively) both seem well suited to monitor disease-related changes in FA in the CST of patients with ALS. Whether the more prominent FA differences between patients and control subjects (strategy A) or the superior stability of the FA measurements as in strategy C are advantageous in clinical studies cannot be decided at this point.
Correlation between FA and Clinical Parameters after Age Correction of the Data.
We used evaluation strategies A and C for FA quantification and corrected for age as described above. Bivariate correlation analysis between the age-corrected FA and the ALSS score as well as the disease duration revealed a significant correlation between FA and the disease duration for both evaluation strategies (P = .011 and P = .010 strategy A and C, respectively) with the Pearson correlation coefficient r = −0.543 and −0.589, respectively. In contrast no significant correlations between FA and the ALSS score (P = .79 and P = .68, respectively) were found.
Discussion
DTI assessment of fiber integrity in the CST of patients with ALS has the potential to give valuable quantitative information about the involvement of UMN in this disease. Most current methods use an ROI-based approach, whereas the fiber-containing areas are identified on coregistered anatomic MR imaging series.1,4,5,8,10,19 This is a time-consuming process that is subject to measurement errors and partial volume effects as a result of the small fiber calibers and usually poor image resolution of the DTI series.
The probabilistic mixture model for DTI quantification used in this study11,13 is applied directly on the DTI dataset. The optimal planar color-coding scheme of the DTI-based color maps visualizes small differences in fiber directionality even where different fiber bundles lie directly adjacent to each other. The mixture model uses an automatic classification of voxels inside an ROI as fiber, nonfiber, or mixture. The complete procedure of FA quantification at a selected location takes less than 2 minutes.
In the present study, the probabilistic mixture model was evaluated in the CST. To our knowledge, this is the first study in which the reproducibility of a DTI quantification method on the CST has been investigated.
The high stability and reproducibility of FA assessment by the model was shown. The inter-rater reproducibility of FA measurement at single selected levels ranged from 4.5% (PLIC) to 7.9% (midbrain), which corresponds to an absolute FA variability of ±0.028 to ±0.051 respectively. This variability represents the sensitivity limit for the detection of FA changes within the CST in a realistic clinical setting with several evaluators. For a valuable application as a diagnostic tool, it is certainly important that DTI can monitor early ALS effects. So far, however, there is only very limited information about FA decrease rates in the longitudinal course of ALS.6 Further longitudinal studies with a larger number of patients are necessary before the suitability of DTI quantification methods for early disease monitoring of ALS can be sufficiently evaluated.
We found the course of FA, from the PLIC through the cerebral peduncles to the pons, is in accordance with that reported for other studies.2,5,19 High FA values as found in the PLIC are interpreted to result from coherent, tightly packed fibers. Below the cerebral peduncles, many fibers leave the CST, leading to an FA decrease. At the level of the pons, the CST splits into multiple smaller bundles, which results in increased measurement variability, as we have found in the pons.20
Our optimization of the measurement location showed that FA should be quantified at the level of the caudal half of the PLIC. This region is probably characterized by an especially high CST fiber density. The result corresponds well to a recent study by Abe et al,7 who located significant group differences between patients with ALS and control subjects in the caudal part of the PLIC by voxel-based morphology. Measurement at the center of the internal capsule (strategy A) and at the caudal border of the internal capsule (strategy C) were clearly superior to the other evaluation strategies, whereas strategy C had the best reproducibility of FA measurement. The 2 superior measurement positions are defined by 2 anatomically well defined locations of the CST (Fig 1). They can be located precisely and are thus methodologically suited for intersubject comparisons and longitudinal studies.
The control group data revealed a considerable linear decrease of FA with increasing age (−0.11% per year for A and −0.17% per year for C), which has to be taken into account when results are classified as normal or abnormal. This age dependence has also been described in a study by Salat et al,20 who reported an FA decrease of −0.2% per year within the PLIC. The normal FA values decrease from FA = 0.70/0.67 (evaluation strategies C/A) at the age of 20 years to FA = 0.60/0.61 at 80 years, with a variability of ± 0.03/± 0.06. Disregarding the subject's age, FA values below 0.57/0.55 (evaluation strategies C and A) can be classified as abnormal.
Our preliminary analysis revealed a significant correlation between the age-corrected FA results and the duration of the disease but not the ALSS score. In general, this agrees with other studies in which a disease-related FA decrease within the PLIC has been described.1,4,5,6 Regarding the correlation between the DTI parameters and clinical disability scores, there are inconsistent results in the different studies in literature. There are several possible explanations for the lack of correlation between the disease status and FA in this study: the ALSS score is estimated by several clinical findings, including LMN signs, and may be relatively unspecific for CST involvement. ALS-related pathology in the CST can be heterogeneous in grade and location,2,8 such that a larger patient population is a prerequisite for statistically significant results.
There are other methodologic study limitations: small caliber fibers cannot be quantified reliably by the method because dominant partial volume effects prevent the classification of “pure-fiber” voxels. Acquisitions with a higher image resolution could reduce this effect. Different projectional fibers with the same FA and direction that lie adjacent to each other cannot be distinguished by the optimal color-coding method. In such structures as the brain stem, which is transversed by numerous major motor and sensory white matter fibers, this can affect the reliability of DTI quantification.
Conclusion
The probabilistic mixture model is well suited for DTI quantification in the CST. The processing time is relatively low, and its high reproducibility and stability have been shown. It is an important future challenge to develop uniform standards of evaluation in the growing field of clinical DTI applications to allow for multicenter comparisons. In particular, the need for highly reproducible and robust quantification procedures will emerge should effective treatment options for ALS be found. In this study, we have established a valuable basis for further DTI studies in the CST on a larger number of patients with motor neuron diseases such as ALS.
References
- 1.Graham JM, Papadakis N, Evans J, et al. Diffusion tensor imaging for the assessment of upper motor neuron integrity in ALS. Neurology 2004;63:2111–19 [DOI] [PubMed] [Google Scholar]
- 2.Wang S, Melhem ER. Amyotrophic lateral sclerosis and primary lateral sclerosis: the role of diffusion tensor imaging and other advanced MR-based techniques as upper motor neuron markers. Ann NY Acad Sci 2005;1064:61–77 [DOI] [PubMed] [Google Scholar]
- 3.Basser PF, Pierpaoli C. Microstructural and physiological features of tissue elucidated by quantitative diffusion-tensor MRI. J Magn Reson B 1996;111:209–19 [DOI] [PubMed] [Google Scholar]
- 4.Ellis CM, Simmons A, Jones DK, et al. Diffusion tensor MRI assesses corticospinal tract damage in ALS. Neurology 1999;53:1051–58 [DOI] [PubMed] [Google Scholar]
- 5.Toosy AT, Werring DJ, Orrell RW, et al. Diffusion tensor imaging detects corticospinal tract involvement at multiple levels in amyotrophic lateral sclerosis. J Neurol Neurosurg Psychiatry 2003;74:1250–57 [DOI] [PMC free article] [PubMed] [Google Scholar]
- 6.Jacob S, Finsterbusch J, Weishaupt JH, et al. Diffusion tensor imaging for long-term follow-up of corticospinal tract degeneration in amyotrophic lateral sclerosis. Neuroradiology 2003;45:598–600 [DOI] [PubMed] [Google Scholar]
- 7.Abe O, Yamada H, Masutani Y, et al. Amyotrophic lateral sclerosis: diffusion tensor tractography and voxel based analysis. NMR Biomed 2004;17:411–16 [DOI] [PubMed] [Google Scholar]
- 8.Cosottini M, Giannelli M, Siciliano G, et al. Diffusion-tensor MR imaging of corticospinal tract in amyotrophic lateral sclerosis and progressive muscular atrophy. Radiology 2005;237:258–64 [DOI] [PubMed] [Google Scholar]
- 9.Pfefferbaum A, Adalsteinsson E, Sullivan EV. Replicability of diffusion tensor imaging measurements of fractional anisotropy and trace in brain. J Magn Reson Imaging 2003;18:427–33 [DOI] [PubMed] [Google Scholar]
- 10.Müller MJ, Mazanek M, Weibrich C, et al. Distribution characteristics, reproducibility, and precision of region of interest-based hippocampal diffusion tensor imaging measures. AJNR Am J Neuroradiol 2006;27:440–46 [PMC free article] [PubMed] [Google Scholar]
- 11.Schlüter M, Stieltjes B, Rexilius J, et al. Unique planar color coding of fiber bundles and its application to fiber integrity quantification. IEEE International Symposium on Biomedical Imaging; 2004 Apr 15–18; Arlington, Va. Available at: http://ieeexplore.ieee.org/xpl/freeabs_all.jsp?arnumber=1398684
- 12.Schlüter M, Stieltjes B, Hahn HK, et al. Detection of tumor infiltration in axonal fiber bundles using diffusion tensor imaging. Int J Med Robot Comp Assist Surg 2005;1:80–86 [DOI] [PubMed] [Google Scholar]
- 13.Stieltjes B, Schlüter M, Didinger B, et al. Diffusion tensor imaging in primary brain tumors: reproducible quantitative analysis of corpus callosum infiltration and contralateral involvement using a probabilistic mixture model. Neuroimage 2006;31:531–42 [DOI] [PubMed] [Google Scholar]
- 14.Brooks BR, Miller RG, Swash M, et al. World Federation of Neurology Research Group on Motor Neuron Diseases. El Escorial revisited: revised criteria for the diagnosis of amyotrophic lateral sclerosis. Amyotroph Lateral Scler Other Motor Neuron Disord 2000;5:293–99 [DOI] [PubMed] [Google Scholar]
- 15.Hillel AD, Miller RM, Yorkston K, et al. Amyotrophic lateral sclerosis severity scale. Neuroepidemiology 1989;8:142–50 [DOI] [PubMed] [Google Scholar]
- 16.Holodny AI, Gor DM, Watts R, et al. Diffusion-tensor MR tractography of somatotopic organization of corticospinal tracts in the internal capsule: initial anatomic results in contradistinction to prior reports. Radiology 2005;234:649–53 [DOI] [PubMed] [Google Scholar]
- 17.Hunsche S, Moseley ME, Stoeter P, et al. Diffusion-tensor MR imaging at 1.5 and 3.0 T: initial observations. Radiology 2001;221:550–56 [DOI] [PubMed] [Google Scholar]
- 18.Bland JM, Altman DG Statistical methods for assessing agreement between two methods of clinical measurement. Lancet 1986;8: 1(8476):307–10 [PubMed] [Google Scholar]
- 19.Stieltjes B, Kaufmann WE, van Zijl PC, et al. Diffusion tensor imaging and axonal tracking in the human brainstem. Neuroimage 2001;14:723–35 [DOI] [PubMed] [Google Scholar]
- 20.Salat DH, Tuch DS, Greve DN, et al. Age-related alterations in white matter microstructure measured by diffusion tensor imaging. Neurobiol Aging 2005;26:1215–27 [DOI] [PubMed] [Google Scholar]