

Abstract
BACKGROUND AND PURPOSE: Neuroimaging techniques have the potential to improve acute stroke treatment by selecting the appropriate patients for thrombolytic therapy. In this study, we examined changes in cerebral blood flow (CBF) and cerebral blood volume (CBV) in an animal model of middle cerebral artery occlusion and used these to identify the parameters that best differentiate between oligemic and infarct regions.
MATERIALS AND METHODS: Permanent middle cerebral artery occlusion was performed in 17 New Zealand white rabbits. CT perfusion imaging was performed before (baseline), 10, and 30 minutes after the stroke, and then every 30 minutes up to 3 hours. After a final scan at 4 hours, the brain was removed, cut corresponding to CT sections, and stained with 2,3,5-triphenyltetrazolium chloride (TTC) to identify infarcted tissue. A logistic regression model with the 4-hour post-CBF and -CBV values as independent variables was used to determine the binary tissue outcome variable (oligemia or infarction).
RESULTS: Infarcted regions were characterized by a significant decrease (P < .005) in both CBV and CBF, whereas oligemic (CBF < 25 mL · 100 g−1 · min−1, not infarcted) regions showed a significant decrease (P < .005) in CBF with maintenance of CBV at or near baseline values. From the perfusion parameters at the 4-hour time point, logistic regression by using CBV*CBF resulted in a sensitivity of 90.6% and a specificity of 93.3% for infarction.
CONCLUSION: CBF and CBV values obtained from CT perfusion imaging can be used to distinguish between oligemic and infarct regions. This information could be used to assess the viability of ischemic brain tissue.
Stroke is the third leading cause of death and the leading cause of disability in North America.1 Ischemic tissue resulting from a stroke can be classified as either infarct, if the tissue cannot be salvaged, or penumbra, if the tissue remains viable.2 Studies suggest that penumbral tissue may remain viable in some patients for as long as 12 hours after stroke onset.3,4 If the progression to infarction cannot be stopped, the infarct may eventually expand to include penumbral tissue.5,6 Tissue plasminogen activator (tPA) is the only approved drug treatment for patients with acute stroke and has shown significant benefits in clinical trials if administered intravenously within 3 hours of stroke onset.7 Imaging techniques have the ability to improve patient selection for tPA therapy by selecting patients most likely to benefit from thrombolysis.4,7–9 CT perfusion imaging has emerged as one potential tool to aid in the diagnosis and treatment of acute stroke patients.10,11 It is easy to perform, cost effective, and, because of the accessibility of CT scanners at most hospitals, readily available to a large portion of the population.
An animal model offers 2 distinct benefits over a clinical study. It allows: 1) multiple CT perfusion studies in the first few hours of stroke; and 2) accurate identification of the infarct with 2,3,5-triphenyltetrazolium chloride (TTC) staining immediately after imaging is completed, preventing further progression of penumbra to infarct as would be the case in clinical studies using imaging at 1–3 weeks to identify the infarct. In this study, we assessed the changes in CT perfusion derived cerebral blood flow (CBF) and cerebral blood volume (CBV) over the first 4 hours of middle cerebral artery embolization in a rabbit model of embolic stroke. In addition, we attempted to determine which parameters (CBF, CBV, CBF×CBV) provided the best differentiation between infarct and oligemia 4 hours after embolization. We hypothesized that the product of CBF×CBV would result in the best separation between infarct and oligemia data points because of the matched decrease in both parameters (decreased CBF, decreased CBV) for infarction and the mismatch expected for oligemia (decreased CBF, normal/increased CBV).
Materials and Methods
Rabbit Vascular Anatomy and Circulation
The cerebral vascular anatomy of the New Zealand white rabbit is similar to that of humans, with CBF values of approximately 40–75 mL · 100 g−1 · min−1.12–14 The rabbit has a complete Circle of Willis, with anterior and middle cerebral arteries arising from the internal carotid artery. The 2 vertebral arteries fuse to form the basilar artery, which then divides into 2 posterior cerebral arteries, which anastomose with the internal carotid system through the posterior communicating artery.15 One difference from humans is that the rabbit anterior cerebral arteries merge into a common artery for the rabbit, replacing the need for an anterior communicating artery. Another notable difference in rabbits is that the anterior cerebellar artery arises from the posterior cerebral artery.15 Angiography of the isolated rabbit brain has shown 50–100-μm anastomoses between major vascular territories on the convexity of the cerebrum.16 Extracranial to intracranial filling occurs via the anastomosis between the internal and external ophthalmic arteries.16 Overall, the cerebral circulation of the rabbit is similar to the human; the major difference is the fusion of anterior cerebral arteries into a single vessel.
Surgical Procedures
All surgical and experimental protocols met Canadian Council of Animal Care guidelines and were approved by the animal use subcommittee. Twenty-one male New Zealand white rabbits (2.8–3.5 kg) underwent surgical preparation for the introduction of an embolus into the left middle cerebral artery. Four animals were excluded from analysis for the following reasons: 1 animal died during surgical preparation; CT hardware problems did not allow data acquisition for 1 animal; and 2 animals did not shows signs of ischemia on imaging or infarction on tissue sections. Animals were anesthetized with 4% isoflurane gas (Abbott Laboratories, Abbott Park, Ill) in medical air and oxygen for shaving and cleaning. Catheters were placed in the femoral artery, femoral vein, and ear vein to allow for physiologic monitoring, introduction of contrast agent, and administration of drugs. Autologous arterial blood was used to fill 3 thrombin-coated capillary tubes (Thrombostat; Sigma-Aldrich, St Louis, Mo). After tracheotomy, mechanical ventilation was initiated, and a muscle relaxant (vecuronium bromide, 0.2 mg/kg; Organon, Scarborough, Canada) was administered to prevent spontaneous breathing; anesthesia was maintained with isoflurane gas (2.0%–2.5%). Temperature was monitored with a rectal probe thermometer and maintained between 38°C and 39.5°C with a circulating water blanket.
The contralateral internal carotid artery was exposed, and an inflatable vascular occluder (In Vivo Metric, Healdsburg, Calif) was placed around the vessel but not inflated. Occlusion of the contralateral internal carotid artery was performed in 4 5-minute intervals immediately after the embolus was delivered to the middle cerebral artery to improve consistency of infarct. The ipsilateral (left) external carotid artery was exposed, ligated, and transected, and a 22-gauge catheter was inserted retrogradely through the external carotid artery and advanced into the internal carotid artery. After surgical preparation, the animals were placed in a standardized supine position in a custom Plexiglas jig on the CT couch and the baseline CT perfusion imaging was performed. A 10-mm embolus was removed from the capillary tubes and deposited into the left middle cerebral artery with 1.5 mL of saline through the catheter previously placed in the ipsilateral internal carotid artery.
CT Imaging Procedures
All imaging was performed with a LightSpeed Plus 4 section CT scanner (GE Healthcare, Milwaukee, Wis). Scanning was performed at 120 kVp, 40 mA, and 1-s rotation speed with a 512 × 512 matrix, 12-cm FOV, and 5-mm section thickness. Tissue section location was determined and standardized in a preliminary group of animals by using a brain matrix specifically for adult rabbit brains (RBM-7000S; ASI Instruments, Warren, Mich). Head orientation and CT section location were selected to match these standardized tissue sections. Measurements in the x, y, and z directions in the CT images and tissue sections were used to confirm consistency between the 4 sections chosen for imaging and histology. Nine CT perfusion scans were performed for each animal: a baseline scan before the stroke, 10 and 30 minutes after the stroke, and every 30 minutes for 3 hours, with a final scan at 4 hours. All CT perfusion scans consisted of a continuous scan for 25.5 seconds with a bolus injection of 5 mL of iodinated contrast agent (iohexol [Omnipaque], 300 mg/mL; GE Healthcare, Piscataway, NJ) at a rate of 1 mL/s into the femoral vein (automatic injector [Medrad, Indianola, Pa]) beginning at the same time as the scan. Ninety-nine images at an interval of 0.25 seconds were acquired over 25.5 seconds for each of the 4 sections while the CT couch remained stationary. Mean arterial pressure, heart rate, and end tidal expired CO2 were monitored throughout the study. Before each of the contrast-enhanced CT scans, an arterial blood sample was drawn to measure arterial O2, CO2, and blood glucose levels. Ventilation rate and volume were adjusted to maintain end tidal carbon dioxide levels between 36 and 44 mm Hg.
CT perfusion imaging is based on the principle that pixel enhancement (measured in Hounsfield units [HU]), after an injection of an intravascular tracer, will increase linearly with tracer concentration. After injection of a tracer into a peripheral vein, the preselected sections are rapidly scanned while the CT couch remains stationary, capturing the baseline (before contrast arrival), enhancement, and the washout phases of the transit of contrast through the brain. After scanning is complete, time attenuation (enhancement) curves are obtained for an input artery (arterial input function) and a draining vein (venous time attenuation curve), such as the superior sagittal sinus (Fig 1). Arterial and tissue curves are determined relative to the baseline images and therefore sequential CT perfusion imaging should have no effect on the quantitative values that were obtained.
Fig 1.

Time attenuation curves from CT perfusion study of a rabbit showing enhancement (above baseline value) of various regions over the 99 sequential images acquired. Arterial and venous time-attenuation curves (A) and tissue time-attenuation curves (B) for 9-mm2 regions of interest in the ischemic hemisphere and contralateral hemisphere.
Arterial contrast concentration curves were obtained by drawing a 2 × 2 pixel region on the internal carotid artery on each of the 4 sections where it was present, as previously described and validated.17 The potential for increased partial volume averaging of the input function exists because of the smaller vessel size in rabbits compared with humans. Two factors that compensate for this difference are the use of a smaller field of view (12 cm) and obtaining the arterial input function from the internal carotid artery. These factors minimize the differences in partial volume averaging between human and animal studies. The curve with the earliest arrival time was used as the arterial input function for all calculations. Partial volume averaging was corrected by multiplying the arterial input function by the ratio of the area of venous time attenuation curve (where partial volume averaging effects are minimal) to that of the arterial input function.18 Without proper correction for partial volume averaging, erroneous values for CBF and CBV can result.19,20 The corrected arterial input function is then deconvolved with individual time attenuation curves from each voxel for calculation of CBF, CBV, and the mean transit time (MTT), which are related by the equation: MTT = CBV/CBF. The size of each calculated voxel can be selected by the user but was fixed at the size of 2 × 2 pixels of the original 512 × 512 pixels in the CT images.
Histology
After the final scan 4 hours after embolization, the animal was euthanized with intravenous potassium chloride, and the brain was immediately removed to minimize infarct expansion. The location of the embolus in the left middle cerebral artery was confirmed by visual inspection. The brain was then cut into 5-mm sections and incubated at 38°C in 5% TTC for 15 minutes for identification of the infarct—viable tissue stained red and infarcted tissue remained pale (white). In viable tissue, succinate dehydrogenase in the mitochondria reduces the TTC salt to form the red formazan product. For infarcted tissue, the salt is not reduced and remains colorless, leaving the tissue a pale white color. TTC-stained tissue sections were fixed in 10% formalin overnight, scanned on a digital scanner (Scanjet 5300C; Hewlett Packard, Palo Alto, Calif), and the images were saved for analysis. TTC staining provides a distinct interface between infarcted tissue (white) and viable tissue (red). Although a small transition zone between infarcted and viable tissue may have existed, this was not examined in detail with additional histologic techniques. No obvious signs of hemorrhage were evident on gross inspection of tissue sections.
Data Analysis
CBF and CBV maps were generated with CT Perfusion 3 (GE Healthcare) using standard techniques as described previously21 for each time point (Fig 2). Subsequent analysis using noncontrast images and the CBF and CBV maps was performed with custom software (IDL v5.6; ITT Visual Information Solutions, Boulder, Colo). Infarcted regions were outlined on each TTC-stained tissue section and then transferred to the 4-hour post-CBF and -CBV maps, using the co-registered nonenhanced CT image to guide placement of the regions (n = 32 regions). Voxels of tissue outside the infarct region of interest were classified as either ischemic (CBF < 25 mL · 100 g−1 · min−1) or normal/oligemic (CBF between 25 and 100 mL · 100 g−1 · min−1). Pixels with a CBF of >100 mL · 100 g−1 · min−1 or CBV > 8.0 mL · 100 g−1, which are probably pixels within large vessels, were excluded from all subsequent evaluations.22 A region of interest was manually drawn on the 4-hour post CBF map surrounding the ischemic area (< 25 mL · 100 g−1 · min−1). In this study, oligemia (n = 45 regions) was operationally defined as the difference between the infarct and ischemic region of interest 4 hours after embolization. For each animal, the infarct and oligemia regions of interest from the 4-hour time point were superimposed on CBF and CBV images from all previous time points to obtain blood flow and blood volume values at those times.
Fig 2.
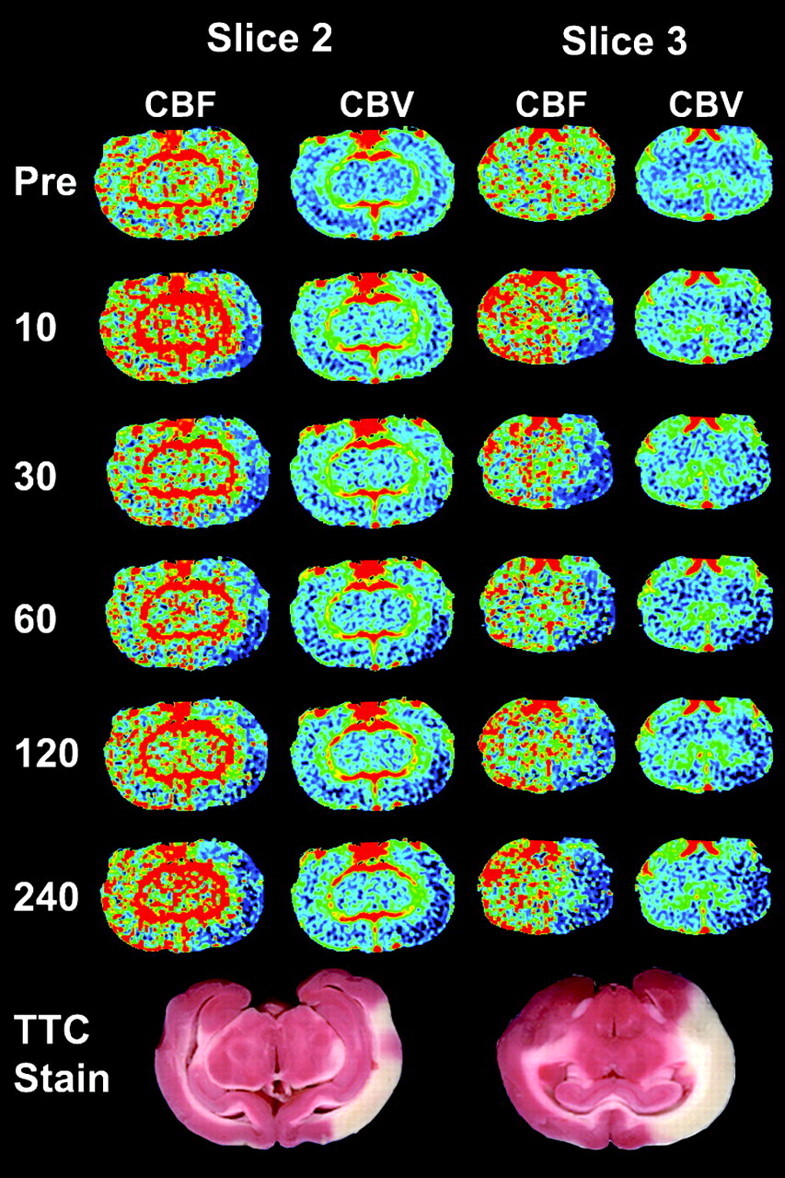
Serial CBF and CBV images from select time points (minutes poststroke on left) for 2 contiguous CT perfusion sections from 1 animal. Corresponding TTC staining shows infarcted tissue (white) corresponding to areas of decreased CBF and CBV, whereas viable tissue is stained red. CBF and CBV images are colored according to a “rainbow” color scale with red and blue representing high and low values, respectively: CBF, 0–150 mL · 100 g−1 · min−1; CBV, 0–10 mL · 100 g−1.
Statistical Analysis
All analyses were performed with SPSS for Windows (v. 13; SPSS, Chicago, Ill), and significant differences were defined as P < .05. For the CT perfusion study performed 4 hours after embolization, logistic regression analysis was performed; tissue type oligemia or infarction, as defined by TTC staining, was the dependent (outcome) variable and average CBF, CBV, and CBF×CBV values in the 2 tissue types were independent variables. Logistic regression was chosen over linear regression because of the binary nature of the dependent variable (oligemic or infarct). Using a linear regression analysis with a binary outcome violates the assumption of a normal distribution and can result in indeterminate outcome.23 Sensitivity and specificity for infarction using CBF, CBV, or CBF×CBV as independent variables in logistic regression models were calculated and reported. The model with CBF×CBV as the independent variable, or the CBF×CBV model, was then applied to voxels contained within the final infarct region, as defined on sections stained with TTC 4 hours after embolization, at all prior time points. The total number of voxels classified by the CBF×CBV model as infarct at each time point was expressed as a percentage of the final infarct area for each tissue section.
A repeated-measures analysis of variance (ANOVA) was performed as an omnibus test, with tissue type as a between-subjects factor and time after embolization as a within-subject factor. Differences between tissue types at a specific time point were assessed by 1-way ANOVA with post hoc Bonferroni correction. Paired t tests with Bonferroni correction were used to identify significant differences between baseline values and subsequent time points for each tissue type.
Results
Baseline values were not significantly different among contralateral, oligemia, and infarct regions for CBF (44.2 ± 7.29, 44.0 ± 5.13, 43.6 ± 7.03 mL · 100 g−1 · min−1) or CBV (1.80 ± 0.36, 1.86 ± 0.43, 1.92 ± 0.33 mL · 100 g−1, respectively). Contralateral CBF values remained relatively stable over the entire 4 hours and were not significantly different from baseline at any time point (Fig 3A), whereas contralateral CBV values were significantly higher than baseline at 60, 90, and 120 minutes after embolization (Fig 3B).
Fig 3.

Average values of CBF (A) and CBV (B) in infarcted (n = 32) and oligemic (n = 45) regions of interest at different times after embolization; error bars show SD. For comparison, CBF and CBV of contralateral tissue are also shown (error bars not shown for clarity).
A, CBF is significantly lower than baseline at every time point after embolization in both oligemic and infarct regions. Contralateral CBF is not significantly different from baseline at any time point.
B, CBV in infarcted regions is significantly lower (P < .05) than baseline at 60 minutes after embolization and at every subsequent time point (*). CBV for oligemic regions was significantly higher than baseline values at 30, 90, 120, 150, and 180 minutes after embolization (#). No significant differences in CBV between oligemic and contralateral regions were found at any time point.
Oligemic regions experienced a significant reduction in CBF after embolization, but ischemia was not as severe as that for infarct regions. Blood volume in oligemic regions was significantly higher than baseline at 30, 90, 120, 150, and 180 minutes after embolization but was not significantly different from baseline at the remaining time points. Infarcted regions were characterized by an immediate and sustained reduction in CBF, with blood flow values significantly lower than baseline for all times after embolization (Fig 3A). Cerebral blood volume for infarcted regions was reduced below baseline at 10 and 30 minutes after the stroke but did not reach statistical significance. At 60 minutes and every subsequent time point, CBV for infarcted regions was significantly lower than baseline (Fig 3B).
Thus, oligemic regions were characterized by mismatch in CBF and CBV, whereas infarcted tissue by a matched decrease in CBF and CBV. Logistic regression was performed with either CBF, CBV, or CBF×CBV as the independent variable to determine the sensitivity and specificity for determining tissue type (infarction versus oligemia) by using each parameter (Table). Figure 4 plots CBF and CBV values for all regions of interest 4 hours after embolization. The Table shows that logistic regression with the product (interaction) term, CBF×CBV, as the independent variable provided the best classification of tissue type, with a threshold of CBF×CBV = 31.1 (dotted line in Fig 4). This model suggests that infarction is dependent on both blood flow and blood volume, with a lower blood volume for larger blood flow values and vice versa. The CBF×CBV model had a sensitivity of 90.6% (29/32 regions) and a specificity of 93.3% (42/45 regions) for detecting infarction 4 hours after embolization, with an overall accuracy of 92.2% (71/77 regions). Figure 5 illustrates the mismatch between CBF and CBV found in oligemic regions; Fig 6 illustrates the matched decrease in CBF and CBV found in infarct.
Logistic regression classification using CBF, CBV, or CBF×CBV
| Threshold | Sensitivity | Specificity | Accuracy | |
|---|---|---|---|---|
| CBF (ml · 100 g−1 · min−1) | 21.4 | .688 | .778 | .740 |
| CBV (ml · 100 g−1) | 1.36 | .844 | .867 | .857 |
| CBF×CBV | 31.1 | .906 | .933 | .922 |
Fig 4.

Scatter plot of cerebral blood volume (CBV) versus cerebral blood flow (CBF) in oligemic and infracted tissue. Dashed line, CBF×CBV = 31.1, defines the threshold of infarction for the CBF×CBV model. Data points above the line are classified as oligemic, and points below the line are classified as infarct. When the predicted group membership is compared with the true group membership (defined on the TTC-stained tissue sections), the specificity and sensitivity of the model for infarction are 93.3% and 90.6%, respectively.
Fig 5.
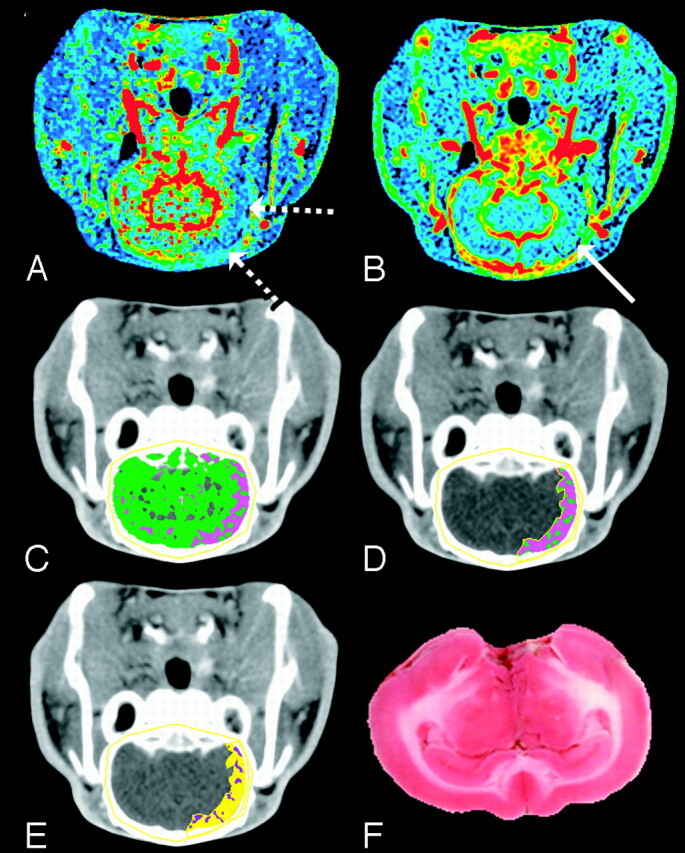
Mismatch between CBF and CBV at 4 hours after embolization. The CBF and CBV maps display the corresponding functional values according to a “rainbow” color scale with red and blue representing high and low values, respectively (CBF, 0–150 mL · 100 g−1 · min−1; CBV, 0–10 mL · 100 g−1). CBF map (A) shows ischemic areas (dashed arrows) and CBV map (B) shows normal to increased blood volume in ischemic area (solid arrow) relative to contralateral hemisphere.
C, Brain tissue segmented from skull in the nonenhanced CT image by a CT number threshold of 340 HU and further classified according to CBF: 0 < pink pixels ≤ 25 > green pixels < 100 mL · 100 g−1 · min−1.
D, A manually drawn region of interest around the ischemic area.
E, The ischemic region shown in D classified according to the logistic regression model (purple pixels = infarct; yellow pixels = oligemic). Most of the ischemic region in D is classified as penumbra, which agrees with the TTC-stained section (F).
Fig 6.
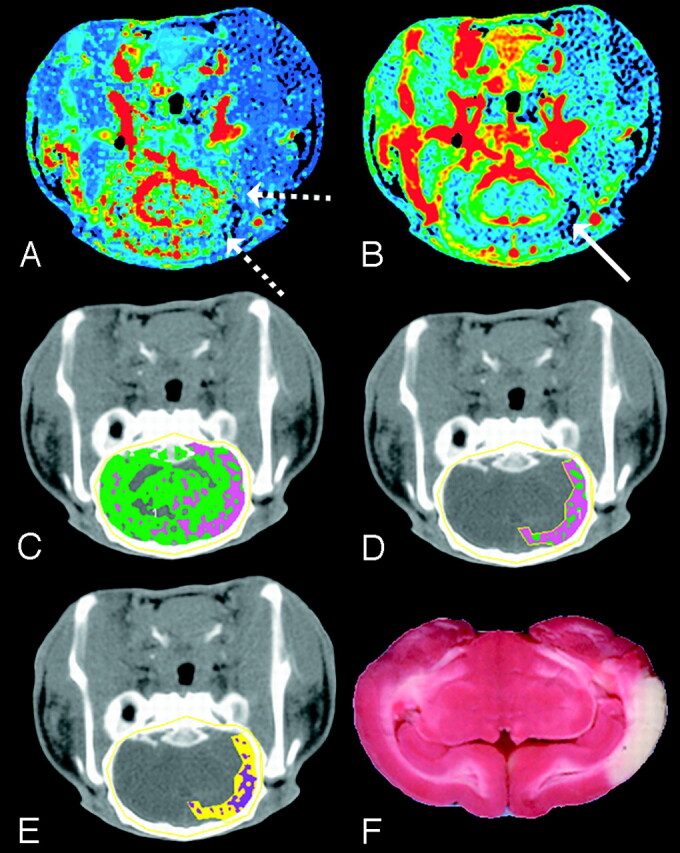
Matched decrease in CBF and CBV at 4 hours after embolization. The CBF and CBV maps display the corresponding functional values according to a “rainbow” color scale with red and blue representing high and low values, respectively (CBF, 0–150 mL · 100 g−1 · min−1; CBV, 0–10 mL · 100 g−1). CBF map (A) shows ischemic areas (dashed arrows) and CBV map (B) shows decreased blood volume in ischemic area (solid arrow) relative to contralateral hemisphere (C) brain tissue segmented from skull in the nonenhanced CT image by a CT number threshold of 340 HU and further classified according to CBF: 0 < pink pixels ≤ 25 > green pixels < 100 mL · 100 g−1 · min−1.
D, A manually drawn region of interest around the ischemic area.
E, The ischemic region shown in D classified according to the logistic regression model (purple pixels = infarct; yellow pixels = oligemic).
F, The corresponding TTC-stained tissue section shows an area of infarction that corresponds with pixels classified as infarct in E.
Infarcted tissue had CBV values that decreased, on average, throughout the period after embolization, probably because of the progression of oligemia into infarction with time. This is supported by data that show an increasing proportion of voxels being classified as infarct with increasing time from embolization (Fig 7). The total number of voxels classified as infarct increased from 8% at baseline to approximately 85% of the final infarct size 4 hours after embolization.
Fig 7.

Total volume of tissue classified as infarct by the CBF×CBV model with a threshold of CBF×CBV = 31.1 at multiple time points in the study and expressed as a percentage of final infarct volume on TTC-stained sections. Error bars show SD of the mean for each time point. Thresholds for infarction are probably time-dependent and are expected to increase with time from baseline. The assumed threshold at 4 hours after embolization applied at earlier time points is expected to overestimate the fraction of voxels destined to infarction. However, the extent of this overestimation at early time points was not investigated in this study.
Discussion
This study used CT perfusion imaging to define the mean CBF and CBV for infarcted and oligemic regions in an animal model of embolic stroke and characterized the change in these parameters with sequential imaging over the first 4 hours after embolization. By applying the CBF×CBV threshold to the final (4-hour post) infarcted region at multiple time points in the study, we showed an increasing proportion of the final infarct being classified as infarct over time. Infarcted regions showed a matched significant decrease in both CBF and CBV values, whereas oligemic regions showed a significantly reduced CBF but elevated CBV versus baseline values throughout the study.
The matched decrease in CBF and CBV for infarcted tissue can be partially explained by the failure of autoregulation in response to severe or prolonged hypoperfusion.24,25 Proximal vascular occlusion causes a decrease in the local cerebral perfusion pressure, resulting in 3 tissue types: oligemic, penumbra, and infarct. As described by Baron,26 oligemic and penumbral tissue are characterized by a dilation of distal cerebral vessels and therefore an increase in MTT and blood volume to allow maximal oxygen extraction in an attempt to maintain cerebral metabolic rate of oxygen (CMRO2). At first, this increase in oxygen extraction fraction is adequate to compensate for the decreased CBF, but as perfusion pressure continues to decrease, CMRO2 also begins to fall, which is a characteristic of functionally impaired ischemic tissue.27 As CBF continues to decrease, or remains depressed for extended periods, autoregulation begins to fail; CBV then begins to decrease to accompany the already reduced CBF. Data from this study therefore support the hypothesis that a matched decrease in CBF and CBV defines infarcted tissue.28–30
The reduction in CBV for infarcted tissue could also be due to the release of vasoactive substances that counter the efforts of autoregulatory mechanisms to maximally dilate cerebral vessels.24 Evidence suggests that small increases in the concentration of extracellular K+ have vasodilatory effects, but as tissue progresses to infarction and neuronal death occurs, the local concentration of K+ increases substantially and may cause severe vasoconstriction instead.31 Capillary obstruction resulting from endothelial swelling, platelet aggregation, compression of capillaries due to edema, or leukocyte adhesion in the capillaries may also lead to a reduction in CBV during ischemia.32
In this study, we observed modest increases in CBV over the duration of the experiment for surviving ischemic tissue (maximal 14% increase over baseline at 150 minutes after stroke), similar to previous studies.33 Our data from oligemic regions is consistent with previous work suggesting that CBV values are elevated in moderately ischemic tissue with CBF values greater than 65%–70% of baseline values.34–36 However, at later times, when there are more severe perfusion deficits and presumably more ischemic damage, CBV was not significantly different from baseline values, which is consistent with previous work (Fig 3B).34
Mean cerebral blood volume for infarcted regions in this study was lower than the thresholds for infarction used by Wintermark and colleagues in human subjects.11 This difference could be the result of interspecies differences and methods of calculation and analysis. In this study, ischemic regions were defined by using an absolute measure of blood flow (<25 mL · 100 g−1 · min−1), and an attempt was made to exclude large cerebral vessels in the measurement of CBV and CBF. Pixels with a CBF greater than 100 mL · 100 g−1 · min−1 or a CBV greater than 8 mL · 100 g−1 were excluded in all analyses and could be responsible for the different values. Altering the thresholds for vascular pixel elimination resulted in different absolute values for each tissue type, but the same relationship between CBF and CBV remained for infarcted (matched decrease) and oligemia (mismatch with decreased CBF and increased/maintained CBV) regions. In our study, it was the product CBF×CBV that provided the greatest degree of separation between infarct and oligemic tissue. The increased sensitivity and specificity achieved using the product of CBF×CBV is due to the matched decrease in both CBF and CBV for infarcted tissue and the mismatch between these measurements in the oligemic regions. As a result of the lower CBF and CBV values for infarcted regions, the product of these 2 measurements results in less overlap between the values for oligemia and infarct than CBF or CBV alone.
The percentage of the final infarct volume classified as infarct by the CBF×CBV model increased from 8% at baseline to 85% at the 4-hour time point (Fig 7). The 8% of voxels classified as infarct by the regression equation at baseline can be explained by the presence of white matter or CSF in the 4-hour postinfarct regions. Classification of pixels by the CBF×CBV model at the 4-hour time point resulted in 85% of voxels in the final infarct being classified as infarct. This value did not reach 100% as expected and was probably caused by noise or partial volume-averaging effects resulting from pixels containing arteries or veins traveling through the section or on the periphery of the final infarct volume. This is illustrated in Fig 6, where pixels are contained within the final infarct volume but are classified as ischemic at the 4-hour time point. Although we showed an increasing volume of infarcted tissue with time, the thresholds for infarction are probably time-dependent. However, these data could not be obtained without sacrifice of the animal at earlier time points and was not investigated in this study.
Despite the advantages of CT perfusion imaging, certain limitations of this technique warrant discussion. The limited anatomic coverage of CT, 2–4 cm in the axial direction, potential adverse effects of iodinated contrast agent, and radiation exposure are important considerations. Advances in CT hardware and imaging techniques have resulted in increased anatomic coverage and possible reductions in the radiation dose.37,38 Studies have shown very good tolerance to iodinated contrast agent,39 and the radiation dose from a CT perfusion study is approximately double that of a whole-head noncontrast CT scan (unpublished data by T.-Y.L.). Another limitation of this study is that segmentation of the gray and white matter was not performed. However, the contribution of white matter was probably very small because it comprises less than 15% of lissencephalic rabbit brain.40 Another important difference between this animal study and the clinical situation is the fact that animals were maintained on isoflurane anesthetic throughout the study. Although anesthetics may alter the cerebral metabolic rate of oxygen and cerebral blood flow, we have no reason to expect that the relationship between CBF and CBV would be altered under these conditions.
Conclusion
This study describes the changes in CBF and CBV that occur during the acute stage after embolization in an animal model of embolic stroke. Our data suggest that surviving oligemic tissue has reduced CBF and elevated CBV. In contrast, infarcted tissue was characterized by a more severe ischemia and declining CBV values, resulting in a matched decrease in CBF and CBV 4 hours after embolization. Logistic regression analysis showed that the product of blood volume and blood flow provided the most reliable parameter for differentiating between infarct and oligemic regions in terms of sensitivity and specificity. Although the absolute thresholds for infarction may differ from human studies, the design used in this animal study allowed us to characterize the changes in CBF and CBV over the acute stage of embolization, data that cannot easily be obtained in clinical studies. The threshold of CBF×CBV derived using the 4-hour data was applied to earlier time points and showed an increasing percentage of the final infarct region being classified as infarct over sequential imaging time points. This suggests that the product of CBF and CBV may be applicable at earlier time points for differentiating between infarct and oligemic regions. CBF×CBV provided the most sensitive and specific parameter, and a similar approach could be applied in the clinical setting using CT perfusion at a single time point to help select candidates for thrombolytic therapy.
Acknowledgments
We thank Dominique Ouimet and Jennifer Hadway for assisting with the animal studies and Vadim Beletsky for helpful comments during manuscript preparation.
Footnotes
This work was supported by the Canadian Institutes of Health Research, Ontario Research and Development Challenge Fund (BRAIN consortium), and Boehringer Ingelheim.
T.-Y.L. is the developer of the CT Perfusion software (General Electric HealthCare).
Abstract previously presented at: Annual Meeting of the Radiological Society of North America (November 30–December 5, 2003; Chicago, Ill) and the Academy of Molecular Imaging (March 27–31, 2004; Orlando, Fla).
References
- 1.American Stroke Association. American Stroke Association Stroke statistics. American Heart Association. 2003. . Available at: http://www.strokeassociation.org
- 2.Astrup J, Siesjo BK, Symon L. Thresholds in cerebral ischemia—the ischemic penumbra. Stroke 1981;12:723–25 [DOI] [PubMed] [Google Scholar]
- 3.Furlan M, Marchal G, Viader F, et al. Spontaneous neurological recovery after stroke and the fate of the ischemic penumbra. Ann Neurol 1996;40:216–26 [DOI] [PubMed] [Google Scholar]
- 4.Hacke W, Donnan G, Fieschi C, et al. Association of outcome with early stroke treatment: pooled analysis of ATLANTIS, ECASS, and NINDS rt-PA stroke trials. Lancet 2004;363:768–74 [DOI] [PubMed] [Google Scholar]
- 5.Darby DG, Barber PA, Gerraty RP, et al. Pathophysiological topography of acute ischemia by combined diffusion-weighted and perfusion MRI. Stroke 1999;30:2043–52 [DOI] [PubMed] [Google Scholar]
- 6.Barber PA, Darby DG, Desmond PM, et al. Prediction of stroke outcome with echoplanar perfusion- and diffusion-weighted MRI. Neurology 1998;51:418–26 [DOI] [PubMed] [Google Scholar]
- 7.Anonymous. Tissue plasminogen activator for acute ischemic stroke. The National Institute of Neurological Disorders and Stroke rt-PA Stroke Study Group. N Engl J Med 1995;333:1581–87 [DOI] [PubMed] [Google Scholar]
- 8.Hacke W, Kaste M, Skyhoj OT, et al. European Stroke Initiative (EUSI) recommendations for stroke management. The European Stroke Initiative Writing Committee. Eur J Neurol 2000;7:607–23 [DOI] [PubMed] [Google Scholar]
- 9.Thomalla G, Schwark C, Sobesky J, et al. Outcome and symptomatic bleeding complications of intravenous thrombolysis within 6 hours in MRI-selected stroke patients: comparison of a German multicenter study with the pooled data of ATLANTIS, ECASS, and NINDS tPA trials. Stroke 2006;37:852–58 [DOI] [PubMed] [Google Scholar]
- 10.Wintermark M, Reichhart M, Cuisenaire O, et al. Comparison of admission perfusion computed tomography and qualitative diffusion- and perfusion-weighted magnetic resonance imaging in acute stroke patients. Stroke 2002;33:2025–31 [DOI] [PubMed] [Google Scholar]
- 11.Wintermark M, Reichhart M, Thiran JP, et al. Prognostic accuracy of cerebral blood flow measurement by perfusion computed tomography, at the time of emergency room admission, in acute stroke patients. Ann Neurol 2002;51:417–32 [DOI] [PubMed] [Google Scholar]
- 12.Els T, Daffertshofer M, Schroeck H, et al. Comparison of transcranial Doppler flow velocity and cerebral blood flow during focal ischemia in rabbits. Ultrasound Med Biol 1999;25:933–38 [DOI] [PubMed] [Google Scholar]
- 13.Eyre JA, Essex TJ, Flecknell PA, et al. A comparison of measurements of cerebral blood flow in the rabbit using laser Doppler spectroscopy and radionuclide labelled microspheres. Clin Phys Physiol Meas 1988;9:65–74 [DOI] [PubMed] [Google Scholar]
- 14.Orr JA, DeSoignie RC, Wagerle LC, et al. Regional cerebral blood flow during hypercapnia in the anesthetized rabbit. Stroke 1983;14:802–07 [DOI] [PubMed] [Google Scholar]
- 15.Kapoor K, Kak VK, Singh B. Morphology and comparative anatomy of circulus arteriosus cerebri in mammals. Anat Histol T Embryol 2003;32:347–55 [DOI] [PubMed] [Google Scholar]
- 16.Jeppson PG, Olin T, eds. Cerebral Angiography in the Rabbit. Lund, Sweden: Lunds Universitäts Årsskrift;1960
- 17.Nabavi DG, Cenic A, Dool J, et al. Quantitative assessment of cerebral hemodynamics using CT: stability, accuracy, and precision studies in dogs. J Comput Assist Tomogr 1999;23:506–15 [DOI] [PubMed] [Google Scholar]
- 18.Cenic A, Nabavi DG, Craen RA, et al. Dynamic CT measurement of cerebral blood flow: a validation study. AJNR Am J Neuroradiol 1999;20:63–73 [PubMed] [Google Scholar]
- 19.Kealey SM, Loving VA, Delong DM, et al. User-defined vascular input function curves: influence on mean perfusion parameter values and signal-to-noise ratio. Radiology 2004;231:587–93 [DOI] [PubMed] [Google Scholar]
- 20.Sanelli PC, Lev MH, Eastwood JD, et al. The effect of varying user-selected input parameters on quantitative values in CT perfusion maps. Acad Radiol 2004;11:1085–92 [DOI] [PubMed] [Google Scholar]
- 21.Nabavi DG, Cenic A, Henderson S, et al. Perfusion mapping using computed tomography allows accurate prediction of cerebral infarction in experimental brain ischemia. Stroke 2001;32:175–83 [DOI] [PubMed] [Google Scholar]
- 22.Kudo K, Terae S, Katoh C, et al. Quantitative cerebral blood flow measurement with dynamic perfusion CT using the vascular-pixel elimination method: comparison with H215O positron emission tomography. AJNR Am J Neuroradiol 2003;24:419–26 [PMC free article] [PubMed] [Google Scholar]
- 23.Norusis MJ. Logistic regression analysis. In: SPSS 13.0 Statistical Procedures Companion. Upper Saddle River, NJ: Prentice Hall, Inc;2005. :319–59
- 24.Sette G, Baron JC, Mazoyer B, et al. Local brain haemodynamics and oxygen metabolism in cerebrovascular disease. Positron emission tomography. Brain 1989;112(Pt 4):931–51 [DOI] [PubMed] [Google Scholar]
- 25.Derdeyn CP, Videen TO, Yundt KD, et al. Variability of cerebral blood volume and oxygen extraction: stages of cerebral haemodynamic impairment revisited. Brain 2002;125:595–607 [DOI] [PubMed] [Google Scholar]
- 26.Baron J-C. Positron emission tomography. In: Barnett HJM, ed. Stroke: Pathophysiology, Diagnosis, and Management. New York: Churchill Livingstone;1998. :101–19
- 27.Lassen NA. Pathophysiology of brain ischemia as it relates to the therapy of acute ischemic stroke. Clin Neuropharmacol 1990;13(Suppl 3):S1–S8 [DOI] [PubMed] [Google Scholar]
- 28.Hamberg LM, Boccalini P, Stranjalis G, et al. Continuous assessment of relative cerebral blood volume in transient ischemia using steady state susceptibility-contrast MRI. Magn Reson Med 1996;35:168–73 [DOI] [PubMed] [Google Scholar]
- 29.Dijkhuizen RM, Berkelbach van der Sprenkel JW, Tulleken KA, et al. Regional assessment of tissue oxygenation and the temporal evolution of hemodynamic parameters and water diffusion during acute focal ischemia in rat brain. Brain Res 1997;750:161–70 [DOI] [PubMed] [Google Scholar]
- 30.Caramia F, Huang Z, Hamberg LM, et al. Mismatch between cerebral blood volume and flow index during transient focal ischemia studied with MRI and GD-BOPTA. Magn Reson Imaging 1998;16:97–103 [DOI] [PubMed] [Google Scholar]
- 31.Kuschinsky W, Wahl M. Local chemical and neurogenic regulation of cerebral vascular resistance. Physiol Rev 1978;58:656–89 [DOI] [PubMed] [Google Scholar]
- 32.Hudetz A. Cerebral microcirculation. In: Welch KMA, Caplan LR, Reis DJ, et al, eds. Primer on Cerebrovascular Disease. San Diego: Academic Press;1997. :45–51
- 33.Lee SK, Kim DI, Jeong EK, et al. Temporal changes in reversible cerebral ischemia on perfusion- and diffusion-weighted magnetic resonance imaging: the value of relative cerebral blood volume maps. Neuroradiology 2002;44:103–08 [DOI] [PubMed] [Google Scholar]
- 34.Sakoh M, Rohl L, Gyldensted C, et al. Cerebral blood flow and blood volume measured by magnetic resonance imaging bolus tracking after acute stroke in pigs: comparison with [15O]H2O positron emission tomography. Stroke 2000;31:1958–64 [DOI] [PubMed] [Google Scholar]
- 35.Hatazawa J, Shimosegawa E, Toyoshima H, et al. Cerebral blood volume in acute brain infarction: a combined study with dynamic susceptibility contrast MRI and 99mTc-HMPAO-SPECT. Stroke 1999;30:800–06 [DOI] [PubMed] [Google Scholar]
- 36.Powers WJ. Cerebral hemodynamics in ischemic cerebrovascular disease. Ann Neurol 1991;29:231–40 [DOI] [PubMed] [Google Scholar]
- 37.Roberts HC, Roberts TP, Smith WS, et al. Multisection dynamic CT perfusion for acute cerebral ischemia: the “toggling-table” technique. AJNR Am J Neuroradiol 2001;22:1077–80 [PMC free article] [PubMed] [Google Scholar]
- 38.Hsieh J, Wei Y, Wang G. Fractional scan algorithms for low-dose perfusion CT. Med Phys 2004;31:1254–57 [DOI] [PubMed] [Google Scholar]
- 39.Tippins RB, Torres WE, Baumgartner BR, et al. Are screening serum creatinine levels necessary prior to outpatient CT examinations? Radiology 2000;216:481–84 [DOI] [PubMed] [Google Scholar]
- 40.Zhang K, Sejnowski TJ. A universal scaling law between gray matter and white matter of cerebral cortex. Proc Natl Acad Sci U S A 2000;97:5621–26 [DOI] [PMC free article] [PubMed] [Google Scholar]