

Abstract
BACKGROUND AND PURPOSE: The role of blood-flow biomechanics on the size, morphology, and growth of cerebral aneurysms is poorly known. The purpose of this study was to evaluate intra-aneurysmal hemodynamics before and after aneurysm growth.
MATERIALS AND METHODS: A flow-simulation study was performed in a middle cerebral artery (MCA) aneurysm with a bleb that grew after 1-year follow-up. Geometrically realistic in vitro models before and after aneurysm growth were constructed on the basis of CT angiograms. Blood-flow velocity, vorticity, and wall shear stress were obtained by using particle imaging velocimetry and laser Doppler velocimetry.
RESULTS: No significant quantitative differences were noted among the overall flow structures before and after aneurysm growth, with the exception of less vorticity in the bleb after aneurysm growth. A circulating flow pattern was seen within the aneurysm domes. A blood-flow separation was observed at the margins of the bleb. No impingement of inward flow into the enlarging bleb was noted. Before the aneurysm growth, the wall shear stress was high at the aneurysm neck and also at the margin of the bleb. The value of wall shear stress decreased in the deeper part of the bleb. This value decreased even more after the aneurysm growth.
CONCLUSIONS: Intra-aneurysmal hemodynamic structures before and after the growth of an MCA aneurysm were compared. Further investigation with a similar approach is mandatory to obtain a firm conclusion.
Postmortem studies estimate that as much as 5% of the population may harbor saccular cerebral aneurysms.1 Because of recent advancements in the minimally invasive neuroimaging technology, these aneurysms are more frequently detected before their rupture. On the other hand, the mechanisms of aneurysm growth and rupture are poorly understood. Consequently, intra-aneurysmal hemodynamics has received increasing attention over the past few years. Numerous reports have been published paying special attention to blood-flow structures in patients’ cerebral aneurysms.2–6 We believe that no publication has compared blood-flow changes in a saccular aneurysm before and after the growth, though such a study would be helpful to understand a possible contribution of hemodynamics to the process of aneurysm degeneration.
The purpose of this study was to document intra-aneurysmal hemodynamics before and after an aneurysm growth. Geometrically realistic in vitro aneurysm models were created by using a longitudinal CT angiogram data base of patients’ cerebral aneurysms. Detailed flow velocity and wall shear stress measurements were performed in multiple points within the aneurysm dome and bleb.
Materials and Methods
In Vitro Aneurysm Models
An incidental small wide-necked left middle cerebral artery (MCA) aneurysm found in a 43-year-old female patient was selected from a longitudinal 3D CT angiography data base. The patient had no history of systemic or vascular diseases known to be associated with brain aneurysm formation. The MCA aneurysm had a very small focal dilation (bleb) on its dome (Fig 1A), which enlarged after 1 year (Fig 1B). The patient underwent surgical clipping of the aneurysm on the basis of this anatomic information. 3D CT angiograms of the MCA aneurysm before and after the aneurysm growth were used to compare hemodynamic characteristics.
Fig 1.

A, Volume-rendering 3D image of left MCA aneurysm, posteroanterior view, before growth. Arrow indicates outpouching (bleb) on the aneurysm dome. B, Volume-rendering 3D image of the same left MCA aneurysm, posteroanterior view, after growth of the aneurysm bleb (arrow). C, A silicon aneurysm model of the left MCA aneurysm before growth. D, A silicon aneurysm model of the left MCA aneurysm after growth.
The CT angiogram dataset was obtained by using a helical CT scanner (GE CTi, GE Healthcare, Milwaukee, Wis). Section collimation was 1.0 mm with a 0.5-mm reconstruction interval. FOV was 180 mm, with a matrix size of 512 × 512; spatial resolution was 0.35 mm × 0.35 mm. The CT angiogram of the aneurysm included pre- and postbifurcation segments of the MCA and the aneurysm itself. The dome of the MCA aneurysm measured approximately 4 mm in its longest diameter before growth and 6 mm after growth. The prebifurcation segment of the MCA measured 3.5 mm in its largest diameter.
The construction method of a geometrically realistic in vitro aneurysm model based on CT angiography has been published.7 In brief, on the basis of the 3D surface data constructed from the source images of CT angiography, male casts of the MCA aneurysms were created with the use of rapid prototyping technology. The size of the male casts was scaled up by 3.0 times compared with the original size so that detailed 3D flow structure and wall shear stress distribution in such a small aneurysm could be evaluated. Pre- and postgrowth in vitro silicone aneurysm models were then constructed by using the male casts as a mold (Fig 1C, -D).
Fluid-Flow Condition
We applied the concept of dimensional analysis and the law of similarity to create physiologic flow conditions in the scaled-up aneurysm model. According to these concepts, not all flow parameters such as kinematic viscosity, flow velocity, and duration of 1 pulse wave have to be matched to get an accurate flow-velocity simulation, as long as dimensionless similarity parameters and the waveform shape in the parent artery are matched.7–9 In this study, dimensionless similarity parameters such as the in vitro Reynolds number and the Womersley pulsatility index were arranged to match those values depicted in vivo. The maximum Reynolds number and Womersley pulsatility index in the parent arteries (prebifurcation segment of the MCA) of both in vitro models were 800 and 5.0, respectively.
Physiologic pulsatile flow was generated in the in vitro experimental circuit by using a velocity-controlled servomotor (VLBS-A11012, Toei Electric, Tokyo, Japan). The average velocity waveform of the human MCA obtained by transcranial sonography was reproduced in the parent arteries of each model.10,11 The flow rates of postbifurcation segments of the MCA were set in accordance with the cross-section area of each branch.12,13
The working fluid used in the model was an aqueous solution of glycerol (58.4% by weight) with the refraction index of 1.409. These values were matched to those in the silicon test section so that the optical distortion at the interface between the working fluid and the silicon could be avoided and flow-velocity measurements with laser Doppler velocimetry (LDV) and particle imaging velocimetry (PIV) could be used. The kinematic viscosity was 4.2 × 10⁻⁶ cm2/s in an operating temperature of 25°C.
Velocity Measurements
Quantitative flow-velocity structure before and after the growth of the MCA aneurysm was obtained using PIV System (Kanomax, Osaka, Japan). Silica particles with the size of 10 μm were added to the working fluid during the PIV measurements. The reflective silica particles were illuminated as they passed through a sheet of laser light, and sequential images of illuminated reflective particles in the sheet of laser light were acquired by the PIV. From those sequential images, a computer software program calculated direction and velocity of the particles. Flow-data acquisition was performed at 15 phases during a cardiac cycle in the pregrowth aneurysm model and at 18 phases in the postgrowth model. Flow-velocity vectors were obtained on 4 planes in the MCA aneurysm (3 planes perpendicular to the natural axis of the aneurysm and sagittal planes) and also on 1 plane in the parent artery (midpoint of the horizontal segment of the MCA). The rotational flow expressed by vorticity was also calculated by using the flow-velocity vectors acquired by PIV. The vorticity was given in the following equation: ω = rotυ, where ω is vorticity and rotυ is velocity vector.
Wall Shear Stress Measurements
The value of the fluid-induced wall shear was calculated from the flow-velocity results obtained by IFA 650 (TSI, Shoreview, Minn) with the measurement dimensions of 180 × 34.2μm. The LDV probe was mounted on a bidirectional traversing table allowing the measurement volume to be positioned within 5μm resolution. Titanium dioxide particles (0.63 μm) were added in the working fluid before the data acquisition with LDV. The flow-velocity result at each point was produced after the final average of 50 consecutive measurements.
The fluid-induced wall shear stress (τ) along the aneurysmal wall was calculated from the following equation: τ = ν dv/dx, where ν is the kinematic viscosity of the working fluid and dv/dx is the velocity gradient near the aneurysm wall. The shearing-velocity (dv) was obtained at the distance of 0.50 mm (dx) from the aneurysm wall, sampling the point shearing-velocity (dv) tangential to the contour of the aneurysm.5,14
Results
Intra-Aneurysmal Flow Structure
Flow-velocity vectors in the midsagittal plane are shown in Fig 2. The aneurysm inflow zone and flow structures in the aneurysm bleb were clearly depicted in this plane.
Fig 2.
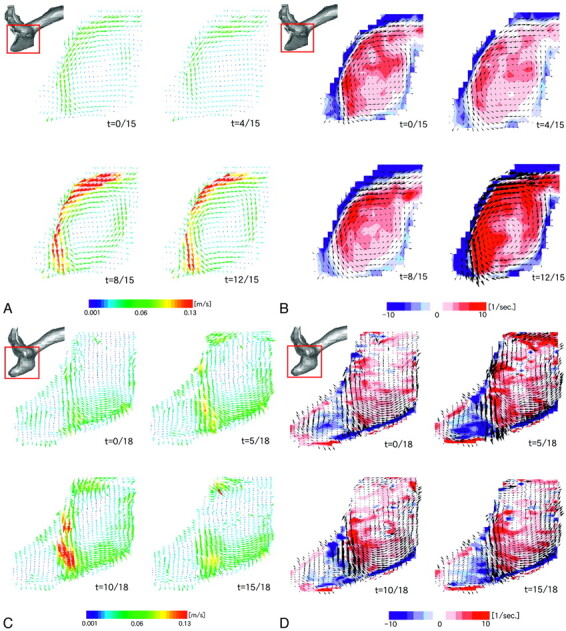
A and B, Intra-aneurysmal flow before growth. Alteration of flow-velocity structure (A) and vorticity mapping (B) during 1 cardiac cycle are presented on the midsagittal plane. C and D, Intra-aneurysmal flow after growth. Alteration of flow velocity structure (C) and vorticity mapping (D) during 1 cardiac cycle are presented on the corresponding midsagittal plane. Red and blue colors on vorticity mapping indicate counterclockwise and clockwise vortices, respectively; t indicates time.
In the pregrowth aneurysm model (Fig 2A), the fluid flow entered into the aneurysm in the superior part of the neck and moved along the superior side of the aneurysm wall. The fluid flow then separated from the aneurysm wall at the margin of the aneurysm bleb, changing its direction inferiorly, and impinged on the inferior side of the aneurysm wall. There was no impinging flow onto the aneurysm bleb (enlarging area). The outward flow was noted along the inferior side of the aneurysm wall. The flow velocity of the outward flow was slower than that of the inward flow.
Figure 2B shows vorticity mapping at the same midsagittal plane. The red and blue colors indicate counterclockwise and clockwise vortices, respectively. There was a counterclockwise circulating flow pattern within the aneurysm, a small clockwise circulating flow within the bleb, and the strength of the vorticity changed during a cardiac cycle. The velocity of the circulating flow pattern within the aneurysm dome was approximately 14% of the maximum flow velocity in the parent artery.
In the postgrowth aneurysm model, no substantial difference was noted in the overall flow velocity structure compared with the pregrowth model (Fig 2C). As noted in the pregrowth model, a counterclockwise circulating flow pattern was seen in the aneurysm dome. The separation of fluid flow was also observed at the superior side of the border of the bleb. No impingement of inward flow onto the bleb was noted. There was a clockwise circulating flow pattern within the bleb, but it was larger in its area compared with the pregrowth model (Fig 2D). The vorticity mapping shows more complex patterns in the bleb of the postgrowth model than in the pregrowth model. The velocity of the major circulating flow pattern within the aneurysm dome was approximately 17% of the maximum flow velocity in the parent artery.
Wall Shear Stress
Figure 3 demonstrates multiple sites where the value of wall shear stress was obtained. Figure 4 demonstrates actual measurement values of wall shear stress in the aneurysm models.
Fig 3.

3D surface data of the MCA aneurysm before growth and anteroposterior projection (A) and superoinferior projection (B), demonstrating multiple points at which the value of wall shear stress was obtained. 3D surface data of the MCA aneurysm after growth, anteroposterior projection (C) and superoinferior projection (D), demonstrating multiple points at which the value of wall shear stress was obtained.
Fig 4.

A, Graph showing the values of wall shear stress (WSS) at 20 points along the aneurysm wall indicated in Fig 3A. Points 3–15 are located in the enlarging area. B, Graph showing the values of wall shear stress at 16 points along the aneurysm wall indicated in Fig 3B. Points 5–14 are located in the enlarging area. C, Graph showing the values of wall shear stress at 20 points along the aneurysm wall indicated in Fig 3C. Points 3–15 are located in the enlarging area. D, Graph showing the values of wall shear stress at 13 points along the aneurysm wall indicated in Fig 3C. Points 4–11 are located in the enlarging area. Min indicates minimal flow phase; acc, acceleration phase; max, maximal flow phase; dec, deceleration phase.
In Fig 3A (anteroposterior view of the pregrowth model) and Fig 3B (superoinferior view of the pregrowth model), points 3–15 and points 5–14 were located in the enlarging area, respectively. The wall shear stress was high in the neck of the aneurysm, and it was relatively high in the margin of the aneurysm bleb (Figs 4A, -B). The inferior margin of the bleb was exposed to comparatively higher shear stress where a strong impingement of downward flow was observed (Fig 4A, points 10–15). The value of wall shear stress decreased in the top of the bleb. The value of wall shear stress changed during a cardiac cycle at the points at which high shear stress was noted, but no negative values of wall shear stress were observed at any moment.
In Fig 3C (anteroposterior view of the postgrowth model) and Fig 3D (superoinferior view of the postgrowth model), points 3–15 and points 4–11 were located in the bleb, respectively. The neck of the aneurysm was again exposed to higher wall shear stress. When compared with the pregrowth model, the value of wall shear stress was low in the bleb, particularly in its top region (Fig 4C, points 3–10). The margin of the bleb was, however, exposed to high wall shear stress. This finding became more noticeable than that in the pregrowth model.
Discussion
Blood vessels are exposed to many forces induced by pulsatile blood flow such as hydrostatic pressure, dynamic pressure, and fluid-induced wall shear stress. The hydrostatic pressure is nearly equivalent to the blood pressure. The dynamic pressure is a force produced when the circulating blood flow impinges on the arterial wall and is superimposed on the hydrostatic pressure. Thus, specific points of arteries such as branching points are exposed to higher pressure.
In this study, there was no strong impinging flow onto the aneurysm bleb throughout its growth, suggesting that the bleb was not exposed to particularly high dynamic pressure compared with the nonenlarging area of the aneurysm. On the contrary, flow separation at the margins of the aneurysm bleb was observed throughout the growth. This result implies that the impinging force of blood flow may not be an essential cause of the growth of the small bleb in this particular aneurysm.
We noticed that the neck of the aneurysm and the margins of the bleb were exposed to a higher wall shear stress. In contrast, the value of wall shear stress was low within the bleb throughout its growth. In vivo shear stress values can be estimated by multiplying the in vitro results by 9.22 on the basis of the similarity principle.8 The estimated in vivo maximum wall shear stress at the margins of the bleb in the pre- and postgrowth models would be 5.61 N/m2 and 7.83 N/m2, respectively. The flow separation noted at 1 margin of the bleb and the flow impingement onto the other side of the margin (Fig 2A, -C) might contribute to the high wall shear stress in the corresponding area.
The capacity of the endothelial cell to sense wall shear stress is an important determinant of overall vessel structural remodeling.13 It has been reported that increased wall shear stress might stimulate the production of matrix metalloproteinases by endothelial cells, which are likely instigators of internal elastic lamina degradation in the arterial wall.15 Destructive remodeling of the extracellular matrix has been shown to be present in the aneurysmal abdominal aorta.16,17 Given the fact that unruptured cerebral aneurysms have normal-shaped endothelium, we believe that nonuniform distribution of wall shear stress within small unruptured aneurysms may contribute to the wall degeneration.5,16,17
It has been postulated in animal studies that focal high wall shear stress rather than focal mechanical stress is a predisposing factor for cerebral aneurysm formation in healthy arteries.18,19 These studies also hypothesized that the initiation of aneurysm formation in the cerebral artery is due to destructive remodeling triggered by high wall shear stress. Morimoto et al20 reported that in mice experimentally induced by unilateral carotid artery ligation, the most remarkable degenerative changes were observed in the neck of cerebral aneurysms. Their results suggest that aneurysm degeneration occurs at the neck, as a consequence of focal high shear stress. Our results showing a high shear stress in the neck of the aneurysm as well as in the margin of the enlarging bleb might have contributed to the degeneration of the aneurysm wall.
Some researchers support the hypothesis that slow-flow conditions and low shear stress contribute to the degeneration of cerebral aneurysms.21,22 The result of our present study demonstrated a slow-flow pattern and low shear stress in the deeper part of the bleb, particularly in the postgrowth model. It is impossible to conclude from our study that the high wall shear stress at the margin of the bleb or the low wall shear stress in the deeper part of the bleb contributed to the wall degeneration. Accumulation of knowledge from similar types of research may answer those questions.
Although hemodynamic evaluation of a few clinical cases is not sufficient to reach a firm conclusion with statistical significance, the results obtained from a variety of in vitro or computational flow-simulation studies brought valuable information, which helps us to understand the natural history of a cerebral aneurysm and its therapeutic management.5,23–25 The results of the present study support a recent hypothesis that the process of aneurysm growth is not fully explained by simple fluid physics induced by impinging blood flow. Further flow biomechanical study and accumulation of cases are mandatory.
Vascular geometry is an important parameter that determines flow patterns. The present study showed that a small difference in the shape of the aneurysm before and after the growth altered intra-aneurysmal flow structure to a certain extent. It has been proved that 3D CT angiography and digital subtraction angiography provide accurate geometry of small brain aneurysms.26,27 However, researchers have to be aware that even the small geometric inaccuracy produced by limited image resolution may affect the results of hemodynamic simulations based on clinical images. Potential errors in these types of simulation studies may also occur in the process of model construction and designing the inlet flow condition. Direct measurement of intra-aneurysmal hemodynamics instead of simulation or their combined use may be a solution.28,29
Conclusion
A detailed in vitro evaluation of intra-aneurysmal hemodynamics in a growing aneurysm with a bleb was performed. There was no significant impingement of blood flow onto the enlarged region (bleb) of the aneurysm. Our study suggests that the mechanism of aneurysm growth is not fully explained by simple fluid physics and that the impinging mechanical force is not necessarily the cause of the growth of the bleb. Values of wall shear stress were high in the neck of the aneurysm as well as in the margins of the aneurysm bleb. These values decreased within the body and dome of the aneurysmal bleb. Further flow biomechanical evaluations in more growing aneurysms are necessary to corroborate or contradict our present results in this in vitro model of an enlarging MCA aneurysm. These hemodynamic evaluations should be implemented with concomitant biomolecular analysis of aneurysm walls.
Footnotes
This study was supported by the Grants-in-Aid for Scientific Research (A) from the Ministry of Education, Culture, Sports, Science and Technology in Japan to Kazuo Tanishita.
Paper previously presented in part at: Annual Meeting of the American Society of Neuroradiology, April 29–May 5, 2006; San Diego, Calif.
References
- 1.Wiebers DO, Torner JC, Meissner I. Impact of unruptured intracranial aneurysms on public health in the United States. Stroke 1992;23:1416–19 [DOI] [PubMed] [Google Scholar]
- 2.Cebral JR, Castro MA, Burgess JE, et al. Characterization of cerebral aneurysms for assessing risk of rupture by using patient-specific computational hemodynamics models. AJNR Am J Neuroradiol 2005;26:2550–59 [PMC free article] [PubMed] [Google Scholar]
- 3.Hassan T, Timofeev EV, Saito T, et al. A proposed parent vessel geometry-based categorization of saccular intracranial aneurysms: computational flow dynamics analysis of the risk factors for lesion rupture. J Neurosurg 2005;103:662–80 [DOI] [PubMed] [Google Scholar]
- 4.Sato T, Onoda K, Tsuchimoto S. Visualization of intra-aneurysmal flow patterns with transluminal flow images of 3D MR angiograms in conjunction with aneurysmal configurations. AJNR Am J Neuroradiol 2003;24:1436–45 [PMC free article] [PubMed] [Google Scholar]
- 5.Tateshima S, Murayama Y, Villablanca JP, et al. In vitro measurement of fluid-induced wall shear stress in unruptured cerebral aneurysms harboring blebs. Stroke 2003;34:187–92 [DOI] [PubMed] [Google Scholar]
- 6.Mantha A, Karmonik C, Benndorf G, et al. Hemodynamics in a cerebral artery before and after the formation of an aneurysm. AJNR Am J Neuroradiol 2006;27:1113–18 [PMC free article] [PubMed] [Google Scholar]
- 7.Tateshima S, Murayama Y, Villablanca JP, et al. Intra-aneurysmal flow dynamics study featuring an acrylic aneurysm model manufactured using a computerized tomography angiogram as a mold. J Neurosurg 2001;95:1020–27 [DOI] [PubMed] [Google Scholar]
- 8.Caro CG, Pedley TJ, Schroter RC, et al. The Mechanics of the Circulation. New York: Oxford University Press;1978. :79–85
- 9.Wood NB. Aspects of fluid dynamics applied to the larger arteries. J Theor Biol 1999;199:137–61 [DOI] [PubMed] [Google Scholar]
- 10.Hennerici M, Rautenberg W, Sitzer G, et al. Transcranial Doppler ultrasound for the assessment of intracranial arterial flow velocity. Part 1. Examination technique and normal values. Surg Neurol 1987;27:439–48 [DOI] [PubMed] [Google Scholar]
- 11.Schoning M, Buchholz R, Walter J. Comparative study of transcranial color duplex sonography and transcranial Doppler sonography in adults. J Neurosurg 1993;78:776–84 [DOI] [PubMed] [Google Scholar]
- 12.Kamiya A, Ando J, Shibata M, et al. Roles of fluid shear stress in physiological regulation of vascular structure and function. Biorheology 1988;25:271–78 [DOI] [PubMed] [Google Scholar]
- 13.Luscher TF, Tanner FC. Endothelial regulation of vascular tone and growth. Am J Hypertens 1993;6:283S–93S [DOI] [PubMed] [Google Scholar]
- 14.Liou TM, Chang WC, Liao CC. LDV measurements in lateral model aneurysms of various sizes. Experiments in Fluids 1997;23:317–24 [Google Scholar]
- 15.Sho E, Sho M, Singh TM, et al. Arterial enlargement in response to high flow requires early expression of matrix metalloproteinases to degrade extracellular matrix. Exp Mol Pathol 2002;73:142–53 [DOI] [PubMed] [Google Scholar]
- 16.Tromp G, Gatalica Z, Skunca M, et al. Elevated expression of matrix metalloproteinase-13 in abdominal aortic aneurysms. Ann Vasc Surg 2004;18:414–20 [DOI] [PubMed] [Google Scholar]
- 17.Kataoka K, Taneda M, Asai T, et al. Structural fragility and inflammatory response of ruptured cerebral aneurysms: a comparative study between ruptured and unruptured cerebral aneurysms. Stroke 1999;30:1396–401 [DOI] [PubMed] [Google Scholar]
- 18.Fukuda S, Hashimoto N, Naritomi H, et al. Prevention of rat cerebral aneurysm formation by inhibition of nitric oxide synthase. Circulation 2000;101:2532–38 [DOI] [PubMed] [Google Scholar]
- 19.Sadamasa N, Nozaki K, Hashimoto N. Disruption of gene for inducible nitric oxide synthase reduces progression of cerebral aneurysms. Stroke 2003;34:2980–84. Epub 2003 Nov 13 [DOI] [PubMed] [Google Scholar]
- 20.Morimoto M, Miyamoto S, Mizoguchi A, et al. Mouse model of cerebral aneurysm: experimental induction by renal hypertension and local hemodynamic changes. Stroke 2002;33:1911–15 [DOI] [PubMed] [Google Scholar]
- 21.Shojima M, Oshima M, Takagi K, et al. Magnitude and role of wall shear stress on cerebral aneurysm: computational fluid dynamics study of 20 middle cerebral artery aneurysms. Stroke 2004;35:2500–05 [DOI] [PubMed] [Google Scholar]
- 22.Ujiie H, Tachibana H, Hiramatsu O, et al. Effects of size and shape (aspect ratio) on the hemodynamics of saccular aneurysms: a possible index for surgical treatment of intracranial aneurysms. Neurosurgery 1999;45:119–30 [DOI] [PubMed] [Google Scholar]
- 23.Imbesi SG, Knox K, Kerber CW. Aneurysm flow dynamics: alteration of slipstream flow for neuroendovascular treatment with liquid embolic agents. AJNR Am J Neuroradiol 2003;24:2044–49 [PMC free article] [PubMed] [Google Scholar]
- 24.Jou LD, Quick CM, Young WL, et al. Computational approach to quantifying hemodynamic forces in giant cerebral aneurysms. AJNR Am J Neuroradiol 2003;24:1804–10 [PMC free article] [PubMed] [Google Scholar]
- 25.Steinman DA, Milner JS, Norley CJ, et al. Image-based computational simulation of flow dynamics in a giant intracranial aneurysm. AJNR Am J Neuroradiol 2003;24:559–56 [PMC free article] [PubMed] [Google Scholar]
- 26.Villablanca JP, Hooshi P, Martin N, et al. Three-dimensional helical computerized tomography angiography in the diagnosis, characterization, and management of middle cerebral artery aneurysms: comparison with conventional angiography and intraoperative findings. J Neurosurg 2002;97:1322–32 [DOI] [PubMed] [Google Scholar]
- 27.Villablanca JP, Martin N, Jahan R, et al. Volume-rendered helical computerized tomography angiography in the detection and characterization of intracranial aneurysms. J Neurosurg 2000;93:254–64 [DOI] [PubMed] [Google Scholar]
- 28.Isoda H, Hirao M, Takeda H, et al. Visualization of hemodynamics in a silicon aneurysm model using time-resolved, 3D, phase-contrast MRI. AJNR Am J Neuroradiol 2006;27:1119–22 [PMC free article] [PubMed] [Google Scholar]
- 29.Tateshima S, Grinstead J, Sinha S, et al. Intra-aneurysmal flow visualization by using phase-contrast magnetic resonance imaging: feasibility study based on a geometrically realistic in vitro aneurysm model. J Neurosurg 2004;200:1041–48 [DOI] [PubMed] [Google Scholar]