Abstract
BACKGROUND AND PURPOSE: Treatment of advanced stage squamous cell carcinoma of the upper aerodigestive tract with nonsurgical organ preservation protocols demonstrates improved cure rates with fewer comorbidities compared with surgery and radiation. The purpose of this study was to prospectively assess whether pretreatment evaluation of the primary site with quantitative CT perfusion measurements predicted response to induction chemotherapy and to create a prediction model to predict the response to induction chemotherapy in future patients.
METHODS: Seventeen patients who were enrolled in a prospective trial assessing surgical intervention versus a nonsurgical protocol underwent a pretreatment CT perfusion followed by direct laryngoscopy. After induction chemotherapy, tumor response was determined by the surgeon’s estimate of tumor volume. The CT perfusion parameters were correlated with the clinical response using a Wilcoxon rank-sum analysis. A logistic regression model was used to create a prediction based on the most significant CT perfusion parameter.
RESULTS: Elevated values of blood volume (P = .004) and blood flow (P = .03) were significantly correlated with >50% reduction in tumor volume after chemotherapy. A prediction model based on tumor blood volume demonstrated 91.7% sensitivity and 80.0% specificity, with an area under the receiver operating characteristic curve of 0.95.
CONCLUSION: Our preliminary data imply that tumors with elevated blood volume and blood flow were statistically associated with response to induction chemotherapy. These results suggest that pretreatment CT perfusion may be able to identify patients who will successfully respond to induction chemotherapy, which could potentially eliminate this step for subsequent patients when deciding on the appropriate treatment regimen.
Over the past decade, the treatment of squamous cell carcinoma of the upper aerodigestive tract has evolved from a surgery-based approach toward organ preserving chemoirradiation therapies. The traditional standard of care for patients in the United States with stage III and IV disease was surgical resection followed by radiation therapy. This approach resulted in significant difficulty with speech and swallowing, with survival rates ranging from 30%–40%.1 In Europe, radiation therapy was considered the standard of care despite lower survival rates compared with surgery because organ function was preserved. Chemotherapy was then introduced as an induction agent and radiosensitizer with initial results demonstrating an improvement in the overall survival of patients.2, 3 Recently there have been several prospective, randomized studies addressing the efficacy of concomitant chemoirradiation therapy versus radiation therapy alone for advanced-stage squamous cell carcinoma of the upper aerodigestive tract. These studies have demonstrated a statistically significant improvement in locoregional control and a trend toward improved overall survival while maintaining organ function.4–6 Thus, the standard of care for advanced stage squamous cell carcinoma of the upper aerodigestive tract has shifted away from primary surgical intervention and towards organ-preserving chemoirradiation protocols.
Because not all squamous cell carcinomas of the upper aerodigestive tract are equally responsive to chemotherapy, many institutions administer a short course of chemotherapy (induction chemotherapy) to determine whether the tumor will respond. At our institution, patients who do not respond to induction chemotherapy proceed directly to surgery followed by radiation therapy. The “gold standard” for assessing tumor response is direct laryngoscopy with biopsy under general anesthesia before and after induction chemotherapy. This procedure is invasive, with associated risks of hemorrhage and infection, as well as the underlying risks of general anesthesia. In addition, there is an element of subjectivity in that the assessment of tumor volume is limited by lack of complete visualization of the tumor depth. Development of an alternative, noninvasive, and efficacious method for assessment of tumor response could spare patients from these aforementioned risks. Anatomic imaging with CT or MR imaging is one approach, but these studies can sometimes be difficult to interpret depending on where the tumor is located. The ideal method for assessing whether a tumor would be sensitive to chemoirradiation therapies would be to develop a method to predict the tumor’s response based on the tumor’s inherent functional imaging characteristics with the goal of identifying patients in whom the need for induction chemotherapy could be eliminated.
Deconvolution-based CT perfusion is an imaging technique that can assess physiologic parameters such blood volume (BV), blood flow (BF), mean transit time (MTT), and capillary permeability surface area product (CP). CT perfusion is increasingly being used as a clinical tool for detection and characterization of intracranial mass lesions, tumor, infection, and infarction.7–9 Using these techniques, investigators have shown increased BF, BV, CP, and reduced MTT in squamous cell carcinoma of the head and neck compared with adjacent normal structures.10 Hermans et al11 demonstrated that CT-determined tumor perfusion is an independent predictor of local control in squamous cell carcinoma of the head and neck treated by definitive radiation therapy with or without chemotherapy. In a preliminary study comparing the use of CT perfusion parameters before and after induction chemotherapy for advanced squamous cell carcinomas of the upper aerodigestive tract, Gandhi et al12 showed a significant correlation of CT determined pretherapy BV and reduction of BV by 20% after induction chemotherapy when compared with endoscopic response. The purpose of this study was to expand and validate the work performed by Gandhi et al12 by assessing the correlation of preinduction chemotherapy CT parameters of advanced squamous cell carcinomas of the upper aerodigestive tract and response to induction chemotherapy as well as to develop a predictive model based on those results.
Methods
Patient Population
Seventeen patients with advanced (stage III and IV) squamous cell carcinoma of the upper aerodigestive tract were enrolled in a prospective trial in which response to neoadjuvant chemotherapy was assessed. Inclusion criteria for this study were: pathologically proved squamous cell carcinoma of the upper aerodigestive tract staged according to the American Joint Committee on Cancer criteria, no evidence of distant metastatic disease, a chest CT documenting no evidence of a second primary malignancy, a surgically resectable tumor, white blood cell count ≥3500/mm3, platelet count ≥100,000/mm3, creatinine clearance ≥60 mL/min, bilirubin <1.5 mg/dL, and age ≥18 years. Patients could not have had a prior head or neck malignancy, a history of head or neck irradiation, prior chemotherapy, a known medical contraindication to chemotherapy, prior surgical intervention to known malignancy (excluding biopsy), or a positive pregnancy test. All patients were informed of the investigational nature of the study and signed an informed written consent for participation in the trial.
Our study group included 11 men and 6 women. Patient ages ranged from 40 to 80 years with an average age of 55.4 years. The primary sites included oral tongue or base of tongue (n = 8), tonsil (n = 5), epiglottis (n = 3), and buccal mucosa (n = 1). The tumors were staged according to the TMN staging system. There were 6 stage III tumors with local staging of T3 N0 (n = 4) and T3 N1 (n = 2). There were 10 stage IV tumors with local staging of T1 N2c (n = 1), T2 N2a (n = 1), T2 N2b (n = 1), T2 N3 (n = 1), T3 N2b (n = 2), T4 N0 (n = 1), T4 N2b (n = 1), and T4 N2c (n = 2).
For longitudinal prospective assessment, all patients in this study were examined with routine CT scans of the neck, CT perfusion studies of the neck, and endoscopy under general anesthesia before undergoing induction chemotherapy. Tumor margins were marked during endoscopy using an injected India ink suspension. This technique permanently labels the site by intramural injection of pigment and facilitates site identification on subsequent endoscopies. CT perfusion studies were performed 1 day before endoscopy. Induction chemotherapy was comprised of cisplatin (100 mg/m2) on day 1 and 5-fluorouracil (1000 mg/m2) daily for 5 days. The mean time interval between initial CT perfusion study and repeat endoscopy after therapy was 33.5 days (range, 23–57 days).
Definition of Response
Under the clinical trial, patients with ≥50% reduction in tumor volume after induction chemotherapy, as measured by endoscopy, were classified as responders and received concomitant chemoirradiation therapy. Patients with less than 50% reduction in tumor volume were classified as nonresponders and underwent surgery and radiation therapy. Our aim was to develop a robust prediction model that would potentially identify patients who had either a low or a high probability of responding to induction chemotherapy. We sought to minimize the potential risk of treatment delay in nonresponders who would have to be subjected to a trial by using a more stringent criterion for response compared with the clinical trial. Therefore, for the development of the prediction model, only those patients who demonstrated greater than 50% reduction in tumor volume by follow-up endoscopy were classified as responders.
Blinding
The oncologist and the surgeon performing the endoscopy were blinded from the results of the CT and the CT perfusion studies. The radiologist evaluating the imaging studies was blinded from the results of the endoscopy and biopsy.
CT Perfusion Protocol
All perfusion CT studies were obtained on a multidetector scanner (LightSpeed Ultra; General Electric Medical Systems, Milwaukee, Wis). CT of the neck along with CT perfusion was performed by using the following technique. A “localizer” noncontrast CT was performed through the known primary site. The area of interest for measuring the perfusion was centered on the largest area of gross abnormality identified on the noncontrast localizing images. Four adjacent 5-mm sections were selected at the level of the tumor. Fifty milliliters of 300 mg/mL nonionic intravenous contrast were injected at 4 mL/s. At 5 seconds into the injection, continuous acquisition was initiated using the following parameters: 120 kV, 60 mA, 4 5-mm sections, and 1-second rotation for a duration of 50 seconds. The 1-second images were then reformatted at 0.5-second intervals, and the 5-mm sections were reformatted into 10-mm sections.
After completion of the perfusion acquisition, intravenous contrast was administered at 2 mL/s, and a routine CT of the neck was performed from the middle cranial fossa to the thoracic inlet using 2.5-mm contiguous sections (120 kV, 180 mA, and 0.8-second rotation). The perfusion data were postprocessed with the use of a commercially available Perfusion-2 software package on an Advantage Windows workstation (General Electric Medical Systems). A region of interest was placed in the ipsilateral internal carotid artery and internal jugular vein to generate contrast enhancement curves. The data were then processed into color maps representing CP, BF, BV, and MTT. A single observer, a neuroradiologist specializing in head and neck radiology who was aware of the primary tumor site, then obtained regions of interests through the primary tumor using the following method. After localizing the tumor on the contrast-enhanced CT, the level with the largest cross-sectional area of tumor was chosen. A user-defined region of interest was then drawn freehand, incorporating as much of the solid homogeneously perfused portions of the tumor as possible while omitting any necrotic portions of the tumor to reduce measurements of any associated peritumoral hyperemia (Fig 1).
Fig 1.
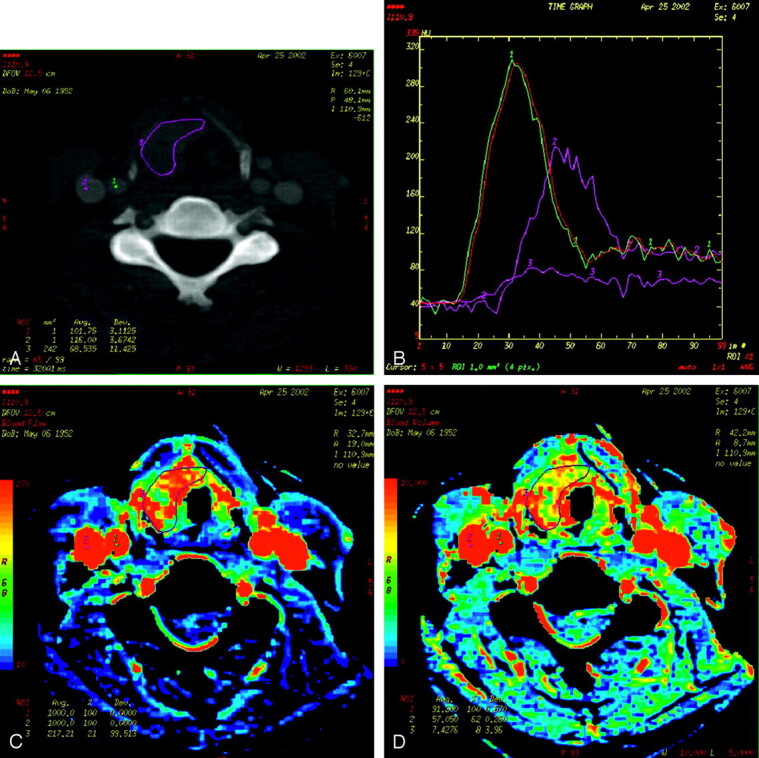
Examples of CT perfusion images for a patient with squamous cell carcinoma of the epiglottis.
A, Regions of interest are drawn within the ipsilateral internal carotid artery (1), internal jugular vein (2), and around the tumor margins (3).
B, Concentration curves of the previously selected regions of interest are plotted with Hounsfield units on the y-axis and time on the x-axis.
C, Corresponding BF map of the neck at the level of the epiglottic tumor.
D, Corresponding BV map of the neck at the level of the epiglottic tumor.
Data and Statistical Analysis
To determine a statistically significant difference in CT perfusion parameters between responders and nonresponders, the Wilcoxon rank-sum test, a nonparametric test for nonpaired data, was initially used. Potential predictors of response to induction chemotherapy considered were BF, BV, MTT, and CP. Each perfusion parameter was first screened for its relationship with response status by using a 2-group t test. A logistic regression model was constructed to predict response using the single best perfusion parameter. The adjusted odds ratio (OR) and its confidence interval were obtained from the final model as a measure of the association between the predictor and response. The discriminatory performance of the model was assessed by the receiver operating characteristic (ROC) curve analysis, where the area under the ROC curve was calculated for the final model. Subsequently, the probability of response was estimated from the final logistic regression model-based perfusion parameter data.
We used the bootstrap method to obtain more reliable estimates of the standard errors of our estimated ORs and their 95% confidence intervals; for this, we drew 300 bootstrap samples of size 50 with replacement. Bootstrapping is the method by which a repeated number of random samples are drawn with replacement from the observed samples to obtain a more reliable estimate of the standard error of the estimated odds ratio of the predictor variable. The precision of an estimated odds ratio is dependent on the sampling distribution of the odds ratio obtained from the sample drawn from the underlying population. Multiple random samples of the underlying population yield a more precise estimate of the distribution of the OR than a single sample.
All statistical analyses were performed using Stata 7.0 (Stata, College Station, Tex), and statistical significance was set at 0.05.
Results
Patient Response to Induction Chemotherapy
The estimate of tumor volume reduction was quantified by visual assessment of tumor volume relative to area tattooed at the time of the baseline endoscopy (Table 1). Twelve of 17 patients showed greater than 50% reduction in tumor volume after induction chemotherapy and subsequently underwent organ-preserving concurrent chemoirradiation therapy (responders). Three of 17 patients showed considerably less than 50% reduction in tumor volume after induction chemotherapy and subsequently underwent surgery followed by radiation therapy (nonresponders). Two of 17 patients had a 50% reduction in tumor volume and underwent organ-preserving concurrent chemoirradiation therapy. However, as discussed previously, these 2 patients were classified as nonresponders for purposes of the prediction model.
Table 1:
Location, stage of tumor, and the decrease in tumor volume as assessed by endoscopy
| Sex | Age | Tumor Location | TMN | Stage | Endoscopic Response (%) |
|---|---|---|---|---|---|
| M | 40 | Buccal mucosa | T3 N0 | III | 20 |
| M | 66 | Epiglottis | T3 N0 | III | 65 |
| F | 80 | Oral tongue | T3 N0 | III | 70 |
| F | 49 | Epiglottis | T3 N0 | III | 100 |
| M | 53 | Base of tongue | T3 N1 | III | 90 |
| M | 53 | Base of tongue | T3 N1 | III | 40 |
| M | 63 | Base of tongue | T1 N2c | IV | 95 |
| F | 57 | Tonsil | T2 N2a | IV | 70 |
| M | 55 | Base of tongue | T2 N2a | IV | 100 |
| M | 48 | Tonsil | T2 N2b | IV | 90 |
| M | 48 | Tonsil | T2 N3 | IV | 70 |
| F | 46 | Epiglottis | T3 N2b | IV | 60 |
| M | 46 | Tonsil | T3 N2b | IV | 100 |
| F | 72 | Base of tongue | T4 N0 | IV | 50 |
| M | 55 | Tonsil | T4 N2b | IV | 50 |
| F | 53 | Base of tongue | T4 N2c | IV | 20 |
| M | 58 | Base of tongue | T4 N2c | IV | 70 |
Note:—M indicates male; F, female.
CT Perfusion Parameters as Predictors of Response
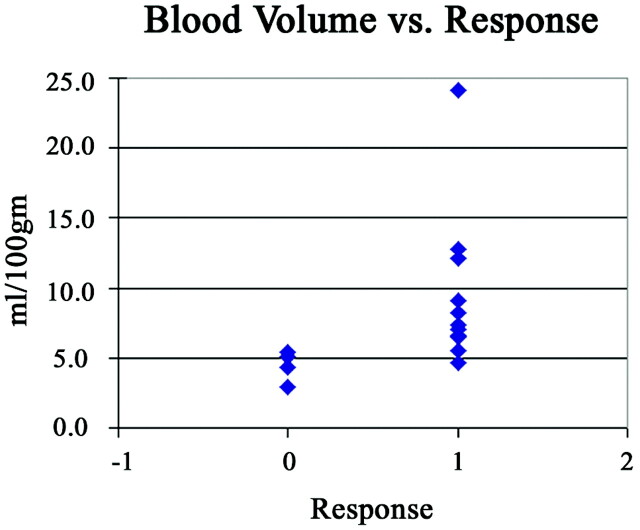
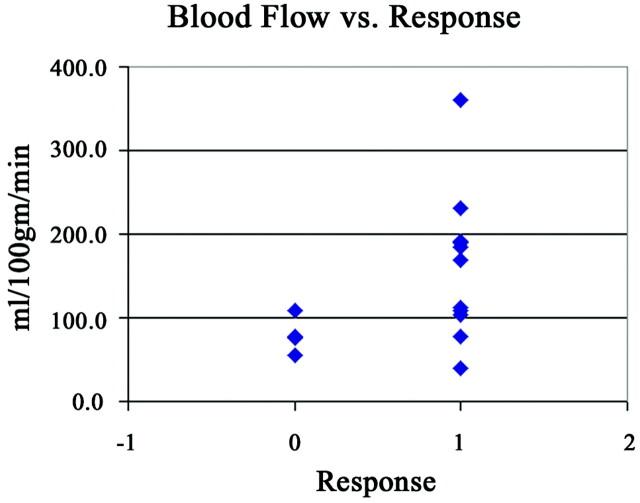
Responders had higher values of pretherapy BV, BF, and CP compared with nonresponders (Table 2). There were statistically significant correlations between higher values of BV (P = .004) and BF (P = .03) and endoscopic tumor response. The correlation between lower values of MTT (P = .29) and higher values of CP (P = .07) and endoscopic tumor response were not significant. Lower pretherapy levels of BV correlated with failed response to induction chemotherapy. The distribution of BV measurements in nonresponders was more tightly clustered with less overlap with responders than the distribution of BF in the same groups (Figs 2 and 3). Therefore, we used BV as the predictor of response to induction chemotherapy in the development of the model.
Table 2:
Means and ranges for the 4 CT perfusion parameters for responders and nonresponders
| BF (ml/100 g) | BV (ml/100 g) | MTT (seconds) | CP (ml/100 g/min) | |
|---|---|---|---|---|
| Responders | ||||
| Mean | 155.9 | 9.4 | 6.8 | 18.8 |
| Range | 39.1–361.0 | 4.6–24.2 | 2.4–12.6 | 9.8–27.1 |
| Nonresponders | ||||
| Mean | 78.5 | 4.6 | 5.4 | 14.2 |
| Range | 54.5–108.5 | 3.0–5.4 | 4.4–7.0 | 10.4–19.1 |
Note:—BF indicates blood flow; BV, blood volume; MTT, mean transit time; CP, capillary permeability
Fig 2.
The relationship to BV values as a function response, defined as >50% reduction in tumor volume as assessed by endoscopy.
Fig 3.
The relationship to BF values as a function response, defined as >50% reduction in tumor volume as assessed by endoscopy.
Model for Predicting Response to Induction Chemotherapy
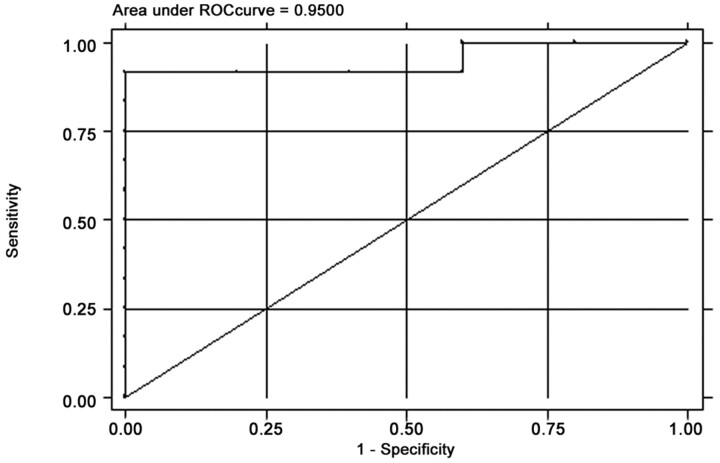
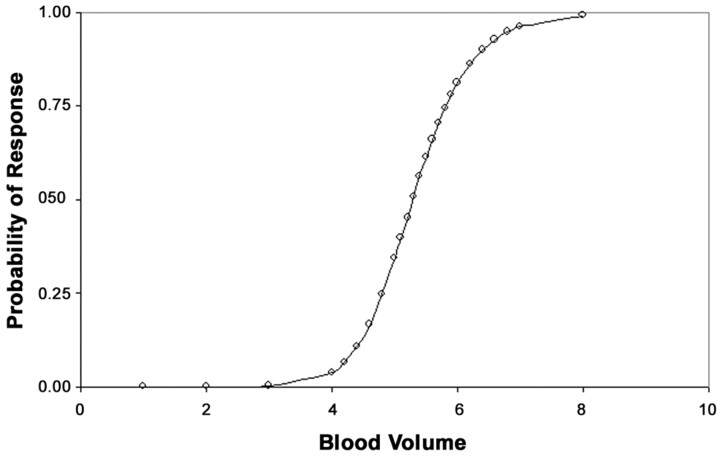
The final logistic regression model using BV for predicting response to induction chemotherapy had an area under the ROC curve of 0.95 (Fig 4), indicating excellent discrimination between responders and nonresponders. The model attained a sensitivity of 91.7% and a specificity of 80.0%. The adjusted OR for BV was 8.7, that is for every unit increase in BV the odds of response to induction chemotherapy increases by a factor of 8.7 times. Although the 95% confidence interval for the OR was 0.63 −120.48, which was not statistically significant (P = .11), the 95% confidence interval for the adjusted OR was 1.42 –3.38 after by using the bootstrap method with 300 bootstrap samples. The R2 for the model that measures of the amount of variation in the data attributable to the predictor (BV) was 0.59. Probability of response to induction chemotherapy is predicted as a function of BV is depicted in Fig 5. For example, all other factors being equal, a patient with a tumor BV of 4.3 mL /100 g has a 10% probability of response to induction chemotherapy while a patient with a tumor BV of 6.4 mL /100 g has a 90% probability of response.
Fig 4.
The area under the ROC curve for the predictive model.
Fig 5.
The probability of response to induction chemotherapy as a function of BV.
Discussion
Deconvolution based CT perfusion is an imaging technique that can assess physiologic parameters such BV, BF, MTT, and CP. It has been shown that squamous cell carcinomas of the head and neck have increased values of BF, BV, and CP and decreased values of MTT compared with healthy structures.10, 13 The elevated CT perfusion parameters in these tumors are probably due to the tumor neovascularity as demonstrated by angiography14, 15 and histochemical analysis of tumor specimens.16, 17 As such, higher levels of BF and BV as measured by CT perfusion may correlate with better oxygen and drug delivery and may be useful in predicting response to radiation therapy and/or chemotherapy.
Measurements of tumor perfusion assessed with dynamic CT or MR have been shown to be helpful in predicting response to radiation therapy as well as induction chemotherapy.11, 12, 18 In our study of 17 patients, pretherapy BV and BF CT perfusion parameters showed a significant correlation with endoscopic response to induction chemotherapy, P < .004 and P < .03, respectively. These findings confirm the findings of Gandhi et al12 that elevated pretherapy BV values correspond to a response to induction chemotherapy. Gandhi et al12 also showed a trend toward elevated BF values compared with nonresponders that was not statistically significant (P = .14). In our larger study, the trend toward elevated BF values became statistically significant (P = .03). In the current study, we also observed a trend toward higher CP (P = .07). These findings support the hypothesis that elevated tumor perfusion parameters (BV, BF, and CP) correspond to a favorable response to induction chemotherapy. In theory, the lower the MTT, the higher the vascularity of the tumor, which implies that tumors with lower MTT should respond to chemotherapy. The MTT was higher in the responder group (6.8 seconds) and lower in the nonresponder group (5.4 seconds) (P = .29). The apparent discrepancy may be due to sampling error. However, it is possible that MTT is insufficiently predictive of response compared with other perfusion parameters.
When response to induction chemotherapy is analyzed with respect to the T-stage of the tumor, there is a statistically significant trend toward response with lower T-stage tumors (P = .10). In our study; 1 of 1 staged T1 tumors, 4 of 4 staged T2 tumors, 6 of 8 staged T3 tumors, and 1 of 4 staged T4 tumors responded. It is noteworthy that only 1 of 4 T4 tumors responded to induction chemotherapy, implying that these tumors have probably outgrown their blood supply and thus delivery of chemotherapy is less than optimal.
As discussed previously, enrollment into organ preserving chemoirradiation protocols for treatment of advanced stages of squamous cell carcinoma of the upper aerodigestive tract requires a trial of induction of chemotherapy at our institution. The method currently used to assess tumor response to induction chemotherapy is direct laryngoscopy with biopsy under general anesthesia. These procedures are invasive, with associated risks of hemorrhage and infection as well as the inherent risks of general anesthesia. In addition, patients are subjected to the adverse effects associated with the trial of induction chemotherapy, which include nausea, vomiting, anemia, and gastrointestinal bleeding. For patients with a nonresponding tumor, these adverse effects could be avoided if the tumor’s response to chemotherapy could be determined before its administration. One of the goals of this research was to determine whether pretherapy CT perfusion parameters could be used to develop a predictive model for the response to induction chemotherapy.
We demonstrated that the distribution of BV measurements in nonresponders was more tightly clustered with less overlap with responders than the distribution of BF in the same group; thus, we used BV as the predictor of response to induction chemotherapy in the development of the prediction model. The final logistic regression model for predicting response to induction chemotherapy attained a sensitivity of 91.7% and a specificity of 80.0%. The area under the ROC curve was 0.95, indicating excellent discrimination between responders and nonresponders. The adjusted OR was 8.7 with a 95% confidence interval of 0.63–120.48 (P = .11), due in large part to the study’s small sample size of 17 patients. The 95% confidence interval is broad, reflecting the imprecision of the estimate rather that the significance of the association between increased BV values and response to induction chemotherapy. It is important to note the degree to which the 95% confidence interval exceeds 1. This is again reflected when the bootstrapping method was used to determine the 95% confidence interval, yielding an interval of 1.42–3.38. The adjusted OR of 8.7 suggests a substantial effect of increasing BV on induction chemotherapy response. Although this effect is not statistically significant, it does reinforce the trend seen in the earlier analysis by Gandhi et al.12
Figure 6 demonstrates the potential clinical application of the model. Because the model predicts the response to induction chemotherapy, its clinical benefit is to reduce the number of patients with advanced stage squamous cell carcinoma of the upper aerodigestive tract required to undergo induction chemotherapy as a means of determining their appropriate treatment regimen, as they would have to do at our institution. It should be noted that the slope of the probability curve is quite steep in the midportion of the graph, meaning that with the difference between a 25% response and that of a 75% response based on pretreatment, BV is only 0.50 mL/100 g which implies that its utility is at the extremes of the graph. For example, at our institution, if a 90% probability of response is deemed an acceptable probability, then those with BVs of 6.4 mL/100 g or greater could be placed directly into organ preservation therapy, and the remainder would proceed with induction chemotherapy. In this hypothetical situation, only 7 instead of the original 17 patients would have undergone induction chemotherapy, thereby expediting treatment for 10 patients and exposing only 7 patients to induction chemotherapy. Another way to use this model would be to offer induction chemotherapy only to those patients who had a greater than 10% pretest probability of responding to induction chemotherapy. Thus, patients with BVs of less than 4.3 mL/100 g would be immediately treated with surgery and radiation therapy. In this hypothetical situation, 2 patients of the original 17 patients would have proceeded directly to surgery and radiation without having to undergo induction chemotherapy and ultimately a delay in their definitive therapy. It is conceivable that the extremes of the model (10% and 90% probabilities) could be combined, which would have reduced the number of patients in the original study undergoing induction chemotherapy from 17 to 5, thus expediting definitive treatment for 12 patients.
Fig 6.
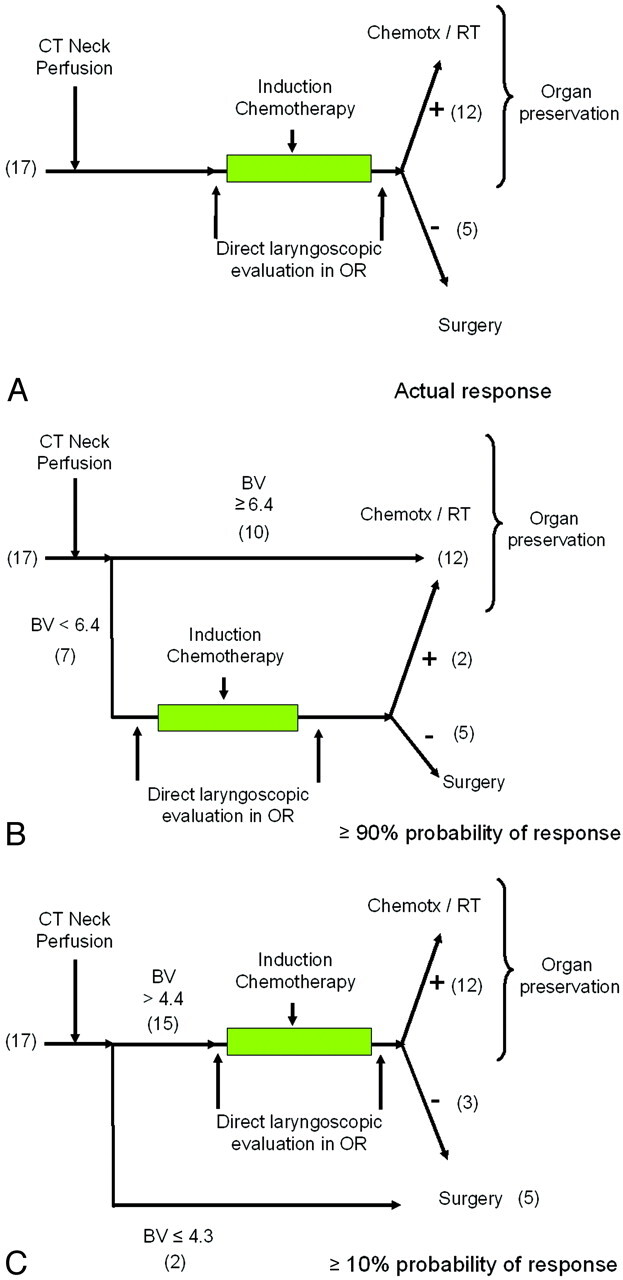
The potential use of the prediction model using the 17 patients in this study in clinical practice.
A, Actual response. In our patient population, all 17 patients underwent induction chemotherapy. Twelve patients responded (+) and received additional chemotherapy and radiation; 5 patients underwent surgery and radiation.
B, Using ≥90% pretest probability as a threshold. In this hypothetical application of the prediction rule, 10 patients would be directed immediately to organ preservation, whereas 7 patients would undergo induction chemotherapy. Of those 7 patients, 2 patients would respond and proceed to organ preservation therapy, and the remaining 5 patients would proceed to surgery and radiation.
C, Using ≥10% pretest probability as a threshold. In this hypothetical application, 2 patients would receive immediate surgery and radiation, whereas 15 would undergo induction chemotherapy. Using this low threshold, 3 patients would not respond to induction chemotherapy with potential delay in more invasive, but appropriate, surgery and radiation therapy.
The prediction model is limited by the small number of patients. Larger prospective studies would need to be performed to determine whether this predictive model can be applied to other tumor subsets or histologic findings. It is conceivable that the trend observed in this study of an elevated CP predicting response to induction chemotherapy may turn out to be statistically significant with the inclusion of additional patients. Ultimately, a model that could incorporate multiple CT perfusion parameters, such as BF as well as BV, might prove to be a more sensitive predictor of response. When more longitudinal data become available, correlation of initial tumor CT perfusion parameters to that of long-term clinical outcomes, such as length of local control and disease-free intervals, could then be performed, which would be more clinically relevant when determining whether a patient would be better served by surgery and radiation therapy versus an organ preservation protocol.
It should be noted that not all institutions subject patients to neoadjuvant/induction chemotherapy to determine whether patients could be successfully treated with nonsurgical organ preservation therapy or require surgery. Rather, most patients are initially treated based on clinical and imaging staging along with patient preference. It is possible that the results discussed in this article could be used to triage patients into surgical versus nonsurgical groups at other institutions where induction chemotherapy is not used. However, this would require a prospective multi-institutional study.
In conclusion, this study demonstrated that elevated CT perfusion parameters of BV and BF in advanced stage squamous cell carcinomas of the upper aerodigestive tract were statistically correlated to a response to a trial of induction chemotherapy. The result of these findings is the potential replacement of an invasive, subjective, and costly method for determining tumor response to induction chemotherapy with a noninvasive examination in CT perfusion. This paper also showed how the creation of a predictive model could be used in clinical practice as tool to help stratify patients into the appropriate treatment arm, thereby speeding time to definitive treatment, limiting or even eliminating a potentially dangerous and sometimes unnecessary trial of induction chemotherapy. It is also conceivable that this model could be used at other institutions where induction chemotherapy is not used to identify patients who would be better treated with surgery and radiation therapy than with organ-preserving protocols.
Footnotes
Paper previously presented at: Annual Meeting of the American Society of Head and Neck Radiology, September 21–25, 2005; San Francisco, Calif. The presentation was recognized with ASHNR’s Resident-in-Training Award.
References
- 1.Forastiere A, Koch W, Trotti A, et al. Head and neck cancer. N Engl J Med 2001;345:1890–900 [DOI] [PubMed] [Google Scholar]
- 2.Domenge C, Hill C, Lefebvre JL, et al. Randomized trial of neoadjuvant chemotherapy in oropharyngeal carcinoma. Br J Cancer 2000;83:1594–98 [DOI] [PMC free article] [PubMed] [Google Scholar]
- 3.Anonymous. Induction chemotherapy plus radiation compared with surgery plus radiation in patients with advanced laryngeal cancer. The Department of Veterans Affairs Laryngeal Cancer Study Group. N Engl J Med 1991;324:1685–90 [DOI] [PubMed] [Google Scholar]
- 4.Wendt TG, Granbenbauer GG, Rodel CM, et al. Simultaneous radiochemotherapy versus radiotherapy alone in advanced head and neck cancer: a randomized multicenter study. J Clin Oncol 1998;16:1318–24 [DOI] [PubMed] [Google Scholar]
- 5.Brizel DM, Albers ME, Fisher SR, et al. Hyperfractionated irradiation with or without concurrent chemotherapy for locally advanced head and neck cancer. N Engl J Med 1998;338:1798–804 [DOI] [PubMed] [Google Scholar]
- 6.Jeremic B, Shibamoto Y, Stanisavljevic B, et al. Radiation therapy alone or with concurrent low-dose daily either cisplatin or carboplatin in locally advanced unresectable squamous cell carcinoma of the head and neck: a prospective randomized trial. Radiother Oncol 1997;43:29–37 [DOI] [PubMed] [Google Scholar]
- 7.Cenic A, Nabavi DG, Craen RA, et al. A CT method to measure hemodynamics in brain tumors: validation and application of cerebral blood flow maps. AJNR Am J Neuroradiol 2000;21:462–70 [PMC free article] [PubMed] [Google Scholar]
- 8.Aksoy FG, Lev MH. Dynamic contrast-enhanced brain perfusion imaging: technique and clinical applications. Semin Ultrasound CT MR 2000;21:462–77 [DOI] [PubMed] [Google Scholar]
- 9.Roberts HC, Roberts TP, Lee TY, et al. Dynamic, contrast-enhanced CT of human brain tumors: quantitative assessment of blood volume, blood flow, and microvascular permeability: report of two cases. AJNR Am J Neuroradiol 2002;23:828–32 [PMC free article] [PubMed] [Google Scholar]
- 10.Gandhi D, Hoeffner EG, Carlos RC, et al. Computed tomography perfusion of squamous cell carcinoma of the upper aerodigestive tract. Initial results. J Comput Assist Tomogr 2003;27:687–93 [DOI] [PubMed] [Google Scholar]
- 11.Hermans R, Meijerink M, Van den Bogaert W, et al. Tumor perfusion rate determined noninvasively by dynamic computed tomography predicts outcome in head-and-neck cancer after radiotherapy. Int J Radiat Oncol Biol Phys 2003;57:1351–56 [DOI] [PubMed] [Google Scholar]
- 12.Gandhi D, Chepeha D, Carlos RC, et al. Correlation between initial and early follow-up CT perfusion parameters with endoscopic tumor response in patients with advanced squamous cell carcinomas of the oropharynx treated with organ preservation therapy. AJNR Am J Neuroradiol 2006;27:101–06 [PMC free article] [PubMed] [Google Scholar]
- 13.Rumboldt Z, Al-Okaili R, Deveikis JP. Perfusion CT for head and neck tumors: pilot study. AJNR Am J Neuroradiol 2005;26:1178–85 [PMC free article] [PubMed] [Google Scholar]
- 14.Robbins KT, Storniolo AM, Kerber C, et al. Rapid superselective high-dose cisplatin infusion for advanced head and neck malignancies. Head Neck 1992;14:364–71 [DOI] [PubMed] [Google Scholar]
- 15.Robbins KT, Fontanesi J, Wong FS, et al. A novel organ preservation protocol for advanced carcinoma of the larynx and pharynx. Head Neck 1996;122:853–57 [DOI] [PubMed] [Google Scholar]
- 16.Zatterstrom UK, Brun E, Willen R, et al. Tumor angiogenesis and prognosis in squamous cell carcinoma of the head and neck. Head Neck 1995;17:312–18 [DOI] [PubMed] [Google Scholar]
- 17.Carrau RL, Barnes EL, Snyderman CH, et al. Tumor angiogenesis as a predictor of tumor aggressiveness and metastatic potential in squamous cell carcinoma of the head and neck. Invasion Metastasis 1995;15:197–202 [PubMed] [Google Scholar]
- 18.Hoskin PJ, Saunders MI, Goodchild K, et al. Dynamic contrast enhanced magnetic resonance scanning as a predictor of response to accelerated radiotherapy for advanced head and neck cancer. Br J Radiol 1999;72:1093–98 [DOI] [PubMed] [Google Scholar]


