Abstract
BACKGROUND AND PURPOSE: Conventional imaging of ex-vivo brain at 1.5T in multiple sclerosis (MS) detects only a small fraction of the gray matter cerebral cortical lesions that can be detected by pathology. Our purpose was to examine if imaging at 8T can detect plaques in cortical gray matter (CGM) not evident at 1.5T.
METHODS: An ex-vivo brain obtained at autopsy from a patient with MS was formalin fixed and 1 cm coronal slices were examined using MR imaging at 8T.
RESULTS: Numerous cerebral cortical lesions not evident at 1.5T were seen at 8T. Lesions were easily identified using gradient-echo and spin-echo (SE) as well as diffusion images. MR imaging at 8T identified many of the types of plaques previously evident only by pathology. The magnitude of the cortical involvement in this 1 patient was severe. Lesions in the gray matter readily visible by high-field MR imaging were sometimes barely visible by pathology. MR imaging at 8T often facilitated the detection of such plaques by pathology.
CONCLUSION: This study establishes the utility of high-field imaging at 8T in the delineation of plaques in the cerebral CGM in MS.
Until recently, the occurrence of cortical gray matter (CGM) lesions in multiple sclerosis (MS) was unknown. In his seminal description of the pathology of multiple sclerosis, Charcot did not describe lesions in the cerebral cortex, and it was not until the descriptions by Brownell and Hughes in 19621and subsequently by Lumsden2 that the existence of lesions in the CGM in MS became apparent. Conventional staining techniques that best outlined white matter lesions in MS routinely failed to identify MS-related lesions in the gray matter, in part because such staining techniques are best designed to demonstrate pathologic conditions of the white matter and not the cortex. Recent studies using immunohistochemical stains for myelin have shown that involvement of the cortex by MS is the rule rather than the exception3,4; on occasion, the lesions in the cortex outnumber the lesions in the white matter.2 Using MR spectroscopy,5 quantitation of CGM volumes by MR imaging6,7 or using MR imaging fluid-attenuated inversion recovery (FLAIR) technique,8,9 cortical lesions have been demonstrated in the cerebral cortex of patients with MS using MR imaging at 1.5T. However, recent histopathologic studies have identified that the CGM lesions in patients with MS far exceed what conventional MR imaging can detect.10 Accordingly, until recently, cerebral cortical pathology has not been considered to be a significant component of this disorder.
We have developed the ability to image the brain in healthy subjects and patients with a variety of neurologic disorders using ultra-high-field strength MR imaging at 8T.11–14 We also have demonstrated that imaging at 8T can provide for excellent ultra-high-field images of the deep gray matter nuclei because of increased sensitivity to magnetic susceptibility and excellent signal-to-noise ratio (SNR) and contrast-to-noise ratio (CNR) noted at the higher magnetic field.11 Our early safety studies established that the technique is not only safe15,16 but also useful to better define the abnormalities in patients with MS as well as those with other disorders.15 Early observations from imaging patients with MS at 8T did not disclose obvious CGM abnormalities, though the presence of such abnormalities in MS is well known to occur. Recently, we had the opportunity to examine, ex vivo, the brain of a patient with MS using imaging at 8T. The enhanced resolution of ultra-high-field imaging, together with the ability to examine the brain by pathologic examination, allowed visualization of CGM plaques in MS with a level of clarity unprecedented in imaging and until now possible only by histopathologic examination.
Methods and Materials
Patient
A 42-year-old man with severe disabilities secondary to MS died of aspiration pneumonia. In the year before his death, he had been seen at our medical center on 2 occasions, mostly for palliative care. He was bed-bound and very dependent for all activities of daily living. He was paraplegic with additional severe weakness of the upper extremities, which were also severely ataxic. The ataxia also affected his trunk and prevented him from sitting unassisted in a standard wheelchair. He had complete bilateral internuclear ophthalmoplegia, vertical nystagmus, and severe titubation of his head. His ability to communicate was intact, though his speech was barely intelligible. His mentation seemed intact; he remained completely oriented and participated in all decisions of his care, including his desire to have his brain evaluated for scientific endeavors after death. He needed to be fed through a percutaneous gastrostomy tube. Cognitive status could not be formally evaluated because of the severity of his disabilities. The duration of his disease was estimated to be approximately 12 years. At the time of his demise, he was considered to be in the advanced stages of the secondary-progressive form of MS. His general health was otherwise excellent, and he had no known cardiovascular, cerebrovascular, hypertensive, or diabetes-related disabilities.
Autopsy
Death was confirmed to be secondary to aspiration pneumonia. Autopsy was performed approximately 8 hours after death. After removal, the brain was fixed in 20% buffered formalin solution for 2 weeks and subsequently sectioned in the coronal plane at 1-cm intervals from the frontal to the occipital poles for imaging. After imaging, tissues from the areas of interest from the fixed brain were submitted for overnight processing in formalin and graded alcohol solutions and subsequent paraffin embedding. Consecutive 5–10-μm sections were obtained for subsequent staining using hematoxylin-eosin, or myelin staining using Luxol fast blue and periodic-acid-Schiff staining.
Imaging at 1.5T
All images were obtained on a 1.5T MR imaging system (Signa LXCVI 8.4; GE Healthcare, Milwaukee, Wis) using a standard quadrature head radio frequency (RF) coil. T1-weighted conventional spin-echo (SE) images were obtained with TR = 800 ms and TE = 15 ms. A dual-echo turbo SE image acquisition used TR = 3300 ms and TE = 15, 45, 60, and 90 ms. A gradient recalled-echo (GRE) sequence was obtained using TR = 650 ms, TE = 10 ms with a flip angle of 45°. In all these sequences the matrix used was 512 × 512, FOV = 20 cm, section thickness was 5 mm, and there was 1 excitation with an acquisition time of 6 minutes. FLAIR images were obtained with a TR = 9000 ms, TE = 140 ms, TI = 2500 ms, FOV 15, section thickness 5 mm, matrix 512 × 512, and NEX of 2.
Imaging at 8T
The construction and design of the whole-body 8T scanner has been described previously.17 The brain sections were imaged using a 2-strut RF coil of transverse electromagnetic (TEM) design. The imaging was performed using the TEM coil for excitation and acquisition of the images with an 8T/80-cm whole-body MR imaging scanner. The TEM coil was used in a 2-port excitation/receive mode. The acquisition times and parameters were chosen to mirror those used in live patients. Typical GRE image acquisition parameters at 8T were: TR = 750 ms, TE = 12 ms, matrix = 512 × 512 with acquisition time of 6 minutes, and 1024 × 1024 matrix with an acquisition time of 12 minutes, receiver bandwidth = 50 KHz, single excitation, no averaging, section thickness = 2 mm, and flip angle = 20°. The T2-weighted SE sequence was used to acquire images with typical parameters of TR = 1000 ms, TE = 22 ms, matrix = 1024 × 1024, receiver bandwidth = 70 KHz, single excitation, and section thickness = 2 mm. Registration of the lesions for their subsequent identification by pathologic examination was achieved by identification of the location of the lesions and noting their relationship to the deep medullary veins.
Results
Autopsy Findings
The fixed brain weighed 1290 g. On external examination, the brain stem and cerebellum were remarkable for several small, gray, depressed surface lesions (0.3 × 0.2 to 0.4 × 0.2 cm). Serial coronal sections through the cerebral hemispheres demonstrated multiple, irregular, circumscribed, slightly depressed and cavitated lesions that were located predominantly in the subcortical white matter, gray-white junctions, and periventricular regions. The lesions varied in size from 0.3 × 0.2 to 2.9 × 1 cm.
Pathologic Findings
On microscopic examination, most of the lesions in the white matter were chronic, hypocellular, and with reactive astrocytosis. Occasional scattered foamy macrophage infiltration and perivascular lymphocytosis within the lesions as well as in the adjacent areas were observed in the few active lesions. Adjacent to these lesions some leptomeningeal infiltrates were also observed; overall, however, the lesions were mostly chronic and gliotic rather than acute with active demyelination. Luxol fast blue stains (for myelin) revealed significant demyelination in the lesions located in subcortical white matter, gray-white junctions, and the periventricular areas. CGM lesions were not readily evident by pathology; often, the presence of a lesion in the CGM by pathology was identified on the basis of the presence of abnormalities observed on the 8T images.
Images at 1.5 and 8T
Image acquisition parameters optimized for imaging at 1.5T resulted in poor resolution at 8T and vice versa. Accordingly, the best images obtained at 1.5T were compared with the best images obtained at 8T, though the techniques used in acquisition were significantly different. T2-weighted images and FLAIR sequences were used to highlight the plaques at 1.5T. The significantly higher SNR at 8T permitted the ability to examine matrices of 1024 × 1024. A similar matrix size would be impossible at 1.5T without increasing the acquisition time by a factor of 5. SE T2-weighted images obtained at 1.5T were compared with GRE and SE sequences obtained at 8T. At the standard resolution at 1.5T (ie, approximately 1 mm), no cortical lesions could be identified within any section with certainty. Furthermore, it was impossible to discern any details of cortical architecture in the best images with 1.5T. By contrast, at 8T, the high resolution of lesions and normal anatomy was such that in the same region of interest, numerous discrete cortical lesions could be identified. Because of the strong role of relaxations in visualizing these cortical lesions, both SE and GRE visualized them with clarity, even though contrast is higher with SE in vitro. Because of the dominance of T2 weighting related to the short T2 values of tissues at this field strength, it is not feasible to acquire T1-weighted images using simple SE sequence. As such, the field dependence of both T1 and T2 on SE images will contribute to imposition of a weighting that will be more T2-like at 8T. All of the patterns of cortical involvement defined by Kidd et al4 could be identified using imaging at 8T (Figs 1–7).
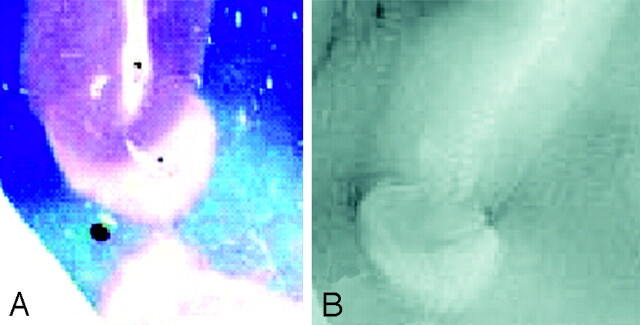
Fig 1.
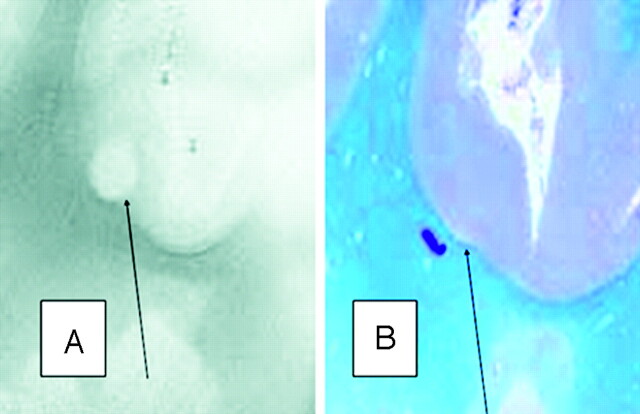
A, SE T2-weighted image, TR = 750 ms, TE = 20 ms, FOV = 15 cm, matrix = 1024 × 1024, and section thickness = 1 mm.
B, Luxol fast blue stain at approximately 400×. Type 1 cortical lesion. The lesion involves the deeper cortical layers and is clearly seen on MR imaging (A) and barely noticeable by pathology (B).
Fig 7.
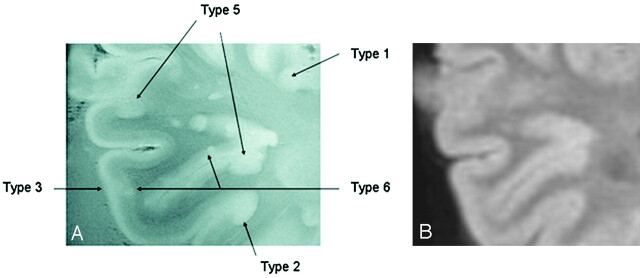
A, GRE T2-weighted image, TR = 500, TE = 11, FOV = 15 cm, matrix = 1024 × 1024, and section thickness = 1 mm. Multiple patterns are evident within a region of interest in which 5 different patters of involvement of the cerebral cortex can be identified.
B, Corresponding FLAIR T2-weighted image at 1.5T for comparison fails to demonstrate the cortical lesions noted in A at 8T.
Another indication of the unique nature of high field MR imaging in revealing the subtle structures is that the laminar nature of the normal cortex could be defined at 8T. Here, in addition to the CNR, which is a function of T1, T2, and imaging parameters of TR and TE, the concomitant high SNR has made such visualization possible. Although 6 layers of neurons form the normal human neocortex, this MR imaging method could define 3 layers consistently. A prominent high-signal intensity band was evident coursing through the entire cortex, representing what is probably a band of myelin in the cerebral cortex. The laminate organization of the cortex was lost in some areas of cortical plaques. Whether such disorganization is an adaptive rearrangement of the cortical neurons because of injury, a phenomenon preceding the occurrence of a cortical plaque, or is unconnected to an MS-related pathologic condition is unknown.
Discussion
The detection of CGM plaques in the brain of an MS patient was examined ex vivo using brain sections obtained at autopsy by imaging at 8T and 1.5T. The patient chosen was ideal in that he had advanced secondary-progressive MS, and gray matter damage is more typical of the late phases of the disease, though damage has recently been noted even in the early stages. Acquisition parameters comparable with what are used in patients during life were used to acquire the images thus keeping the acquisition times comparable. Using imaging parameters at 8T that are typically used at 1.5T is not possible because of the differences in the magnetic fields and would not produce good images of diagnostic quality. Numerous CGM lesions were detected at 8T, and most types of cortical lesions described and classified by other investigators using pathologic examination could be detected by imaging at 8T but not 1.5T. Our findings are similar to those of other investigators, who have noted that only a fraction of the lesions seen by pathologic examination can be identified in the ex vivo brain using the best techniques available at 1.5T.10 By contrast, the present study has established that high-field imaging is superior to imaging at 1.5T field in defining plaques in the CGM of the brain in MS.
The study by Guerts et al10demonstrated that CGM lesions were visible with much less conspicuity at 1.5T than on pathologic examination, even though their images were optimized for the best SNR. This would suggest that the enhanced visualization of MS lesions at 8T is not simply a matter of improved SNR, which is 5–20 times higher at 8T. Neither does it seem to be related to just myelin content in the cortex; if that were the case, CGM lesions should be detected just as well at any field strength because myelin can be imaged well at lower field strengths. In fact, the modification of relaxation mechanisms at 8T and its impact on the CGM tissues and lesions enabled detection of the CGM pathology in the present study. Imaging at 8T was superior to standard MR imaging with regard to both SNR and CNR. These combinations of parameters are impossible to mimic at lower field strengths. As such, even under extreme conditions of unusually long acquisition times at 1.5T, the relative values of T1, T2, TR, and TE required for visualization of these cortical plaques would not have materialized. The incidence of cortical involvement as judged by conventional MR imaging at 1.5T is small and a gross underestimation of the true involvement. In previous studies, the cortical lesion load in cases of relapsing-remitting MS, as measured by conventional MR imaging, represents less than 6% of the total lesion volume and did not correlate with disability measures or neurocognitive tests.6 Investigators have been repeatedly frustrated by modest correlation of conventional MR imaging measures with clinical disability, particularly with cognitive impairment in MS.
Why is the visualization of CGM lesions at 8T so much better than at 1.5T, and what is the utility of ex vivo imaging using this technique during the life of the individual? A large part of the answer has to do with the improvement not only in SNR but also in CNR that occurs at the higher field strength. At 8T, the SNR is at least 5 and up to 20 times higher than at 1.5T. In addition, there are enhancements of CNR as a consequence of the changes in relaxation parameters at high-field-strength imaging. As shown by Cremillieux et al,18 the T2 relaxation measured at 7T in the cortex is 41.8 ms, compared with the 47.9 ms measured at the hippocampus. In this study, the T2 relaxation for the cortex at 8T was recorded at 40 ms, very similar to that at 7T. As such, the shorter T2 in the cerebral cortex could be interpreted as having been caused by diffusion in susceptibility gradients, which is much more severe at 8T compared with 1.5T. In addition to these factors, the myelin content could also be reflected in T1 values as well as multicomponent T2 calculations. Such studies will require in vivo measurements to reliably quantify myelin content at high field strength. That was not the objective of this study. Our objective was to demonstrate effects other than high SNR that contribute to visualization of these lesions. Despite the clear detection of CGM lesions the images obtained from live patients with MS, using imaging at 8T has not identified CGM plaques with a degree of clarity that we identified in the ex vivo brain. This may be due in part to the degradation of images because of motion, dielectric resonances that cause RF inhomogeneity of magnetic field at high field strength, and the significant susceptibility effect caused by the large change in tissue attenuation between calvaria and the adjacent tissues.19 Because the parameters used for imaging the sections used acquisition modes similar to what we have previously used in our patients, it may be possible to modify imaging methods at 8T to permit visualization of CGM cortical plaques in the live patient. With the acquisition parameters used in this study, we have previously acquired ultra-high-resolution GRE images of the human brain at 8T with a whole-head in-plane resolution of 0.1 mm, or 100 μm, in a clinically acceptable timeframe.13 The use of a specially made 2-strut RF coil of transverse electromagnetic design was aimed at producing homogeneous images in a coronal plane. This allowed the acquisition of SE and GRE images from the brain sections from a pixel volume of 0.02 mm3 or 20 nL. The capability of in vivo acquisition from such minute volume within a human head opens a new horizon for the high-resolution study of pathologic conditions. This amounts to more than a 50-fold increase of in-plane resolution relative to conventional 256 × 256 images obtained with a 20-cm field of view and a 5-mm section thickness using the 1.5T magnet. The improved SNR and CNR observed in ultra-high-field MR imaging could be used to acquire images with a level of resolution and contrast approaching the histologic level under in vivo conditions. It is worth noting that sections were measured with identical parameters (ie, 2 mm) first, but the 1.5T images had even poorer quality than those shown here when acquisition time was the same. As such, the best images were chosen, without emphasis on identical parameters that did not improve the comparison anyway, resulting in the choice of 5-mm section thickness at 1.5T. The images at 8T presented in this study represent a significant advance in our ability to examine small anatomic features in the cerebral cortex with noninvasive imaging methods. Further, we anticipate that the utility of this technology can be safely adapted to in vivo imaging of patients, permitting, for the first time, adequate visualization of the CGM plaques.
At 1.5T, the T1 for white matter is approximately 800 ms and for gray matter is 900 ms. The T2 of white matter at 1.5T is 100 ms and that of gray matter is 90 ms. By 1 report, white matter T2 is 46 ms and gray matter T2 is 55 ms at 7T.20 As such, there is a drastic decrease in T2 relaxation time as field strength increases from 1.5T to 8T. Such a decrease cannot be described by the iron content alone. The mechanisms of magnetic susceptibility gradients are also likely to play a role in field-dependent T2 decrease. As such, the relevant research question that our work addresses is the role of field strength to modify relaxation properties of the healthy tissues, normal white matter/gray matter contrast, pathologic tissues, and CGM lesions to the extent of enhancing their visualization beyond the mere increase in SNR. Furthermore, although 1.5T images have a resolution with 3.2-mm3 voxels, 8T image voxels are 0.02 mm3. This means that 8T voxels are more than 100 times smaller, which indicates that decreasing T2 with field strength is partially caused by the process of enhancing the role of the myelin water (ie, prolongation of T1).
The recognition of involvement of the cerebral cortex in MS has resulted in attempts by investigators to define this abnormality by MR imaging. Visualization of the CGM lesions in the live patient has been less than optimal, even using FLAIR8 or multi-slab 3D double inversion-recovery techniques at 1.5T.9 Indirect evidence of diseases in the cortex, however, has been obtained using MR imaging and spectroscopy at 1.5T. Attempts to correlate CGM volume decreases in relapsing-remitting MS patients to cognitive impairment and disability have yielded conflicting results.6,7,21–23 By spectroscopy, normal-appearing gray matter was shown to be abnormal in a significant number of MS patients.5 Quantitative structural MR techniques, including measures of magnetization transfer, diffusion, relaxation times, and spectroscopic metabolite concentrations, have also revealed that there are abnormalities in normal-appearing white and gray matter.24 By contrast, instead of indirect methods, in this study we have established the utility of high-field imaging in directly defining CGM lesions in MS previously possible only by pathology. Because the acquisition parameters used in this study can be used in live patients, we hope that with optimization, we will be able to extend these observations and visualize these lesions in patients by using MR imaging at 8T.
Fig 2.
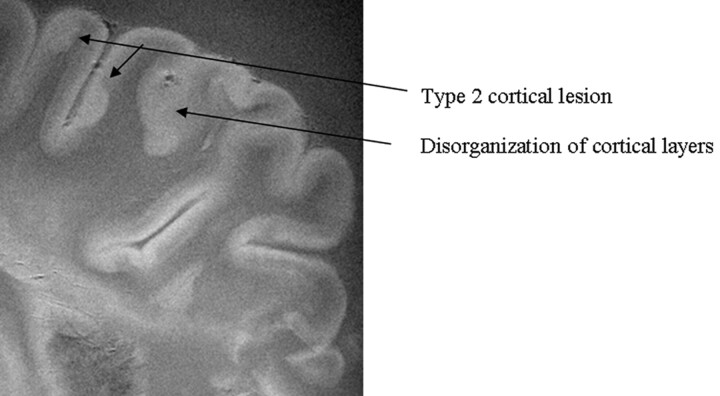
SE diffusion T2-weighted image, TR = 1000 ms, TE = 65 ms, FOV = 15 cm, matrix = 512 × 512, and thickness = 1 mm. Type 2 cortical lesions. These cortical lesions involve all layers of the cortex, and the normal trilaminar appearance is lost. The subcortical white matter is unaffected. Disorganization of the cortical layers is the hallmark of this pattern.
Fig 3.
SE T2-weighted image, TR = 750 ms, TE = 20 ms, FOV = 15 cm, matrix = 1024 × 1024, and section thickness = 1 mm. Type 3 cortical lesions. Bandlike areas of demyelination along the outer cortical layers spanning adjacent gyri result in extensive involvement of the cortex.
Fig 4.
A, Luxol fast blue stain at approximately 400×.
B, GRE T2-weighted image, TR = 500, TE = 11, FOV = 15 cm, matrix = 1024 × 1024, and section thickness = 1 mm. Type 4 cortical lesion. Involvement predominantly affects the subcortical U-fibers, resulting in a juxtacortical lesion extending into the cortex.
Fig 5.
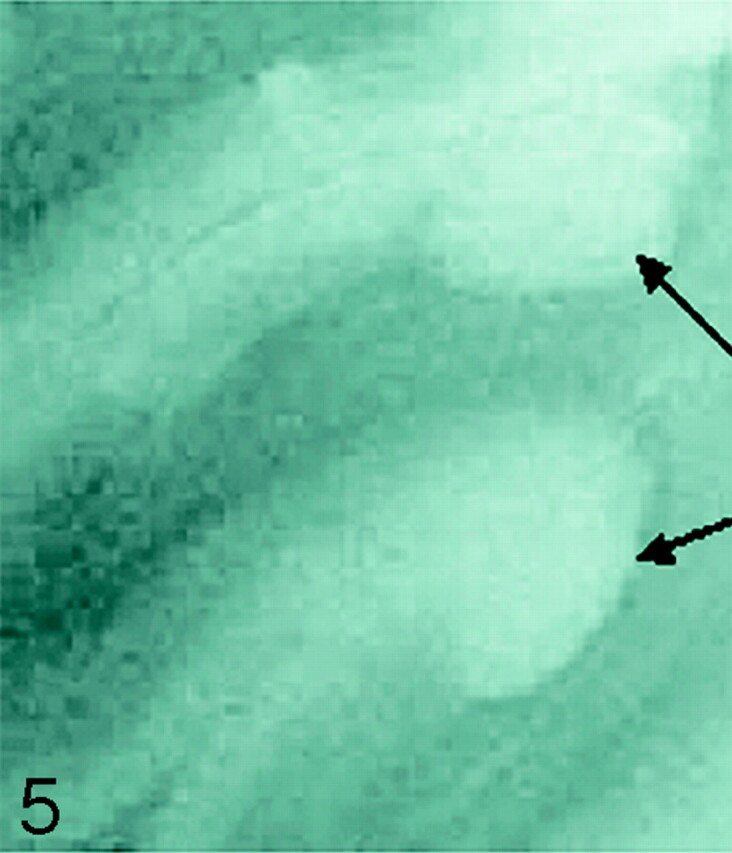
SE T2-weighted image, TR = 750 ms, TE = 20 ms, FOV = 15 cm, matrix = 1024 × 1024, section thickness = 1 mm. Type 5 cortical lesions (arrows). Lesion extends from all layers of the cortex to the adjacent white matter. The adjacent white-matter involvement distinguishes these lesions from type 2 lesions, which are restricted to the layers of the cortex only.
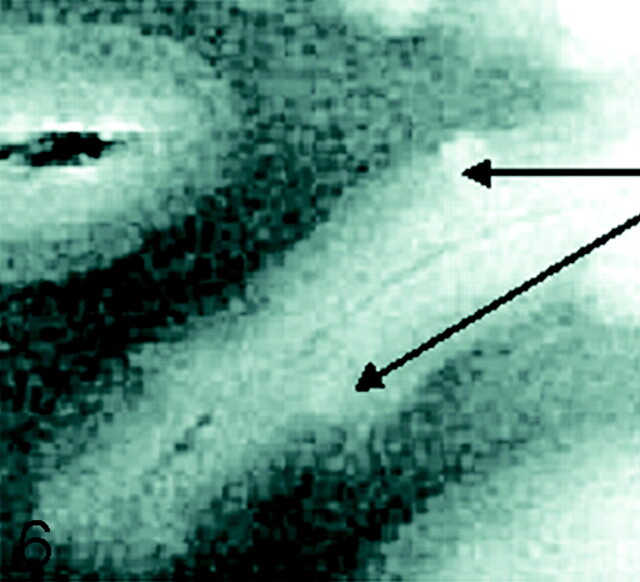
Fig 6.
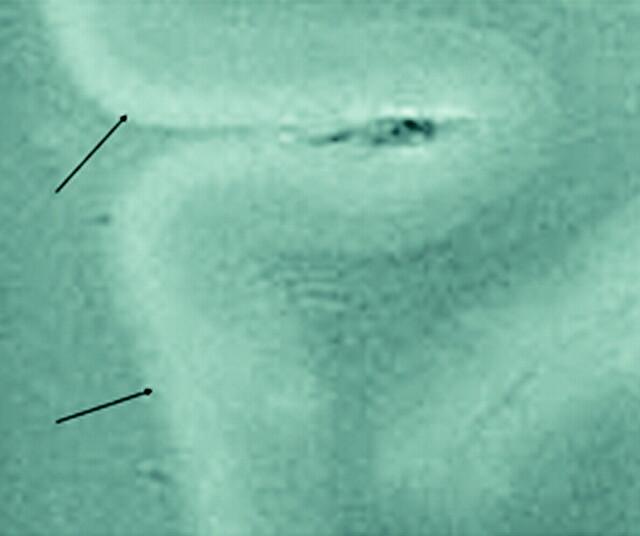
SE diffusion T2-weighted image, TR = 1000 ms, TE = 65 ms, FOV = 15 cm, matrix = 512 × 512, and section thickness = 1 mm. Type 6 cortical lesions. Small and multiple lesions that occur across the cortical ribbon in any layers of the cortex.
References
- 1.Brownell B, Hughes JT. The distribution of plaques in the cerebrum in multiple sclerosis. J Neurol Neurosurg Psychiatry 1962;25:315–20 [DOI] [PMC free article] [PubMed] [Google Scholar]
- 2.Lumsden CE. The Neuropathology of Multiple Sclerosis. Amsterdam: North-Holland;1970. :217–309
- 3.Peterson JW, Bo L, Mork S, et al. Transected neurites, apoptotic neurons, and reduced inflammation in cortical multiple sclerosis lesions. Ann Neurol 2001;50:389–400 [DOI] [PubMed] [Google Scholar]
- 4.Kidd D, Barkhof F, McConnell R, et al. Cortical lesions in multiple sclerosis. Brain 1999;122:17–26 [DOI] [PubMed] [Google Scholar]
- 5.Sharma R, Narayana PA, Wolinsky JS. Grey matter abnormalities in multiple sclerosis. proton magnetic resonance spectroscopic imaging. Mult Scler 2001;7:221–26 [DOI] [PubMed] [Google Scholar]
- 6.Catalaa I, Fulton JC, Zhang X, et al. MR imaging quantitation of gray matter involvement in multiple sclerosis and its correlation with disability measures and neurocognitive testing. AJNR Am J Neurorad 1999;20:1613–18 [PMC free article] [PubMed] [Google Scholar]
- 7.De Stefano N, Matthews PM, Filippi M, et al. Evidence of early cortical atrophy in MS: relevance to white matter changes and disability. Neurology 2003;60:1157–62 [DOI] [PubMed] [Google Scholar]
- 8.Bakshi R, Ariyaratana S, Benedict RH, et al. Fluid-attenuated inversion recovery magnetic resonance imaging detects cortical and juxtacortical multiple sclerosis lesions. Arch Neurol 2001;58:742–48 [DOI] [PubMed] [Google Scholar]
- 9.Geurts JJ, Pouwels PJW, Uitdehaag BM, et al. Intracortical lesions in multiple sclerosis: improved detection with 3D double inversion-recovery MR imaging. Radiology 2005;236:254–60 [DOI] [PubMed] [Google Scholar]
- 10.Geurts JJ, Bo L, Pouwels PJ, et al. Cortical lesions in multiple sclerosis: combined postmortem MR imaging and histopathology. AJNR Am J Neuroradiol 2005;26:572–77 [PMC free article] [PubMed] [Google Scholar]
- 11.Bourekas EC, Christoforidis GA, Abduljalil AM, et al. High resolution MRI of the deep gray nuclei at 8 Tesla. J Comput Assist Tomogr 1999;23:867–74 [DOI] [PubMed] [Google Scholar]
- 12.Kangarlu A, Abduljalil AM, Schwarzbauer C, et al. Human rapid acquisition with relaxation enhancement imaging at 8 T without specific absorption rate violation. MAGMA 1999;9:81–84 [DOI] [PubMed] [Google Scholar]
- 13.Robitaille PM, Abduljalil AM, Kangarlu A, et al. Human magnetic resonance imaging at 8 T. NMR Biomed 1998;1:263–65 [DOI] [PubMed] [Google Scholar]
- 14.Robitaille PM, Abduljalil AM, Kangarlu A. Ultra high resolution imaging of the human head at 8 tesla: 2K × 2K for Y2K. J Comput Assist Tomogr 2000;24:2–8 [DOI] [PubMed] [Google Scholar]
- 15.MRI safety. Food and Drug Administration Web site. Available at: http://www.fda.gov/cdrh/ode/guidance/793.html. Accessed April 5, 2006.
- 16.Kangarlu A, Burgess RE, Zhu H, et al. Cognitive, cardiac, and physiological safety studies in ultra high field magnetic resonance imaging. Magn Reson Imaging 1999;17:1407–16 [DOI] [PubMed] [Google Scholar]
- 17.Robitaille PM, Warner R, Jagadeesh J, et al. Design and assembly of an 8 tesla whole-body MR scanner. J Comput Assist Tomogr 1999;23:808–20 [DOI] [PubMed] [Google Scholar]
- 18.Cremillieux Y, Ding S, Dunn JF. High-resolution in vivo measurements of transverse relaxation times in rats at 7 Tesla. Magn Reson Med 1998;39:285–90 [DOI] [PubMed] [Google Scholar]
- 19.Kangarlu A, Baertlein BA, Lee R, et al. Dielectric resonance phenomena in ultra high field MRI. J Comput Assist Tomogr 1999;23:821–31 [DOI] [PubMed] [Google Scholar]
- 20.Yacoub E, Duong TQ, Van De Moortele P-F, et al. Spin-echo fMRI in humans using high spatial resolutions and high magnetic fields. Magn Reson Med 2003;49:655–64 [DOI] [PubMed] [Google Scholar]
- 21.Amato MP, Bartolozzi ML, Zipoli V, et al. Neocortical volume decrease in relapsing-remitting MS patients with mild cognitive impairment. Neurology 2004;63:89–93 [DOI] [PubMed] [Google Scholar]
- 22.Chen JT, Narayanan S, Collins DL, et al. Relating neocortical pathology to disability progression in multiple sclerosis using MRI. Neuroimage 2004;23:1168–75 [DOI] [PubMed] [Google Scholar]
- 23.Sailer M, Fischl B, Salat D, et al. Focal thinning of the cerebral cortex in multiple sclerosis. Brain 2003;126:1734–44 [DOI] [PubMed] [Google Scholar]
- 24.Miller DH, Thompson AJ, Filippi M. Magnetic resonance studies of abnormalities in the normal appearing white matter and grey matter in multiple sclerosis. J Neurol 2003;250:1407–19 [DOI] [PubMed] [Google Scholar]


