

Abstract
BACKGROUND AND PURPOSE: Recent evidence from neuropsychologic and neuroimaging studies suggests that central nervous system involvement in amyotrophic lateral sclerosis (ALS) extends beyond motor neurons. Our purpose was to obtain measures of global and regional atrophy in nondemented patients with ALS to assess subtle structural brain changes.
METHODS: MR images, acquired from 16 patients and 9 healthy subjects (HS), were processed by using the Structural Imaging Evaluation of Normalized Atrophy (SIENA) software to estimate whole-brain atrophy measures and the voxel-based morphometry (VBM) method to highlight the selective volumetric decrease of single cerebral areas. In addition, each subject underwent a neuropsychologic examination.
RESULTS: In patients with ALS, brain parenchymal fraction was slightly lower compared with HS (P = .012), and seemed to be related to the presence of cognitive impairment. Patients showed a gray matter volume decrease in several frontal and temporal areas bilaterally (P < .001 uncorrected) compared with HS, with a slight prevalence in the right hemisphere. No volume reduction in primary motor cortices of patients was detected. Performances on Symbol Digit Modalities Test were significantly worse in patients compared with HS (P = .025).
CONCLUSIONS: The presence of mild whole-brain volume loss and regional frontotemporal atrophy in patients with ALS could explain the presence of cognitive impairment and confirms the idea of ALS as a degenerative brain disease not confined to motor system.
Amyotrophic lateral sclerosis (ALS) is a chronic progressive neuromuscular disease of unknown etiology characterized by upper and lower motor neuron degeneration, leading to a progressive muscle weakness of bulbar, limb, thoracic, and abdominal regions and, eventually, to death.1 Although the motor system is the cardinal target of the neuropathologic insult, brain degeneration extends beyond motor neurons, as suggested by the clinical evidence of variable degrees of cognitive impairment detected in patients with ALS, with typical involvement of frontal executive skills.2 In the 2 largest epidemiologic studies, the occurrence of cognitive impairment has been reported in 36%3 and 51%4 of patients with ALS. The clinical association between frontotemporal dementia (FTD) and ALS, together with the evidence of common neuropathologic findings, supports the impression of a continuum among these entities.5–7
Neuroimaging studies, both structural and functional, sustain the hypothesis of a brain involvement beyond the motor areas and the idea of ALS as a multisystem disorder. Functional imaging showed hypoperfusion in frontal and temporal areas correlated with the impairment of neuropsychologic functions.8–9 MR spectroscopy revealed a relevant N-acetyl-aspartate decrease in the primary motor cortex as well as in the frontal lobe, the primary sensory cortex, the superior parietal gyrus, and the anterior cingulate gyrus.10–13 Main MR imaging signal intensity abnormalities have been found on the pyramidal tract, such as the presence of hyperintensity in subcortical white matter and the dark line in the precentral gyrus, particularly on fluid-attenuated inversion recovery (FLAIR) images.14–15 Nevertheless, MR imaging evidence of nonmotor involvement, particularly in the frontal lobe, derives from brain atrophy evaluation rather than signal intensity abnormalities.16
In recent years, the development of advanced automated imaging analysis, based upon construction of statistical parametric maps, allowed detailed anatomic studies of brain morphometry. Compared with traditional volumetric methods, which used a preselected, manually delineated region of interest, these new tools do not require an a priori assumption of brain district affected by disease and determine structural anomalies directly from the data in an unbiased way. Few studies have been performed in patients with ALS, with and without cognitive changes, that have reported atrophy on a regional basis.17–19 However, the extent of the extramotor involvement in ALS remains unclear, particularly in absence of cognitive impairment.
The aim of this study was to quantify volumetric whole-brain and regional brain changes from MR imaging in nondemented patients with ALS and to assess their neuropsychologic profiles. Two fully automated methods have been used: the Structural Imaging Evaluation of Normalized Atrophy (SIENA) software,20 for whole-brain volume estimation, and the voxel-based morphometry (VBM) method, to highlight the selective volumetric decrease of single cerebral areas.21
Methods
Subjects
Sixteen patients (9 men; mean age ± SD, 58.6 ± 10.2 years) were recruited from the ALS patient population of the Department of Neurologic Sciences of our University. All subjects fulfilled El Escorial criteria for probable or definite ALS,22 had a sporadic form of disease, and had a mean disease duration of 38.1 (range, 8–89) months. No patient had clinically evident dementia according to the DSM-IV criteria23 and the Mini Mental State Examination (MMSE) score,24 corrected for age and schooling for Italian population,25 was higher than 23 (the most widely diffuse cutoff value).26 In addition, no patient had behavioral impairment or change in personality to rule out initial FTD.27 Patients with several bulbar signs were excluded from the analysis because they were unable to perform neuropsychologic tests. Nine age-matched healthy subjects (HS) (6 men; mean age ± SD, 51.8 ± 12.7 years) were also studied. All subjects were right-handed. Written informed consent was given by all subjects, and the study was approved by the local ethics committee.
Clinical and Neuropsychologic Assessment
Each subject underwent clinical, neuropsychologic, and MR examination on the same day. Patients completed the ALS functional rating scale (ALSFRS) questionnaire28 and were examined with manual muscle testing (MMT).29 After a screening global cognitive evaluation performed with MMSE to check the absence of dementia, both patients and controls underwent a battery of neuropsychologic tests exploring the following domains: 1) long-term memory (Spinnler Prose Memory Test [SPMT])30; 2) working memory (Brown-Peterson Interference Test [BPIT]31–32; 3) language (Verbal Fluency Test [FAS])33–34; and 4) sustained and complex attention (Stroop Color/Word Interference [Stroop] Test)35–36 and oral version of Symbol Digit Modalities Test [SDMT].37 We chose motor-free tests to avoid confounding effects of motor impairment. The SPMT provides a measure of recall of prose material in condition of voluntary and planned learning. The 2, 3, and 4 domains are considered elements of frontal executive function. The BPIT, a measure of working memory, records the ability of recall trigrams after various distractor intervals (of 10 or 30 seconds). The verbal fluency test (FAS) requires that the subject generate as many words as possible beginning with the letters F, A, and S, within 60 seconds for each letter. The Stroop test measures the ability to focus attention on an attribute of a complex stimulus (eg, the color in which words are written) ignoring another competing attribute (eg, the semantic meaning of the word); the time to complete the requested task and the number of errors made were recorded. The oral version of the SDMT measures sustained attention, concentration, and processing speed.
Subjects’ results on the tests were expressed as Z-score (ie, as the number of SDs from the mean established by previously published normative values).30,32,37 Results on the tests were considered abnormal when the score was at least 2 SD below the mean. Cognitive impairment for the purpose of the current study was defined as impairment on at least 2 neuropsychologic tests. Depression was evaluated by clinical examination and tested using the Beck Depression Inventory.38
Image Acquisition
MR imaging was performed with a 1.5T General Electric Signa MR system. Conventional sequences, consisting of dual-echo and fluid-attenuated inversion recovery (FLAIR), were acquired in axial and coronal orientation covering the whole brain. Dual-echo was obtained using a fast spin-echo sequence with a repetition time (TR) of 2100 ms, echo time (TE) of 96 ms, 20 5-mm sections, 1.0-mm intersection gap, 345 × 512 matrix; the FLAIR sequence had TR of 8152 ms, TE of 102 ms, 20 5-mm sections, 1.0-mm intersection gap, 256 × 256 matrix).
3D structural MR imaging was acquired using a T1-weighted spoiled gradient-recalled sequence (TR/TE/NEX, 26 ms/7 ms/1; flip angle, 50°; matrix size, 256 × 256); the volume consisted of 128 contiguous sagittal sections (1.00 × 0.97 × 0.97) covering the whole brain.
SIENA Software
MR imaging analysis was performed by 2 coauthors blinded to clinical and neuropsychologic data. On 3D T1-weighted images, normalized volumes of the whole of the brain were obtained by means of the SIENA software, a fully automated and accurate method for measuring longitudinal and cross-sectional changes in brain volume,39 which is freely available as part of the FMRIB Software Library (http://www.fmrib.ox.ac.uk/fsl). In the current study, the cross-sectional version (SIENAX) was used. This software performs segmentation of brain from nonbrain tissue in the head, estimates the outer skull surface, and uses these results to drive the spatial transformation to a standard template to normalize for skull size. Next, a probabilistic brain mask derived in standard space is applied to make sure that certain structures such as eyes/optic nerves have not been included in the brain segmentation. Finally, MR imaging random field model-based segmentation40 is used to segment the brain image into different tissue types, including partial volume models, giving a normalized volume of total brain, gray matter (GM), and white matter (WM) as output. In addition, the brain parenchymal fraction (BPF), which is the ratio of brain parenchymal volume to the intracranial volume, may be calculated.
VBM Analysis
The theory and algorithm of VBM were well-documented by Ashburner and Friston.21 This is a fully automated whole-brain technique for characterizing regional volume and tissue “concentration” differences in structural MRIs.
3D T1-weighted images were analyzed with Statistical Parametric Mapping (SPM2; Wellcome Department of Imaging Neurosciences, London, UK; http://www.fil.ion.ucl.ac.uk/spm)41 running on Matlab (Math Work, Natick, Mass). The preprocessing was performed according to the optimized VBM protocol described by Good et al.42 First step is generation of a customized template and prior probability maps (specific for GM, WM, and CSF), obtained by normalizing the images of all the study subjects in the stereotactic standardized space from the Montreal Neurologic Institute. Then original images were spatially normalized to the same stereotactic space (ie, the customized template) through affine and nonlinear transformations, medium regularization, and no masking. The normalized images were partitioned into GM, WM, and CSF using the customized prior probability maps. An automated brain extraction tool was used to remove voxel of nonbrain tissue. Then the modulation step corrected volume changes introduced during the nonlinear spatial transformations. The use of modulated data permits testing for regional differences in terms of volume rather than concentration of GM in the voxel. To allow an unbiased comparison among regions of interest in different patients, images of GM were finally smoothed by convolving a 12-mm isotropic Gaussian kernel.
The preprocessed data were analyzed using an analysis of covariance model; total intracranial volume, age, and sex were considered nuisance variables. Results were thresholded at P < .0001 (uncorrected for multiple comparisons). Only those clusters exceeding a voxel size of 50 were included in the analysis.
Statistical Analysis
The clinical, neuropsychologic, and MR data were presented as mean ± SD unless stated otherwise. The differences in frequency of categoric variables were analyzed using the Fisher Exact Test. We used the nonparametric Mann-Whitney U test for data comparison between patients with ALS and HS. Because of the exploratory nature of this study (and to minimize the risk of type II errors), no corrections for multiple comparisons were performed when calculating the statistical significance of group differences in neuropsychologic tests. An ANOVA model corrected for age and sex was used to compare whole-brain measures between patients with ALS and HS. To assess the factors that are independently associated with cognitive impairment we ran a multivariate logistic regression model; BPF and presence of ALS were covariates.
Results
Mean (SD) patient ALSFRS and MTT scores were 27.4 (8.6) and 7.8 (1.2), respectively, indicating a moderate disabling disease. No statistically significant differences were found between patients with ALS and HS with respect to age, education, and MMSE scores. MMSE scores were within the normal range in both groups. None of the patients was clinically depressed or in need of antidepressant therapy.
Neuropsychologic Findings
Neuropsychologic test results are shown in Table 1. Only for SDMT were there significantly worse performances in patients with ALS compared with HS (P = .025). In addition, SDMT exhibited the higher frequency of abnormal scores in the patient group (P = .021). Cognitive impairment was evidenced in 8 patients with ALS and in 1 healthy subject.
Table 1:
Neuropsychologic findings in patients with ALS and healthy subjects
| Test | Healthy Subjects (9) | ALS Patients (16) | P |
|---|---|---|---|
| Age (years) | 51.8 (12.7) | 58.6 (10.2) | NS |
| Education (years) | 10.0 (4.6) | 8.7 (3.1) | NS |
| MMSE (cs) | 28.2 (1.6) | 26.6 (2.9) | NS |
| SPMT (z) | −0.5 (0.6) | −0.6 (0.5) | NS |
| BPIT 10 (z) | −0.1 (1.3) | 0.0 (0.9) | NS |
| BPIT 30 (z) | −0.1 (0.9) | −0.1 (1.1) | NS |
| FAS (z) | −0.4 (0.8) | −0.6 (1.3) | NS |
| Stroop | |||
| Word (z) | −0.5 (1.2) | −2.8 (4.1) | NS |
| Color (z) | −1.6 (2.5) | −4.4 (3.8) | NS |
| Interference (z) | −0.7 (1.6) | −1.9 (2.4) | NS |
| SDMT (z) | −1.4 (0.9) | −2.3 (1.1) | .025 |
Note:—Data are presented as mean (SD). P values were determined with the use of the Mann Whitney U test. ALS indicates amyotrophic lateral sclerosis; cs, corrected score; Z, Z-score; NS, not significant; MMSE, Mini Mental State Examination; SPMT, Spinnler Prose Memory Test; BPIT 10, Brown-Peterson Interference Test at 10 seconds; BPIT 30, Brown-Peterson Interference Test at 30 seconds; FAS, Verbal Fluency Test; Stroop, Stroop Color/Word Interference Test; SDMT, Symbol Digit Modalities Test.
MR Imaging Whole-Brain Measures
Normalized whole-brain, GM, and WM volumes did not significantly differ between the 2 groups, whereas BPF was significantly reduced in patients with ALS compared with HS (P = .012), as shown in Table 2. Even after adjusting for age and sex, BPF still significantly differed by study groups (P = .034). The presence of cognitive impairment seemed to be an effect of lower BPF (P = .048) rather than the presence of ALS (P = .689).
Table 2:
Whole-brain volumetric measures in ALS patients and healthy subjects
| Healthy Subjects | ALS Patients | P | |
|---|---|---|---|
| BPF | 0.849 (0.019) | 0.827 (0.019) | 0.012 |
| NBV [ml] | 1433.9 (86.1) | 1392.4 (78.9) | NS |
| NGMV [ml] | 724.6 (43.6) | 711.5 (46.6) | NS |
| NWMV [ml] | 709.3 (48.5) | 680.9 (46.4) | NS |
Note:—P values were determined with the use of the Mann Whitney U test. BPF indicates brain parenchymal fraction; NBV, normalized brain volume; NGMV, normalized gray matter volume; NWMV, normalized white matter volume.
VBM—Regional GM and WM Differences
Significant clusters of locally reduced cortical GM were observed in temporal and frontal lobes of patients with ALS relative to HS (P < .001 uncorrected). Data are summarized in Table 3. Figure 1 shows the main regions with lower GM volume. The right hemisphere appeared more affected than the left for both frontal and temporal lobes. No significant WM differences were found.
Table 3:
Gray-matter volume loss in patients with ALS compared to healthy subjects (P < .001, uncorrected)
| Anatomical Location | Cluster Size k | MNI Coordinates* (mm) |
Z-Score | ||
|---|---|---|---|---|---|
| x | y | z | |||
| Right temporal lobe | |||||
| Subgyral | 439 | 42 | −13 | −23 | 3.80 |
| Superior temporal gyrus-uncus | 75 | 33 | 8 | −27 | 3.24 |
| Middle temporal gyrus | 366 | 58 | 5 | −26 | 3.33 |
| Parahippocampal gyrus | 1047 | 32 | −11 | −9 | 3.53 |
| Middle temporal gyrus | 186 | 61 | −5 | −14 | 3.55 |
| Left temporal lobe | |||||
| Middle temporal gyrus | 200 | −58 | 3 | −21 | 3.33 |
| Subgyral | 1464 | −36 | −4 | −17 | 3.84 |
| Right frontal lobe | |||||
| Inferior frontal gyrus | 292 | 43 | 23 | −14 | 3.31 |
| Inferior frontal gyrus | 197 | 29 | 19 | −9 | 3.34 |
| Extranuclear insula | 704 | 33 | −1 | 22 | 4.01 |
| Superior frontal gyrus | 81 | 39 | 57 | 32 | 3.41 |
| Left frontal lobe | |||||
| Inferior frontal gyrus | 112 | −40 | 23 | −13 | 3.36 |
| Insula | 147 | −31 | 4 | 15 | 3.39 |
The coordinates refer to the Montreal Neurological Institute (MNI) space and denote the areas of maximal gray matter volume loss within each cluster.
Fig 1.
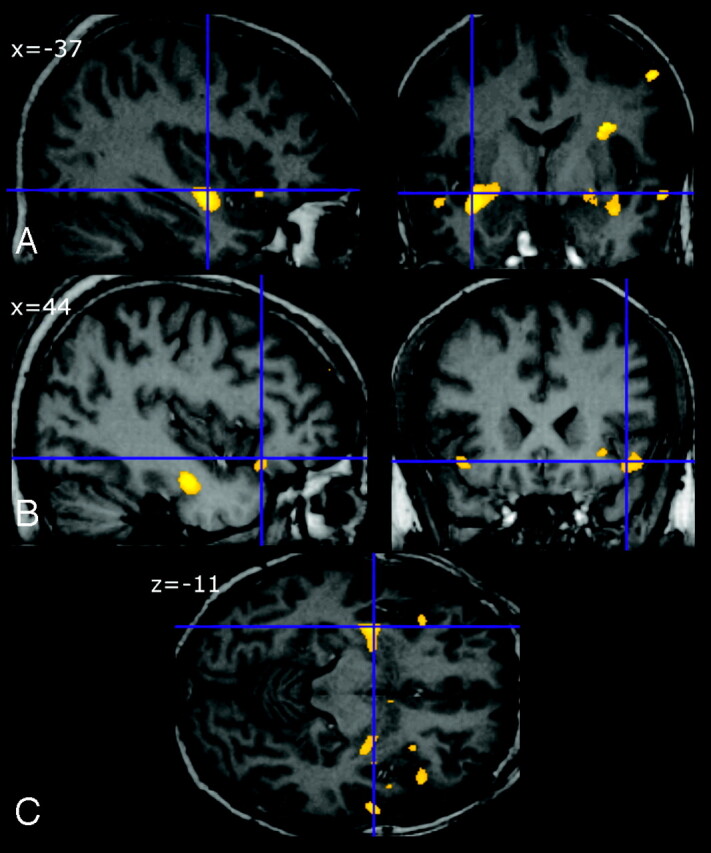
Regional cortical gray matter (GM) reduction in patients with amyotrophic lateral sclerosis (ALS) relative to healthy subjects (HS). Significant voxels are superimposed on selected sections of spatially normalized MR images from a control subject. The main regions with lower GM volume were left middle temporal gyrus and the subgyral region (A), right inferior frontal gyrus (B), and frontal and temporal areas (C).
Discussion
Recent views suggest that ALS is a degenerative brain disease not confined to the motor system,43 but literature data disagree regarding the presence and entity of whole-brain and regional atrophy in this condition. For the first time, the present study evidenced whole-brain volume loss in patients with ALS compared with control subjects. BPF was reduced in patients with ALS even after adjusting for age. However, the lack of significant volumetric changes with other measures, such as normalized brain volume, suggests that atrophy is mild and BPF turns out to be a very sensible index of mild volumetric changes.44 In a previous volumetric analysis, Ellis et al17 showed no difference in whole-brain measures between ALS and control subjects but did not investigate the frequency of cognitively impaired subjects in their group. In our patients, brain atrophy, though it was mild, was related to the presence of cognitive impairment. From a histopathologic view, the presence of cognitive impairment seems to be associated to different quantitative and qualitative features compared with cognitively unimpaired patients with ALS. In particular, Wilson et al6 showed a greater distribution and load of intraneuronal Ub+ inclusions, dystrophic neuritis, and a peculiar superficial linear spongiosis present only in cognitively impaired patients. Moreover histopathologic studies failed to show a reduction in the total number of cortical neurons in patients with ALS compared with control subjects,17,45 fitting well with the finding of mild atrophy.
After whole-brain measures, we performed a morphometric study to detect local volumetric differences between ALS and control subjects. Using voxel-based analysis, 3 recent studies found volumetric changes at the regional level in patients with ALS, with and without cognitive impairment, though no whole-brain atrophy has been reported.17–19 In this VBM study, we mainly demonstrated, in our patients with ALS compared with control subjects, a significant localized GM reduction in temporal and frontal lobes bilaterally, with a slight prevalence in the right hemisphere.
For the most part, the neuropsychologic literature sustains the frontal functional impairment in this disease.2,5,8 The pattern of frontal atrophy of our patients mainly regarded the inferior frontal gyrus (IFG), bilaterally with mild right prevalence. Left IFG (Broca area), which is associated with language production and word retrieval,46 could be the basis for verbal fluency deficits, which are the most commonly reported impairment in ALS.2,8 Language dysfunction in ALS manifests within a spectrum of severity from a subclinical impairment to nonfluent aphasia syndrome. However, dysfunction of this area, especially when bilateral, underlies executive rather than language impairment. IFG of both sides seems to be a part of a broadly distributed action-attentional system that supports the maintenance of attentional focus and successful inhibitory control of unwanted impulses.47,48 The neuropsychologic profile of our patients seems to corroborate this hypothesis, evidencing a frontal executive skills impairment and significant deficit in SDMT, which measures sustained attention, concentration, and processing speed.
The pattern of temporal atrophy in our patients mainly involved the left and right middle temporal gyrus and the right parahippocampal gyrus. Temporal lobe involvement in ALS is in agreement with other volumetric studies18–19 and with histopathologic studies,49 but no evidence of asymmetric damage or right lateralization has been reported. The temporal variant of FTD usually presents with asymmetric medial temporal lobe degeneration,50 and a VBM study reported a right-side prevalence of atrophy.51 Recent theories on aging, such as the right hemi-aging model, propose that the right hemisphere has greater age-related decline than the left hemisphere.52 It is possible that ALS pathology enhances normal aging as in other neurodegenerative diseases. In mild cognitive impairment (MCI), VBM findings evidenced parahippocampal right lateralization of atrophy.53 In any case, the effect of temporal involvement in patients with ALS is a troublesome issue because memory impairment has been described less often than impairment of executive functions3and is often interpreted as a consequence of frontal lobe dysfunction.54
Our failure to show atrophy of the primary motor cortex is not an isolated report; Ellis et al17 did not find it either. Moreover, in other studies, changes in nonmotor areas were most prominent.18–19 This was an unexpected finding and a possible explanation could be a different histopathologic substrate between the motor system55 and diffuse neocortex degeneration,6 with a different impact on regional brain volume. In other words, motor areas appear to be involved in ultrastructural damage without evidence of volume loss, as confirmed by recent histopathologic studies that failed to demonstrate a reduction in either the total number44 or the neuronal volume of cortical neurons of patients with ALS compared with control subjects.56 In any case, the idea of ALS as a multisystem disorder with different phenotypic expression at a neuroimaging level seems to be supported by these data.43
Finally, we have to report 2 limitations of this study. The first regards our sample size, which was too small to allow a correlation between brain atrophy and different patterns or degrees of cognitive impairment. Moreover, the level of significance in VBM may be influenced by the size of the groups being compared. The second regards the lower anatomic precision of VBM with respect to classic region of interest-based volumetric study. Although voxel-based analyses, particularly VBM, are considered robust methods, they are prone to errors caused by a number of accidental factors, including misregistration of anatomic structures.57–58
Conclusion
The present study evidenced mild whole-brain volume loss and frontotemporal atrophy in patients with ALS. These findings could explain cognitive impairment and support the idea of ALS as a brain degenerative disease not confined to the motor system.
References
- 1.Rowland LP, Shneider NA. Amyotrophic lateral sclerosis. N Engl J Med 2001;344:1688–700 [DOI] [PubMed] [Google Scholar]
- 2.Lomen-Hoerth C, Murphy J, Langmore S, et al. Are amyotrophic lateral sclerosis patients cognitively normal? Neurology 2003;60:1094–97 [DOI] [PubMed] [Google Scholar]
- 3.Massman PJ, Sims J, Cooke N, et al. Prevalence and correlates of neuropsychological deficits in amyotrophic lateral sclerosis. J Neurol Neurosurg Psychiatry 1996;61:450–55 [DOI] [PMC free article] [PubMed] [Google Scholar]
- 4.Ringholz GM, Appel SH, Bradshaw M, et al. Prevalence and patterns of cognitive impairment in sporadic ALS. Neurology 2005;65:586–90 [DOI] [PubMed] [Google Scholar]
- 5.Strong MJ, Lomen-Hoerth C, Caselli RJ, et al. Cognitive impairment, frontotemporal dementia, and the motor neuron diseases. Ann Neurol 2003;54:S20–23 [DOI] [PubMed] [Google Scholar]
- 6.Wilson CM, Grace GM, Munoz DG, et al. Cognitive impairment in sporadic ALS: a pathologic continuum underlying a multisystem disorder. Neurology 2001;57:651–57 [DOI] [PubMed] [Google Scholar]
- 7.Yoshida M. Amyotrophic lateral sclerosis with dementia: the clinicopathological spectrum. Neuropathology 2004;24:87–102 [DOI] [PubMed] [Google Scholar]
- 8.Mantovan MC, Baggio L, Dalla Barba G, et al. Memory deficits and retrieval processes in ALS. Eur J Neurol 2003;10:221–27 [DOI] [PubMed] [Google Scholar]
- 9.Abrahams S, Goldstein LH, Kew JJ, et al. Frontal lobe dysfunction in amyotrophic lateral sclerosis. A PET study. Brain 1996;119:2105–20 [DOI] [PubMed] [Google Scholar]
- 10.Bowen BC, Pattany PM, Bradley WG, et al. MR imaging and localized proton spectroscopy of the precentral gyrus in amyotrophic lateral sclerosis. AJNR Am J Neuroradiol 2000;21:647–58 [PMC free article] [PubMed] [Google Scholar]
- 11.Strong MJ, Grace GM, Orange JB, et al. A prospective study of cognitive impairment in ALS. Neurology 1999;53:1665–70 [DOI] [PubMed] [Google Scholar]
- 12.Abe K, Takanashi M, Watanabe Y, et al. Decrease in N-acetylaspartate/creatine ratio in the motor area and the frontal lobe in amyotrophic lateral sclerosis. Neuroradiology 2001;43:537–41 [DOI] [PubMed] [Google Scholar]
- 13.Rule RR, Suhy J, Schuff N, et al. Reduced NAA in motor and non-motor brain regions in amyotrophic lateral sclerosis: a cross-sectional and longitudinal study. Amyotroph Lateral Scler Other Motor Neuron Disord 2004;5:141–49 [DOI] [PMC free article] [PubMed] [Google Scholar]
- 14.Zhang L, Ulug AM, Zimmerman RD, et al. The diagnostic utility of FLAIR imaging in clinically verified amyotrophic lateral sclerosis. J Magn Reson Imaging 2003;17:521–27 [DOI] [PubMed] [Google Scholar]
- 15.Miwa H, Kajimoto Y, Nakanishi I, et al. T2-low signal intensity in the cortex in multiple system atrophy. J Neurol Sci. 2003;211:85–88 [DOI] [PubMed] [Google Scholar]
- 16.Kiernan JA, Hudson AJ. Frontal lobe atrophy in motor neuron diseases. Brain 1994;117:747–57 [DOI] [PubMed] [Google Scholar]
- 17.Ellis CM, Suckling J, Amaro E Jr., et al. Volumetric analysis reveals corticospinal tract degeneration and extramotor involvement in ALS. Neurology 2001;57:1571–78 [DOI] [PubMed] [Google Scholar]
- 18.Chang JL, Lomen-Hoerth C, Murphy J, et al. A voxel-based morphometry study of patterns of brain atrophy in ALS and ALS/FTLD. Neurology 2005;65:75–80 [DOI] [PubMed] [Google Scholar]
- 19.Abrahams S, Goldstein LH, Suckling J, et al. Frontotemporal white matter changes in amyotrophic lateral sclerosis. J Neurol 2005;252:321–31 [DOI] [PubMed] [Google Scholar]
- 20.De Stefano N, Iannucci G, Sormani MP, et al. MR correlates of cerebral atrophy in patients with multiple sclerosis. J Neurol 2002;249:1072–77 [DOI] [PubMed] [Google Scholar]
- 21.Ashburner J, Friston KJ. Voxel-based morphometry—the methods. Neuroimage 2000;11:805–21 [DOI] [PubMed] [Google Scholar]
- 22.Miller RG, Munsat TL, Swash M, et al. Consensus guidelines for the design and implementation of clinical trials in ALS. World Federation of Neurology committee on Research. J Neurol Sci 1999;31:169:2–12 [DOI] [PubMed] [Google Scholar]
- 23.American Psychiatric Association. Diagnostic and Statistic Manual of Mental Disorders, 4th ed. Washington DC: American Psychiatric Association;1994
- 24.Folstein M F, et al. “Mini-mental state.” A practical method for grading the cognitive state of patients for the clinician. J Psychiatr Res 1975;12:189–98 [DOI] [PubMed] [Google Scholar]
- 25.Measso G, Cavarzeran F, Zappalà G, et al. The Mini-Mental State Examination: normative study of an Italian random sample. Dev Neuropsychol 1993;77–85
- 26.Tangalos EG, Smith GE, Ivnik RJ, et al. The Mini-Mental State Examination in general medical practice: clinical utility and acceptance. Mayo Clin Proc 1996;71:829–37 [DOI] [PubMed] [Google Scholar]
- 27.Neary D, Snowden JS, Gustafson L, et al. Frontotemporal lobar degeneration: a consensus on clinical diagnostic criteria. Neurology 1998;51:1546–54 [DOI] [PubMed] [Google Scholar]
- 28.Anonymous. The Amyotrophic Lateral Sclerosis Functional Rating Scale. Assessment of activities of daily living in patients with amyotrophic lateral sclerosis. The ALS CNTF treatment study (ACTS) phase I-II Study Group. Arch Neurol 1996;53:141–47 [PubMed] [Google Scholar]
- 29.Great Lakes ALS Study Group. A comparison of muscle strength testing techniques in amyotrophic lateral sclerosis. Neurology 2003;61:1503–07 [DOI] [PubMed] [Google Scholar]
- 30.Spinnler H, Tognoni G, et al. Standardizzazione e taratura italiana di test neuropsicologici. Ital J Neurol Sci 1987;6 (Suppl 8):47–50 [PubMed] [Google Scholar]
- 31.Peterson LR, Peterson MJ. Short-term repetition of individual verbal items. J Exp Psychol 1959;7:253–61 [DOI] [PubMed] [Google Scholar]
- 32.Modini S, Mappelli D, Vestri A, et al. Esame Neuropsicologico Breve: una Batteria di Test per lo Screening Neuropsicologico. Milano: Raffaello Cortina Ed.;2003
- 33.Benton AL, Hamsher KS. Multilingual Aphasia Examination. Iowa City: University of Iowa Press;1976
- 34.Carlesimo GA, Caltagirone C, Gainotti G. The Mental Deterioration Battery: normative data, diagnostic reliability and qualitative analyses of cognitive impairment. The Group for the Standardization of the Mental Deterioration Battery. Eur Neurol 1996;36:378–84 [DOI] [PubMed] [Google Scholar]
- 35.Stroop JR. Studies of interference in serial verbal reactions. J Exp Psychol 1935;18:643–62 [Google Scholar]
- 36.Venturini R, Lombardo Radice M, Imperiali MG. Il Color-Word Test o Test di Stroop. Firenze: Organizzazioni Speciali;1983. .
- 37.Smith A. Symbol Digit Modalities Test. Los Angeles: Western Psychological Services;1982
- 38.Beck AT, Ward CH, Mendelson M, et al. An inventory for measuring depression. Arch Gen Psychiatry 1961;4:561–71 [DOI] [PubMed] [Google Scholar]
- 39.Smith SM, Zhang Y, Jenkinson M, et al. Accurate, robust and automated longitudinal and cross-sectional brain change analysis. NeuroImage 2002;17:479–89 [DOI] [PubMed] [Google Scholar]
- 40.Zhang Y, Brady M, Smith S. Segmentation of brain MR images through a hidden Markov random field model and the expectation-maximization algorithm. IEEE Trans Med Imaging 2001;20:45–57 [DOI] [PubMed] [Google Scholar]
- 41.Friston KJ, Holmes AP, Worsley KJ, et al. Statistical parametric maps in functional imaging: a general linear approach. Hum Brain Mapp 1995;2:189–210 [Google Scholar]
- 42.Good CD, Johnsrude IS, Ashburner J, et al. A voxel-based morphometric study of ageing in 465 normal adult human brains. Neuroimage 2001;14:21–36 [DOI] [PubMed] [Google Scholar]
- 43.Strong MJ. Progress in clinical neurosciences: the evidence for ALS as a multisystems disorder of limited phenotypic expression. Can J Neurol Sci 2001;28:283–98 [DOI] [PubMed] [Google Scholar]
- 44.Rudick RA, Fisher E, Lee JC, et al. Use of the brain parenchymal fraction to measure whole brain atrophy in relapsing-remitting MS. Multiple Sclerosis Collaborative Research Group. Neurology 1999. 10;53:1698–704 [DOI] [PubMed] [Google Scholar]
- 45.Gredal O, Pakkenberg H, Karlsborg M, et al. Unchanged total number of neurons in motor cortex and neocortex in amyotrophic lateral sclerosis: a stereological study. J Neurosci Methods 2000;95:171–76 [DOI] [PubMed] [Google Scholar]
- 46.Paulesu E, Goldacre B, Scifo P, et al. Functional heterogeneity of left inferior frontal cortex as revealed by fMRI. Neuroreport 1997;8:2011–17 [DOI] [PubMed] [Google Scholar]
- 47.Sowell ER, Thompson PM, Welcome SE, et al. Cortical abnormalities in children and adolescents with attention-deficit hyperactivity disorder. Lancet 2003;22:362:1699–707 [DOI] [PubMed] [Google Scholar]
- 48.Rubia K, Smith AB, Brammer MJ, et al. Right inferior prefrontal cortex mediates response inhibition while mesial prefrontal cortex is responsible for error detection. Neuroimage 2003;20:351–58 [DOI] [PubMed] [Google Scholar]
- 49.Piao YS, Wakabayashi K, Kakita A, et al. Neuropathology with clinical correlations of sporadic amyotrophic lateral sclerosis: 102 autopsy cases examined between 1962 and 2000. Brain Pathol 2003;13:10–22 [DOI] [PMC free article] [PubMed] [Google Scholar]
- 50.Thompson SA, Patterson K, Hodges JR. Left/right asymmetry of atrophy in semantic dementia: behavioral-cognitive implications. Neurology 2003;61:1196–203 [DOI] [PubMed] [Google Scholar]
- 51.Whitwell JL, Josephs KA, Rossor MN, et al. Magnetic resonance imaging signatures of tissue pathology in frontotemporal dementia. Arch Neurol 2005;62:1402–08 [DOI] [PubMed] [Google Scholar]
- 52.Dolcos F, Rice HJ, Cabeza R. Hemispheric asymmetry and aging: right hemisphere decline or asymmetry reduction. Neurosci Biobehav Rev 2002;26:819–25 [DOI] [PubMed] [Google Scholar]
- 53.Pennanen C, Testa C, Laakso MP, et al. A voxel based morphometry study on mild cognitive impairment. J Neurol Neurosurg Psychiatry 2005;76:11–14 [DOI] [PMC free article] [PubMed] [Google Scholar]
- 54.Schreiber H, Gaigalat T, Wiedemuth-Catrinescu U, et al. Cognitive function in bulbar- and spinal-onset amyotrophic lateral sclerosis. A longitudinal study in 52 patients. J Neurol 2005;252:772–81 [DOI] [PubMed] [Google Scholar]
- 55.Kiernan JA, Hudson AJ. Changes in sizes of cortical and lower motor neurons in amyotrophic lateral sclerosis. Brain 1991;114:843–53 [DOI] [PubMed] [Google Scholar]
- 56.Toft MH, Gredal O, Pakkenberg B. The size distribution of neurons in the motor cortex in amyotrophic lateral sclerosis. J Anat 2005;207:399–407 [DOI] [PMC free article] [PubMed] [Google Scholar]
- 57.Bookstein FL. “Voxel-based morphometry” should not be used with imperfectly registered images. Neuroimage 2001;14:1454–62 [DOI] [PubMed] [Google Scholar]
- 58.Davatzikos C. Why voxel-based morphometric analysis should be used with great caution when characterizing group differences. Neuroimage 2004;23:17–20 [DOI] [PubMed] [Google Scholar]