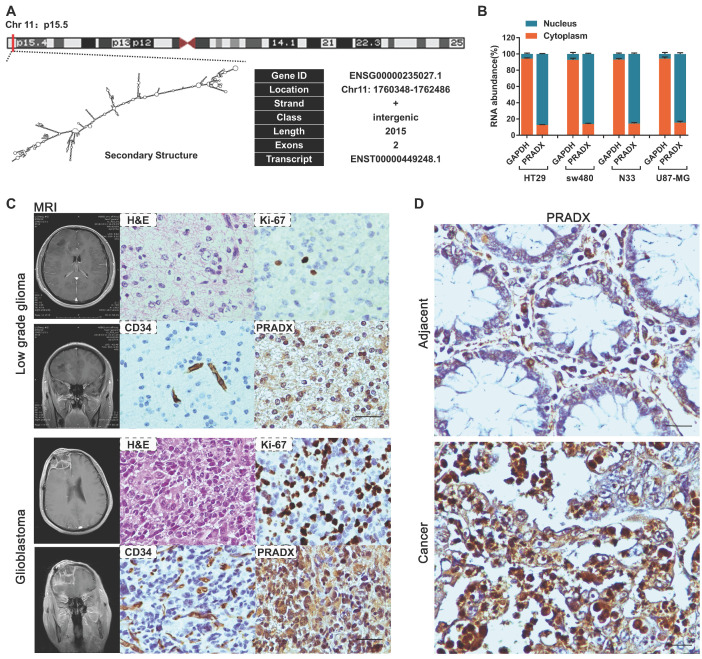
Figure 3.
Identification of PRADX and its cellular localization in cancer tissues. A Genomic location, basic information and secondary structure (obtained from Lnc2Catlas database) of PRADX (ENST00000449248.1). B qRT-PCR analysis indicating the cytoplasmic/nuclear ratio of PRADX and GAPDH. C Representative MRI images of the low grade glioma and glioblastoma patients, and H&E staining, ICH and ISH images of the corresponding tissues. Scale bar, 40 μm. D Representative ISH images indicating PRADX expression in colon adenocarcinoma and adjacent normal tissues. Scale bar, 20 μm.

