Abstract
Fast multiple spin-echo spectroscopic imaging, also called turbo spectroscopic imaging (TSI), may be enhanced in terms of acquisition speed by taking advantage of the higher spectral separation afforded at higher field strength and by further combining it with sensitivity encoding (SENSE). This article demonstrates the possibilities of this approach at 3T, resulting in scan-time reductions of up to a factor of 10. High-resolution, in vivo, single- and multiple-section spectroscopic imaging data are presented.
One of the principal obstacles to the clinical adoption of high resolution or 3D spectroscopic imaging is the long scan time required when using conventional chemical shift imaging pulse sequences. Consequently, various fast MR spectroscopic imaging (MRSI) techniques have been implemented on research scanners, often derived from analogous fast imaging techniques.1 One approach, available as a product on clinical scanners, is based on multiple spin echoes,2 analogous to the rapid acquisition with relaxation enhancement (RARE) (also called turbo spin-echo [TSE] or fast spin-echo [FSE])3 approach in MR imaging. In this technique, also named “Turbo Spectroscopic Imaging” (TSI), several echoes are acquired after each excitation pulse, reducing overall scan time. Because spectral sampling resolution is inversely proportional to echo acquisition time, the spectral resolution required to resolve 2 peaks ultimately limits the minimum echo spacing and thus, because of T2 relaxation, the length of the echo train. At 1.5T, multiple spin-echo MRSI measurements with an echo-train length (ETL) of at most 4 have given good results for clinical use.4-7
In this article, we show that higher ETLs become increasingly feasible at a higher magnetic field strength of 3T, commensurately enabling higher factors in scan time reduction. Single-section, multiple spin-echo MRSI data from the same healthy volunteer, acquired with an ETL of 6 and echo spacing of 144 ms, were compared between 1.5T and 3T, showing that only at the higher field strength is the necessary spectral resolution obtained. Further measurements at high field exploiting the use of longer ETLs are presented, demonstrating the range of beneficial applications: the first shows an illustrative example from a patient with a meningioma. The second example demonstrates the feasibility of fast multisection MRSI with extended anatomic coverage, and the third shows the combination of long spin-echo trains with sensitivity encoded MRSI (SENSE-SI)8 at 3T, enabling acquisition times of less than a minute.
Methods
Informed written consent was given by all volunteers and the single clinical patient before the measurements. Fast MRSI data were acquired both on whole-body 1.5T and 3T Intera MR Scanners (Philips Medical Systems, Best, the Netherlands) using a transmit-receive head coil. Single-section measurements with an ETL of 6 and matrix sizes of 32 × 32 were performed on the same healthy volunteer at both field strengths. The chosen section thickness was 2 cm and the field of view (FOV) was 200 × 200 mm, resulting in a nominal voxel size of 0.78 cm3.
At 3T, each echo was sampled with 256 samples over a bandwidth of 2250 Hz, resulting in an echo acquisition time (Tacq) of 114 ms and a spectral sampling resolution of 8.8 Hz. To compare the 3T measurement to a 1.5T measurement with similar Tacq, at 1.5T, the number of samples was adjusted to 128 and the bandwidth to 1025 Hz, resulting again in a spectral sampling resolution of 8 Hz. In both measurements, repetition time (TR) was 2000 ms and echo time (TE) was 144 ms; echo spacing (ES) was also 144 ms. The excitation pulse and one refocusing pulse were used for section selection, and phase encoding was used for signal localization within the section. Water suppression was achieved by chemical shift-selective (CHESS) pulses, and subcutaneous fat signal intensity was reduced by polygonal outer volume suppression slabs as described by Duyn and Moonen.2 Shimming of the region of interest was only performed linearly in this study. Spectra from equivalently sized and placed voxels were examined for resolution of choline (Cho) and creatine (Cr) resonances. Peaks were considered resolved (analogous to the Rayleigh resolution criteria), if the spectral amplitude between the 2 local peak maxima fell below 80% of the lower of the 2 peak amplitudes.
To show the spatial resolution of multiple spin-echo MRSI at 3T, data from a patient with a meningioma are presented. A single section was acquired in the brain with a high acquisition matrix of 32 × 32, covering the lesion as well as healthy tissue. Acquisition parameters were as described above for the 3T volunteer case.
For the multisection multiple spin-echo MRSI measurement, covering 6 sections of a healthy brain, a section thickness of 11 mm, a FOV of 220 × 220 mm, and a 20 × 20 matrix size per section (isotropic nominal voxel size = 1.33 cm3) were chosen.
Finally, to demonstrate the flexibility of the newly presented method, multiple-echo MRSI was combined with sensitivity encoding at 3T in a healthy volunteer using a SENSE reduction factor of 2 in both phase-encoding dimensions. In this experiment, 6 receiver channels from an 8-element phased-array head coil (MR Imaging Devices Corporation, Waukesha, Wis) were used. A fast sensitivity map for SENSE reconstruction was acquired before the MRSI scan. An initial series of MRSI experiments with different echo trains (1, 2, and 6) was repeated with a SENSE reduction of 4. This allows a comparison of SENSE versus non-SENSE spectral quality. The MRSI grid size was 24 × 24 with a FOV of 240 × 240 mm and a 2-cm section thickness, resulting in a nominal voxel size of 2 cm3. All other parameters were kept equal to the other experiments.
Data postprocessing comprised zero-filling to 512 samples (to 256 samples in the 1.5T measurement), cosine filtering of k-space, a 7-Hz Gaussian and −4-Hz exponential multiplication of the echo signal intensity, Bo-correction, a digital shift algorithm for improved reduction of the water signal intensity,9 and zero order phase correction of the spectra. Metabolite images were created by integrating the modulus spectra over a 0.2-ppm interval at the corresponding peaks and by Fourier interpolation to 256 × 256 pixels.
Results
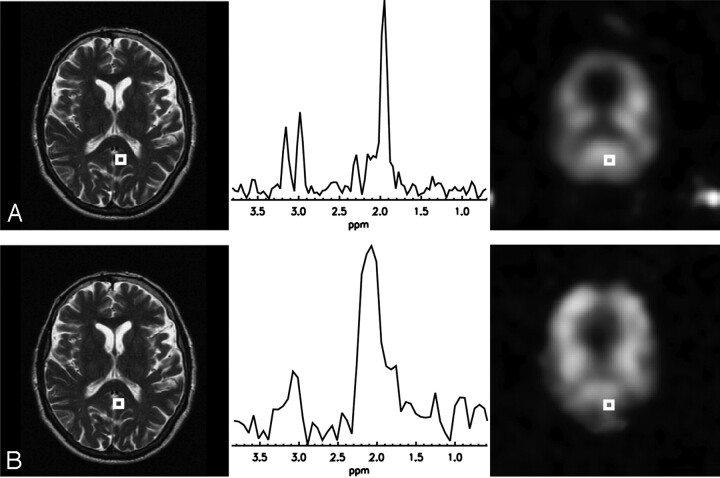
Although TSI data acquired with an echo spacing of 144 ms and 6 spin echoes per excitation do not show enough spectral resolution at 1.5T, using the same parameters at 3T allows good resolution of the Cr and Cho peaks. A comparison of the spectra and metabolite maps acquired at the 2 different field strengths is shown in Fig 1, illustrating the T2-weighted images of the MRSI section, the spectra of the outlined voxels, and the Cr maps from 2 equivalent 32 × 32 MRSI scans with TE = ES = 144 ms in the same healthy volunteer, once at 3T (Fig. 1A) and once at 1.5T (Fig. 1B). To achieve sufficient spectral resolution at 1.5T, an echo spacing of 288 ms would be needed, limiting the ETL to 4.
Fig 1.
Comparison between 3T and 1.5T: multiple spin-echo MRSI data with ETL = 6 and an echo spacing of 144 ms acquired in the same healthy volunteer. Shown are the T2-weighted images, the creatine maps, and the spectra from the outlined voxel.
A, 3T data: The spectral sampling resolution of 8.9 Hz is sufficient to clearly resolve the creatine resonance at 3.0 ppm and the choline resonance at 3.2 ppm.
B, 1.5T data: Although the creatine map still shows some structure, the spectrum shows that an 8-Hz sampling resolution cannot distinguish the 2 resonances anymore.
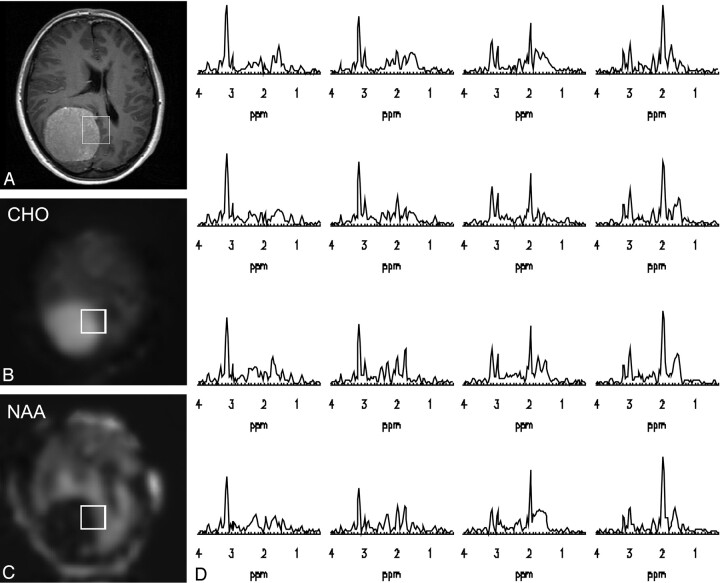
The accuracy of the method is demonstrated in Fig 2, showing data from a patient with a meningioma, acquired with an ETL of 6 and a MRSI matrix of 32 × 32 at 3T. The scan time was only 5:12 (minutes:seconds) instead of 26 minutes required by conventional MRSI with equal acquisition parameters (TR, MRSI matrix size, k-space shutter). Pathologic abnormalities of metabolism in the tumor can be appreciated in contrast to surrounding healthy brain, as represented by the elevated Cho and reduced N-acetylaspartate (NAA) in the metabolite images (Fig 2B and -C) and the spectra (Fig. 2D) originating from 16 voxels from a 2 × 2 cm2 region outlined in the anatomic image and the metabolite maps.
Fig 2.
Example of multiple spin-echo MRSI data (ETL = 6) in a patient with a meningioma, acquired with a 32 × 32 matrix in 5:12 (minutes:seconds). Post-gadolinium T1-weighted image (A), choline map (B), and NAA map showing the region (C) from which the spectra are depicted in D. The spatial resolution allows visualization of the change of metabolism from the tumorous region (high choline, no creatine, no NAA) to healthy metabolism outside the meningioma.
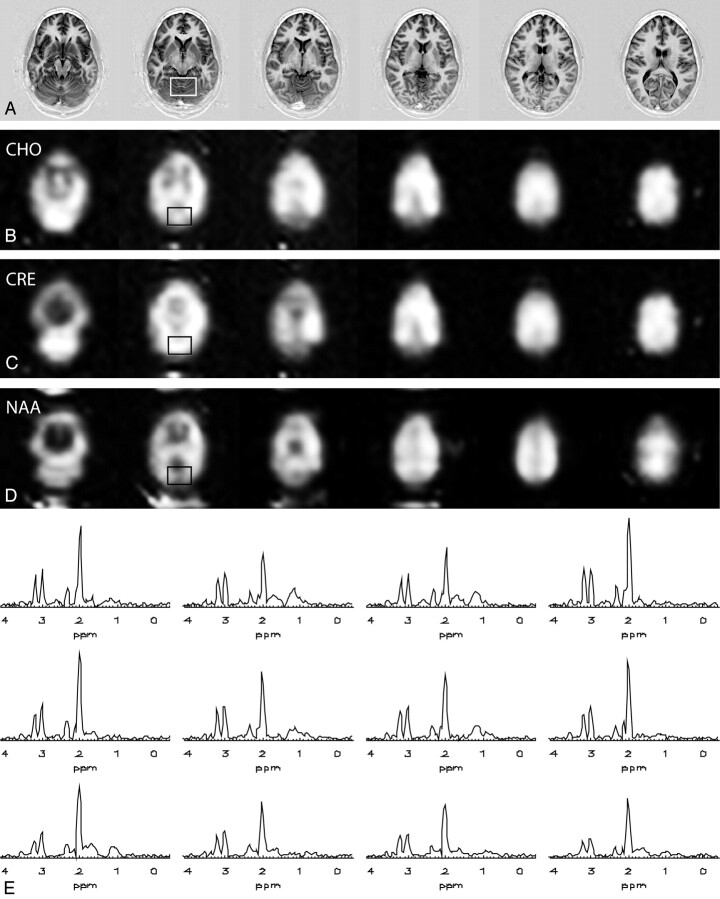
Multisection implementation of TSI at 3T is demonstrated in Fig 3 with ETL = 6, covering 6 anatomic sections with 20 × 20 × 6 MRSI voxels. The total scan time was only 11:23. Cho, Cr, and NAA maps are shown in Fig 3B–D, whereas an example of the spectral quality is shown for a region of 4 × 3 voxels from section 2 in Fig 3E.
Fig 3.
Multisection multiple spin-echo MRSI with ETL = 6 at 3T: Inversion recovery images of the 6 sections covering a large part of the brain, including both cerebellum and cerebrum (A), choline maps (B), creatine maps (C), and NAA maps of the 6 sections (D).
E, Spectra from the outlined voxels (isotropic nominal voxel size = 1.33 cm3) from section 2 of a 20 × 20 × 6 MRSI measurement acquired in 11:23 (minutes:seconds).
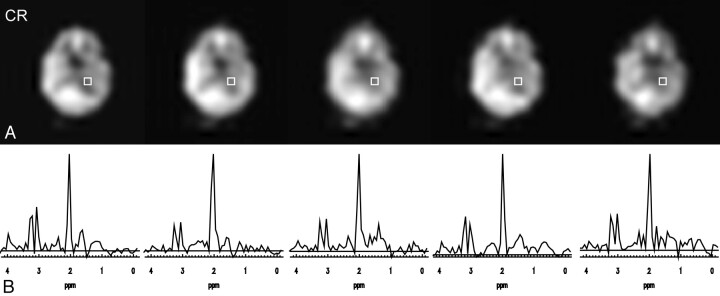
The influence of ETLs and SENSE is shown in Fig 4. Fig 4A depicts the Cr maps of this section, outlining the voxel for which the spectra are depicted in Fig 4B. The Cr maps and spectra were acquired, from left to right, with conventional MRSI (ETL = 1) in 11:04, with multiple spin-echo MRSI with ETL = 2 in 5:37, with ETL = 6 in 2:30, with SENSE and ETL = 2 in 1:37, and finally with SENSE and ETL = 6 in only 0:54. Although signal-to-noise ratio (SNR) is reduced with scan time, the metabolite ratios and a clear separation of the peaks is maintained even in the subminute scan. SNR, measured once over 105 voxels and once for the outlined voxel, was averaged for NAA, Cr, and Cho and is listed in Table 1, normalized to the SNR of conventional MRSI with a circular k-space shutter. In addition, a theoretical SNR loss is given, calculated as the square root of the scan time. Note that such a calculation is not complete, because no T2, T2*, or k-space weightings are taken into account. Furthermore, the ratios of Cho/NAA and Cr/NAA are given in Table 1 for the depicted voxel, showing the variability over the different acquisition parameters.
Fig 4.
Combination of SENSE and multiple spin-echo MRSI with ETL = 6 at 3T: creatine maps (A) and spectra (B) from the outlined voxel of a 24 × 24 MRSI measurement. From left to right, the MRSI scans were acquired with ETL = 1 in 11:04 (minutes:seconds), with ETL = 2 in 5:37, with ETL = 6 in 2:30, with SENSE and ETL = 2 in 1:37, and finally with SENSE and ETL = 6 in only 0:54.
Table 1:
SNR and metabolite ratios
| SNRROI (%) | SNRvoxel (%) | SNRtheory (%) | Scan Time (%) (24 × 24 Scan) | Cho/NAA | Cr/NAA | |
|---|---|---|---|---|---|---|
| ETL = 1 | 100 | 100 | 100 | 100 | 0.39 | 0.35 |
| ETL = 2 | 84 | 90 | 71 | 51 | 0.38 | 0.31 |
| ETL = 6 | 54 | 62 | 48 | 23 | 0.30 | 0.27 |
| SENSE, ETL = 2 | 50 | 51 | 38 | 15 | 0.37 | 0.33 |
| SENSE, ETL = 6 | 32 | 32 | 29 | 8 | 0.42 | 0.33 |
NOTE:—SNR indicates signal intensity-to-noise ratio; ETL, echo-train length; SENSE, sensitivity encoding; Cho, choline; Cr, creatine; NAA, N-acetylaspartate. SNR, averaged over SNRNAA, SNRCr, SNRCho, was averaged once over a region of interest (ROI) containing 105 voxels and once only for the voxel depicted in FIg 4. SNRtheory gives only the theoretical SNR reduction with the square root of total scan time. The metabolite ratios are given for the voxel depicted in Fig 4 and show the variability over the different acquisition techniques.
Discussion
The presented data show that scan time in commonly used multiple spin-echo spectroscopic imaging may be reduced significantly at 3T compared with 1.5T by taking advantage of the increased spectral separation at 3T. To ensure unambiguous peak identification, a clear spectral separation of Cr and Cho is essential for clinical MR spectroscopy. The chemical shift difference between the Cho resonance and the Cr resonance is 0.158 ppm,10 which equals 10 Hz at 1.5T; resolving these peaks demands a minimum sampling resolution of 5 Hz and therefore an Tacq of at least 200 ms. Taking into account the time necessary for pulses and for switching phase-encoding gradients, as well as the J-coupling evolution of the lactate doublet (best observed at echo times that are multiples of 144 ms10), an ES of 288 ms and a Tacq of 250 ms is commonly chosen for TSI experiments at 1.5T, yielding a sampling resolution of 4Hz. At 3T, the same chemical shift difference of 0.158 ppm is equal to 20 Hz. Thus an Tacq of approximately 110–120 ms, resulting in a spectral sampling resolution of only 8–9 Hz and an ES of only 144 ms, is sufficient for a proper discrimination of the Cr and Cho resonances. Thus, maintaining the same spectral resolution on a parts-per-million scale allows for shorter sampling times of the spin echoes and thus for shorter interecho spacing and longer echo trains at 3T. This leads, in principle, to a scan time reduction by a factor of 2 compared with an equivalent MRSI scan at 1.5T with equal resolution on the parts-per-million scale.
Another important property dependent on the magnetic field strength is the T2 decay time. Whereas at 1.5T, T2 for NAA, Cr, and Cho is reported to be 336, 219, and 352 ms, respectively, for white matter,11 these values are reduced to 295, 156, and 187 ms, respectively, at 3T.12 Using these values, the T2 weighting of each spin-echo can be calculated. Table 2 lists the weighting factors for Cr for each echo signal intensity with respect to the full free induction decay (FID) signal intensity immediately after the excitation pulse for up to 6 spin echoes. TE and ES are set to 288 ms at 1.5T and to 144 ms at 3T.
Table 2:
T2 weighting of the spin echoes at 1.5T and 3T
| T2 Weighting for Creatine | FID | Echo 1 | Echo 2 | Echo 3 | Echo 4 | Echo 5 | Echo 6 | Sum |
|---|---|---|---|---|---|---|---|---|
| 1.5T (TE = 288 ms) | 100 | 26.8 | 7.2 | 1.9 | 0.5 | 0.14 | 0.04 | 36.4 |
| 3T (TE = 144 ms) | 100 | 39.7 | 15.8 | 6.3 | 2.5 | 1.0 | 0.4 | 65.7 |
Note:—FID indicates free induction decay; TE, echo time. Values are expressed as percentages. T2 weighting factors calculated for creatine for different spin echoes relative to the FID signal strength using an echo time and echo spacing of 288 ms at 1.5T and an echo time and echo spacing of 144 ms at 3T. The T2 value of creatine in white matter was assumed to be 219 ms at 1.5T11 and 156 ms at 3T.12 The total fraction of the FID signal intensity, collected over 4 echoes at 1.5T and over 6 echoes at 3T, is stated in the last column.
Experience has shown that multiple spin-echo MRSI measurements at 1.5T with an ETL ≤ 4 have given good results for clinical use.4-7 Table 2 indicates that equivalent loss of signal intensity in the final echo is obtained with an ETL of 6 at 3T as with an ETL of 4 at 1.5T, suggesting that an ETL of 6 seems equivalently feasible at 3T. An additional SNR advantage is predicted by Table 2, by comparing the relative signal intensities of corresponding echoes in the echo trains at 3T versus 1.5T. However, k-space sampling with such T2-weighting (or modulation) leads to a degradation of the point spread function (PSF), resulting in a lower effective spatial resolution compared with the nominal stated resolution.
MRSI can easily be expanded to a multisection or 3D implementation. With conventional techniques, the measurement of more than 4 MRSI sections with high spatial resolution becomes prohibitively time consuming and prone to motion artifacts. An additional 50% scan time reduction, as achieved in the present work, allows for at least 6 sections. However, additional challenges, such as achieving high homogeneity throughout the whole brain and improved fat suppression, need to be addressed to achieve large anatomic coverage in clinical MRSI examinations. Furthermore, localization techniques without chemical shift displacements at high field strength are necessary.
Although SNR typically limits the combination of SENSE with multiple spin-echo MRSI to an ETL of 2 at 1.5T,13 the additional SNR at higher field allows for combinations with higher ETL. Thus scan time reduction of more than a factor of 10 can be achieved compared with conventional MRSI. The high speed factor can be essential for increasing the anatomic coverage in an MRSI examination.
An obvious limitation of the presented fast MRSI technique is the restriction to measurements with an echo spacing of at least ∼130 ms. This implies that metabolites that can only be observed at short TE (eg, myoinositol or glutamate and glutamine) can hardly be measured with multiple spin-echo techniques. However, the limitations of 1.5T multiple spin-echo MRSI techniques with an echo spacing of 288 ms are even more stringent compared with 3T.
Although chemical shift increases linearly with magnetic field strength, the separation of multiplet peaks as a result of J-coupling remains constant. For example, the 2 doublet peaks of lactate and of alanine are separated by 6.9 and 7.3 Hz, respectively, independent of field strength. With a spectral sampling resolution of 4 Hz, these doublet structures are usually still resolved; however, with only 8-Hz resolution, this becomes impossible. Therefore the argument to use the higher field strength for allowing shorter echo spacing while maintaining the parts-per-million resolution only holds for separating peaks with different chemical shift, not for resolving multiplet structures. In addition, attention needs to be paid to the coupling evolution of lactate when using an echo spacing of 144 ms; in this case, the lactate signal will be inverted in every other echo, requiring specialized reconstruction for correct lactate assessment.4
Conclusion
In conclusion, this study demonstrates that MRSI scan times can be reduced in turbo spectroscopic imaging at high fields, by virtue of shorter echo acquisition times and longer ETLs. Combining with SENSE allows acceleration factors exceeding 10. This offers the possibility of considerably increased MRSI matrix sizes or anatomic coverage, still within a reasonable scan time, or alternatively can be harnessed to achieve good spatial resolution (eg, 24 × 24) in less than 1 minute.
Acknowledgments
We thank Prof. Timothy Roberts, Children’s Hospital of Philadelphia, University of Pennsylvania School of Medicine, for valuable discussions and comments on this topic. Furthermore, we are grateful for the continuing support of Philips Medical Systems and the financial support by the SEP program of the ETH Zurich.
Footnotes
This work was supported by Philips Medical Systems and the SEP program of the ETH Zurich (grant TH 7/02-02).
This work was presented in part at the ASNR 2004, ISMRM 2004, and ESMRMB 2003 meetings.
References
- 1.Pohmann R, Von Kienlon M, Haase A. Theoretical evaluation and comparison of fast chemical shift imaging methods. J Magn Reson 1997;129:145–60 [DOI] [PubMed] [Google Scholar]
- 2.Duyn JH, Moonen CT. Fast proton spectroscopic imaging of human brain using multiple spin-echoes. Magn Reson Med 1993;30:409–14 [DOI] [PubMed] [Google Scholar]
- 3.Hennig J, Nauerth A, Friedburg H. RARE imaging: a fast imaging method for clinical MR. Magn Reson Med 1986;6:823–33 [DOI] [PubMed] [Google Scholar]
- 4.Duyn JH, Frank JA, Moonen CT. Incorporation of lactate measurement in multi-spin-echo proton spectroscopic imaging. Magn Reson Med 1995;33:101–07 [DOI] [PubMed] [Google Scholar]
- 5.Flacke S, Traber F, Block W, et al. Improved diagnosis of contrast-enhancing brain lesions with multifunctional MRI assessment: a case report. J Magn Reson Imaging 1999;9:741–44 [DOI] [PubMed] [Google Scholar]
- 6.Martin AJ, Liu H, Hall WA, et al. Preliminary assessment of turbo spectroscopic imaging for targeting in brain biopsy. AJNR Am J Neuroradiol 2001;22:959–68 [PMC free article] [PubMed] [Google Scholar]
- 7.Block W, Jessen F, Traber F, et al. Regional N-acetylaspartate reduction in the hippocampus detected with fast proton magnetic resonance spectroscopic imaging in patients with Alzheimer disease. Arch Neurol 2002;59:828–34 [DOI] [PubMed] [Google Scholar]
- 8.Dydak U, Weiger M, Pruessmann KP, et al. Sensitivity-encoded spectroscopic imaging. Magn Reson Med 2001;46:713–22 [DOI] [PubMed] [Google Scholar]
- 9.Roth K, Kimber BJ, Feeney J. Data shift accumulation and alternate decay accumulation techniques for overcoming dynamic range problems. J Magn Reson 1980;41:302–09 [Google Scholar]
- 10.Govindaraju V, Young K, Maudsley AA. Proton NMR chemical shifts and coupling constants for brain metabolites. NMR Biomed 2000;3:129–53 [DOI] [PubMed] [Google Scholar]
- 11.Rutgers DR, van der Grond J. Relaxation times of choline, creatine and N-acetyl aspartate in human cerebral white matter at 1.5 T. NMR Biomed 2002;3:215–21 [DOI] [PubMed] [Google Scholar]
- 12.Mlynarik V, Gruber S, Moser E. Proton T(1) and T(2) relaxation times of human brain metabolites at 3 Tesla. NMR Biomed 2001;5:325–31 [DOI] [PubMed] [Google Scholar]
- 13.Dydak U, Pruessmann KP, Weiger M, et al. Parallel spectroscopic imaging with spin-echo trains. Magn Reson Med 2003;50:196–200 [DOI] [PubMed] [Google Scholar]


