

Supplemental Digital Content is Available in the Text.
Functional ultrasound imaging characterizes key components of the mesoscopic spinal hemodynamic response induced by natural or electrically stimulated afferent fibers, and its amplification in inflammatory condition.
Keywords: Pain, fUS, Neurovascular, Plasticity, NMDA
Abstract
Despite a century of research on the physiology/pathophysiology of the spinal cord in chronic pain condition, the properties of the spinal cord were rarely studied at the large-scale level from a neurovascular point of view. This is mostly due to the limited spatial and/or temporal resolution of the available techniques. Functional ultrasound imaging (fUS) is an emerging neuroimaging approach that allows, through the measurement of cerebral blood volume, the study of brain functional connectivity or functional activations with excellent spatial (100 μm) and temporal (1 msec) resolutions and a high sensitivity. The aim of this study was to increase our understanding of the spinal cord physiology through the study of the properties of spinal hemodynamic response to the natural or electrical stimulation of afferent fibers. Using a combination of fUS and ultrasound localization microscopy, the first step of this study was the fine description of the vascular structures in the rat spinal cord. Then, using either natural or electrical stimulations of different categories of afferent fibers (Aβ, Aδ, and C fibers), we could define the characteristics of the typical hemodynamic response of the rat spinal cord experimentally. We showed that the responses are fiber-specific, located ipsilaterally in the dorsal horn, and that they follow the somatotopy of afferent fiber entries in the dorsal horn and that the C-fiber response is an N-methyl-D-aspartate receptor-dependent mechanism. Finally, fUS imaging of the mesoscopic hemodynamic response induced by natural tactile stimulations revealed a potentiated response in inflammatory condition, suggesting an enhanced response to allodynic stimulations.
1. Introduction
The spinal dorsal horn is the first site of integration of multiple sensory modalities and their modulation. Most of our knowledge on the physiology and physiopathology of the spinal cord comes from electrophysiological and histological studies. Extracellular recordings produced invaluable information regarding the neuronal electrophysiological properties in health and disease, through peripheral stimulations of the neurons' receptive field. They evidenced the increased neuronal firing, as well as the involvement of N-methyl-D-aspartate (NMDA) receptor-dependent mechanisms underlying central sensitization associated with persistent pain,38 shedding light on the mechanisms of action of ketamine in the clinical manifestations of central sensitization.15,19 Neuroanatomical studies, however, helped understand the role of intracellular signaling pathways in central sensitization and the nature and role of subtypes of excitatory and inhibitory neurons in the various laminae of the dorsal horn.80
All these techniques have their strengths and weaknesses. Ultimately, a technique that would have excellent temporal and spatial resolutions, and high sensitivity, enabling measurements at the cellular level and in a large field of view, would be perfect. Electrophysiological and optical imaging27 studies only allow recordings in a very narrow space. Neuroimaging techniques, such as functional MRI, by contrast, image with a large field of view, but due to the small size of the spinal cord in rodents, it requires high magnetic fields and long exposure times to visualize the spinal cord, with sometimes a poor spatiotemporal resolution. For all these reasons, and due to the breathing-related motion artefacts,12 there are significantly fewer neuroimaging studies performed in humans'7,9,13,53,67,68,70–72 and rodents' spinal cord39,43,46–48,56,90,91 than in the brain.
Functional ultrasound (fUS) imaging is a relatively new versatile neuroimaging approach that allows imaging and measurement of cerebral blood volume in human neonates,16 in adult intraoperative settings,32 nonhuman primates,20 anesthetized18,45 and freely moving rodents3,63,83 with excellent spatial and temporal resolutions. Due to the existence of a neurovascular coupling, an increased local neuronal activity induces a hemodynamic response.31 Functional ultrasound imaging is sensitive enough to measure the cortical hemodynamic changes induced by olfactory,55 visual,25 and auditory5 stimuli in anesthetized animals. The use of such a technique in the spinal cord, in the context of a better understanding of the physiology of the spinal cord in sensory integration, would be very valuable. Recent studies have shown as first proofs of concept that fUS imaging is an emerging modality of neuroimaging in the rodent spinal cord, in particular in the context of spinal cord lesions and its restoration.35,65,66
Our study aimed at (1) a detailed imaging of the vascular structures of the rat spinal cord by combining both fUS imaging and ultrasound localization microscopy (ULM), which increases even further the spatial resolution (10 μm),23 (2) evaluating the sensitivity of this fUS technique to image the spinal neurovascular response to natural (noxious or innocuous) peripheral stimuli, (3) determining the typical hemodynamic response function (HRF), and (4) imaging their alterations due to the central sensitization induced by short-term inflammatory pain.
2. Material and method
2.1. Animals
All experiments were performed in agreement with the European Community Council Directive of 22 September 2010 (010/63/UE) and the local ethics committee (Comité d'éthique en matière d'expérimentation animale number 59, “Paris Centre et Sud,” project 2018-05). Accordingly, the number of animals in our study was kept to the necessary minimum. Experiments were performed on N = 51 male Sprague-Dawley rats (Janvier Labs; Le Genest St Isle, France), weighing 325 to 350 g at the beginning of the experiments. Animals (2 per cage) arrived in the laboratory 1 week before the beginning of the experiment and were kept at a constant temperature of 22°C, with a 12-hour alternating light/dark cycle. Food and water were available ad libitum.
2.1.1. In toto coloration of spinal cord vascular architecture
After an imaging session, N = 3 Sprague-Dawley rats were deeply anesthetized with an intraperitoneal (IP) injection of sodium pentobarbital (150 mg·kg−1). Then, a thoracotomy was performed and an incision in the right atrium was made. Animals were perfused with 2 mL of saline solution (NaCl 0.9%), followed immediately by 15 mL of DiI (0.012 mg·mL−1 in 2% ethanol, 98% PBS [phosphate buffered saline] solution, 0.02 mol·L−1), as previously described42 and then 10 mL of paraformaldehyde 4% at the rate of 7 mL·min−1. Spinal cords were extracted and fixed for 2 days in 4% paraformaldehyde at 4°C before cryoprotection in a 30% sucrose solution for 2 days. Spinal cords were frozen in an OCT matrix (optimal cutting temperature compound) in cooled isopentane (−40°C) on dry ice, cut in 50 µm slices using “free-floating” method in PBS, and positioned on Superfrost slides. Mosaic images were immediately acquired using Axio Imager M1 (Zeiss, Jena, Germany).
2.1.2. Laminectomy and spinal functional ultrasound imaging
Under deep anesthesia (intraperitoneal [IP] bolus of medetomidine [Domitor, 0.4 mg·kg−1] and ketamine [Imalgène, 40 mg·kg−1]), a laminectomy was performed between the 12th thoracic vertebra and the second lumbar vertebra. This window allowed the positioning of the whole ultrasonic probe (14 mm) in a sagittal plane.
Once the laminectomy performed, the animal was placed on a “spinal cord” stereotaxic frame, where the lumbar rachis was suspended. Lidocaine (Xylovet, Ceva, France, 2 mg/mL) was topically applied on the muscles that were exposed, as well as the insertion points of the spinal holders. The anesthesia was maintained but reduced, using subcutaneous perfusion at the rate of medetomidine (0.1 mg/kg/h) and ketamine (12.5 mg/kg/h) using a syringe pump. To obtain reproducible results, it was necessary to wait approximately 1h30 after induction before imaging to obtain a stable and light level of anesthesia (respiratory frequency around 120 bpm). During the surgical procedure and the imaging session, the animal's body temperature was kept at 37°C using a heating blanket and an intrarectal probe (Physitemp, Clifton, NJ), and the heart and respiratory frequencies were monitored (MouseOxPlus, Ugo Basile, Italy). Each imaging session lasted from 4 to 6 hours.
Two milliliters of saline was gently dropped on the spinal cord (the dura mater was kept intact), and the cavity made by the laminectomy was then filled with echographic gel. The ultrasonic probe (f = 15 MHz, 128 elements, Vermon, Tours, France) was then positioned just above the window using a 3-axis motor system on which the ultrasound probe was fixed. The probe connected to an ultrasonic ultrafast scanner (Verasonics, Kirkland, WA: 128 channels, 62.5 MHz sampling rate) was driven with Neuroscan live acquisition software (Iconeus, Paris, France; and Inserm Accelerator of Technological Research in Biomedical Ultrasound, Paris, France).
2.1.3. Peripheral stimulations
2.1.3.1. Mechanical stimulations
Twenty-four hours before the imaging session, the threshold of nociceptive mechanical sensitivity was determined using calibrated forceps (Bioseb, France), as previously described,76–78 by applying an increasing pressure on the foot pad of the hind paw in awake and habituated animals. This nociceptive threshold (withdrawal threshold >4.5 N) was further used in imaging sessions to apply the necessary force to elicit a nociceptive mechanical stimulation.
2.1.3.2. Electrical stimulations
A low-frequency generator (A310 Accupulser, World Precision Instruments, Hitchin, United Kingdom) was used with a current generator (Digitimer, DS3; Letchworth Garden City, United Kingdom) to generate a waveform (2 msec width, 40 Hz stimulation for 5 seconds) for subcutaneous hind paw stimulation using acupuncture needles. To stimulate different groups of fibers, we chose different intensities: supramaximal stimulation of C fibers required stimulation at 3 mA for C fibers, 1.5 mA for of Aδ fibers, and 0.5 mA for Aβ fibers. These parameters were chosen according to previous literature.10,40,64 During the sets of experiments, the stimulation patterns were randomized. Also, to avoid any spinal hyperexcitability induced by repetitive stimulation of C fibers,51 only a maximal number of 8 acquisitions at 3 mA were performed on each animal.
For the determination of the spinal HRF, a high-intensity and short-duration60 (5 mA, 2 seconds) waveform at 40 Hz was used. The waveform was triggered by the ultrafast imager. We chose the shortest duration inducing a strong and reproducible response.
2.2. Functional ultrasound imaging: sequences of imaging and signal processing
2.2.1. Sequences of imaging
Functional ultrasound imaging was performed using a linear ultrasound probe (128 elements, 15 MHz, 110 µm pitch, 8 mm elevation focus, Vermon) driven by an ultrafast ultrasound scanner (Verasonics, 128 channels, 62.5 MHz sampling rate), which was driven with Neuroscan live acquisition software (Iconeus, Paris, France; and Inserm Accelerator of Technological Research in Biomedical Ultrasound, Paris, France). The fUS imaging sequence operated as follows: the spinal cord was insonified by 10 successive tilted plane waves with angles varying from −10° to 10° with a 5.5-kHz pulse repetition frequency. The backscattered echoes were recorded by the transducer array and beamformed to produce a block of 200 consecutive ultrafast images with a framerate of 500 Hz. Each block acquisition was followed by a pause up to 600 ms for data treatment. To filter the spinal blood volume (SBV) and remove the tissue signal, we used a clutter filter based on singular value decomposition (SVD) algorithm applied to 200 successive frames17 by removing the 60 first singular vectors that correspond mainly to the tissue space. Finally, a Power Doppler image was obtained by integrating the energy of the filtered frames, resulting in a Power Doppler image every 400 ms or 1 second depending on the pause.
Note that no additional motion correction was necessary because the lumbar spinal cord was tightened and suspended using spinal holders and the aforementioned SVD clutter filter can remove residual tissue motion.
2.2.2. Two planes were chosen for imaging
A sagittal plane and a transverse one were chosen. For the placement of the sagittal plane, we made several scans in the transverse direction and we chose the middle of the spinal cord by recognizing specific structures. Once at the midline, the probe was moved 500 µm towards the ipsilateral side of the simulation. Therefore, the functional studies in the sagittal plane were performed at 500 µm laterality in the ipsilateral side. For the top-down positioning, the image was centered on the lumbar enlargement.
For the transverse positioning, a preliminary positive stimulation test was made on the sagittal plane before rotating the probe with the 3 axis motors on the area highlighted by preliminary acquisition.
Experiments of functional activation in the transverse plane were difficult to perform because it is easy to miss the responsive area in the cord (slice thickness is about 400 µm). Also, within this plane, the position of the vertebra and the ribs induce artifactual reverberations, causing a high level of background noise compared to the sagittal plane. This is probably due to a difference in wave scattering in the intervertebral space that is different between the sagittal plane and the transverse plane. These are the reasons why we did not perform many experiments in transverse plane.
2.3. Doppler signal analysis
2.3.1. Experimental determination of the spinal hemodynamic response function
Because of the short duration of noxious electrical stimulations used and the lack of previous descriptions of hemodynamic response in the rat's spinal cord, we first sought to determine the rat spinal HRF in our experimental conditions. This was necessary to correlate the variations of Doppler signal with the stimulation pattern accurately, and to produce activation maps. A strong (supramaximal 5 mA) stimulation of C fibers was applied for the shortest duration that produced a reproducible response (2 seconds). To stimulate accurately and reproducibly, the stimulations were triggered by the ultrasound scanner using an Arduino board. Five acquisitions per rat in 2 rats were used to determine the HRF as measured by fUS imaging in the spinal cord of the rat experimentally. All acquisitions were averaged, and the analytical equations of the HRF were determined by fitting an inverse gamma distribution, as previously described by other authors44 using Matlab (lsqcurvefit, Optimization Toolbox).
2.3.2. Doppler signal analysis and activation maps
Doppler data were analyzed using a generalized linear model approach implemented in Matlab. In the design matrix, the stimulation pattern was convoluted with our fUS-determined HRF for shortest electrical stimulation and we obtained Z-score and P-value map. The activation maps show the Z-score of all the pixels in the image with P-value < 0.05 (before Bonferroni correction).
We chose our region of interest (ROI) by calculating a 7-by-7 pixel-square centered on the maximum of the thresholded Z-score map, and the signal was averaged along the 2 spatial dimensions to obtain a single temporal signal. The spatially averaged signal was then expressed as an SBV increase (in percent) by subtracting the SBV baseline (calculated for each acquisition by averaging all the temporal data within the spinal cord where the stimulation pattern was strictly equal to 0) and by dividing by the SBV baseline. Spinal blood volume increases were calculated by isolating each peak and by averaging the temporal signal between t1 and t2, where t1 and t2 were determined using the width at half maximum for the considered peak. The baselines between each stimulation peak couples were estimated separately.
2.3.3. Statistical analysis of the evoked spinal hemodynamic responses
The statistical analysis was performed using a linear mixed model (LMM). Such approach is particularly interesting in the case of nonindependent, hierarchical data, which is the case of the results produced (ΔSBV or Z-scores from individual or series of stimulations, in series of acquisitions, in several animals). In addition, both fixed and random effect factors can be introduced. In our set of experiments, the fixed effect factor was the condition (eg, location of hemodynamic response [dorsal horn, ventral horn]) or the intensity of fiber stimulation, whereas the animals and acquisitions are random effect factors.
Data were first transformed by taking their square root to homogenize the variance across groups, as assessed with Bartlett test. The LMM was fitted with the restricted maximum likelihood method using Matlab's function fitlme. Residual normality was tested with Shapiro–Wilk test. In the case of more than 2 conditions, post hoc tests of significance of the fixed factor effect between couples of conditions were performed with a likelihood ratio test using Matlab's function coefTest, using Bonferroni correction for multiple testing.
Results of the LMM are shown in detail in Supplementary table 1, whereas results of the post hoc tests are presented in the Supplementary table 2 (available at http://links.lww.com/PAIN/B176).
(1) Condition: evaluation of the significance of the changes of SBV due to the condition, such as comparison in the dorsal horn vs ventral horn, inflamed vs naive, etc.
(2) Animal: evaluation of the significance of the changes due to differences in animals.
(3) Acquisition: evaluation of the significance of the changes due to differences in acquisitions, ie, 4 trains of stimulations, each one given rise to a value of evoked SBV (indicated as “Total number of stimulations” in the table).
(4) Homoscedasticity: homogeneity of variance is assumed by the LMM. P values >0.05 suggest that the variance was indeed homogenous after the square root transformation of the data.
(5) Residual normality: error normality is assumed by the LMM. Therefore, analysis of the residual normality is a good indicator of how well this hypothesis is fulfilled (it is the case with a few exceptions).
2.3.4. Analysis of the somatotopy
Spinal somatotopic activations were performed by electrically stimulating different dermatomes corresponding to lumbar levels L3, L4, and L5 using a standard stimulation protocol as described above (40 Hz, 5 seconds, 3 mA). Activation maps were computed as previously described. Once filtered, the centroid was calculated as the Z-score weighted barycenter. We only kept the horizontal (anteroposterior) coordinates. We measured the L5-L4 and L5-L3 distances; L5 was used as the horizontal axis origin for this somatotopic study. The averaged position of L4 and L3 was calculated by averaging all the corresponding distances. Results were presented as level contour lines, those of the first, second, and third quartiles of the Z-score.
2.4. Ultrasound localization microscopy
For ULM, a catheter filled with saline was inserted in the rat jugular vein before the positioning of the animal and the laminectomy. Ultrasound localization microscopy was performed similarly to the methods described in.14,23,29 Briefly, 150 μL of SonoVue microbubbles (reconstituted in 5 mL of saline) were injected through the catheter in the jugular vein, followed by 100 µL of saline. Two hundred blocks of 600 successive compounded frames (with angles at −5°, 0°, +5°, at 3000 Hz pulse repetition frequency with a 10-mm imaging depth) were acquired every second using the same probe (f = 15 MHz, 128 elements, Vermon). The elevation focusing was achieved by a plastic lens to reach 500 μm at 8-mm elevation focal depth. The acquisitions were performed using the same setup and software as above.
Small rigid motions were corrected through phase-correlation.30 Singular value decomposition filters17 were used to extract bubble signals from surrounding tissues by removing only the 2 first singular values and by applying a second-order Butterworth high-pass filter with a cutoff frequency of 20 Hz to remove remaining tissue signal. Microbubbles were localized using a weighted average method.28 Microbubbles were detected as the brightest local maxima on the image. Then, the position of the microbubbles within the pixel was determined using a weighted average on the intensity in the neighboring pixels. Microbubble tracks were formed by pairing microbubbles between frames using Matlab's (“simpletracker”) tracking algorithm, which is based on the Hungarian method for assignment.36 Distances to all the microbubbles in the following frame were calculated. The Kuhn–Munkres algorithm then minimizes the total distance, thus connecting all the positions of a microbubble to form a collection of its position in the different frames. Velocities were calculated as the mean displacement between 2 consecutive frames. The microbubble track was completed using linear interpolation to fill missing points. The track was then smoothed using a sliding average along 5 positions, and the positions were rounded to the chosen pixel sizes.
3. Results
3.1. Vascular anatomy of the spinal cord
In a preliminary study, we tested the possibility to image the rat spinal cord through both the vertebral muscles and the vertebra. As expected, due to the reflection and attenuation of the wave propagation through the bone, the presence of the vertebra prevented the imaging of spinal blood vessels completely. As a consequence, as previously shown by others in the context of shear wave elastography and functional ultrasound,65,84 only small portions of spinal cord were visible through the intervertebral space. To study spinal cord physiology using fUS, we chose to use a large laminectomy at the level of the lumbar enlargement.
Imaging the baseline power Doppler signal (without external stimulation) at the rate of 1 Hz was sufficient to study the anatomical vascularization of the rat lumbar spinal cord.
Imaging first in a transverse view, we observed a strong signal in the posterior spinal vein (PSV), a vein that runs dorsally between both right and left dorsal horns; the anterospinal artery (ASA) that, on the contrary, runs ventrally between both ventral horns with fast blood flow speeds (>15 mm/s); and the dorsal extension of the ASA from the ventral to the dorsal horn (Figs. 1A and B). Surprisingly, no signal could be detected in some parts of the dorsal horn (laminae I-II for instance, Fig. 1B) and in the white matter of the ventral horn (Figs. 1B and D), apart from initial bifurcations of the ASA.
Figure 1.

Vascular anatomy of the rat spinal cord. (A) Diagram showing the major veins and arteries in the spinal cord and their position with respect to the sagittal and transverse imaging planes. (B–D) Imaging of the rat spinal blood volume in transverse view, using fUS imaging (B) or using ultrasound localization microscopy imaging (D), showing a strong spinal blood volume in the posterior spinal vein (PSV), a vein that runs dorsally between both right and left dorsal horns; the anterospinal artery (ASA) that, on the contrary, runs ventrally between both ventral horn; and the dorsal extension of the ASA from ventral to the dorsal horn. Although classic fUS imaging does not reveal any Doppler signal in the white matter and the most part of the dorsal horn (laminae I and II), ULM imaging (D) and in toto staining of the vascularization (C) reveals a thin vascular network of capillaries in these areas. (E–F) Functional ultrasound (E) and ULM imaging (F) of the spinal cord in sagittal view, at the level of the midline, showing highly contrasted “Y” structures, that originate from the ASA, whose vertical part is the CSA, while splitting in 2 branches at the level of the central canal, either dorsally in the dorsal horn (positive flux, red arterioles, E), or ventrally in the ventral horn (negative flux, blue arterioles, F). (D and F) Ultrasound localization microscopy imaging and analysis of the directionality of the flow. Ultrasound localization microscopy imaging was achieved with the intravenous injection of biocompatible microbubbles. The super-resolution image was reconstructed from microbubble tracking and false colorized. The colour indicates the directionality of the bubbles (blue: going ventrally, red: going dorsally) and the colour intensity indicates the velocity of the bubbles in these directions. (H) Quantitative measurements of both the diameter of some spinal blood vessels and the velocity of bubbles in these blood vessels. (C and G) In toto staining using vascular injection of DiI reveals a dense network of blood vessels in the spinal dorsal horn, and a sparser network in the ventral horn. The central canal (cc) that delineates the dorsal from ventral horns is clearly visible as a lack of staining. The arrow in G points at one of the “Y” structures, which is clearly a vascular structure of large diameter. ASA, anterior spinal artery; CSA, central sulcal artery; DH, dorsal horn; PSV, posterior spinal vein; VH, ventral horn; wm VH, white matter of the ventral horn; ULM, ultrasound localization microscopy.
To identify these vascular structures, an in toto vascular staining of the vasculature using intracardiac perfusion of the fluorescent dye DiI was performed in 3 animals, as previously described.42 The staining produced (Fig. 1C) confirmed the presence of staining in the PSV and ASA and allowed the visualization of the vasculature in the parenchyma of the dorsal and ventral horns. Measurement in fixed tissues leads to a diameter value of 200 μm for the ASA, 20 μm for the CSA (central sulcal artery) and PSA (posterior spinal artery), and 5 μm for the vasculature in the parenchyma, as in the brain. The small size of the latter is the obvious reason why the vasculature of the parenchyma cannot be imaged in fUS imaging.
To circumvent this problem, we performed ultrafast ULM using intravenous injection of biocompatible microbubbles. This approach relies on the separation and localization of echoes of intravascular microbubbles to reconstruct super-resolved images. It is similar to the localization of blinking fluorescent sources in photoactivated localization microscopy, which improves the optical resolution by more than 10-fold.4 We previously showed that this approach allows the imaging of small vessels (approx. 10 μm) in the rat cortex.23 This in vivo microscopy localization confirmed that the spinal cord is a highly vascularized organ with a dense network of capillaries in both dorsal and ventral horns (Figs. 1D and F). The size of the blood vessels imaged using this approach is consistent with the measurements performed in fixed tissues (Fig. 1G, ie, a diameter inferior to 5 μm in capillaries). Blood flow speeds quantified using microbubble tracking in ULM showed fast flows at 15 to 20 mm/s and higher in the ASA, moderate flows at 5 to 8 mm/s in CSA and PSA arteries, and even lower ones in small-diameter vessels of the dorsal horn (1-5 mm·s−1 for 10-50 μm arteriole diameter). As expected, the measured blood velocities are much lower in the vein (PSV) and the parenchyma (10 mm·s−1 and 1-5 mm·s−1, respectively), as compared to ASA.
Imaging in the sagittal view using both fUS imaging and ULM confirmed over several lumbar levels the previous observation of strong signals in arterial elements but weaker in the dorsal horn. We also observed new sets of “y” structures formed by the CSA in its anteroposterior projections (Fig. 1F). These structures were observed at the level of the midline (lateral = 0 mm). This was confirmed using longitudinal spinal sections stained in toto using DiI (red arrow, Fig. 1G). An analysis of the microbubble's direction pointed out an ascending flow from the ASA to the dorsal horn, and a descending flow to the ventral horn (Figs. 1D and F). Finally, the comparison of the DiI staining in the transverse and sagittal views allowed us to observe that the density of blood vessels is much denser in the gray matter than in the white matter (Figs. 1C and G).
3.2. Functional activations in the rat spinal cord in health and disease
The second aim of our study was to determine the physiological properties of the spinal hemodynamic response induced by noxious and innocuous peripheral stimulations. Indeed, as shown in the past by several authors, such stimulations induce the activation of spinal neurons in different laminae of the dorsal horn, with specific somatotopic distributions. In addition, through mechanisms of neurovascular coupling,24,31 this neuronal activation should theoretically lead to a local hemodynamic response.
3.2.1. Mechanical stimulation of the hind paw
To address this question, we first characterized the hemodynamic response in the dorsal horn of the spinal cord induced by natural nociceptive mechanical stimulations. Manual application of nociceptive mechanical stimulations with a calibrated mechanical clamp induced a strong statistically significant local hemodynamic response in the dorsal horn (Figs. 2A–C). Quantification across all animals and acquisitions showed that this effect is restricted to the dorsal horn (weakly statistically significant in the ventral horn, red square, Fig. 2C) and to the lumbar level (not statistically significant more rostrally or caudally, see the green square located 4 mm caudally or rostrally from the activated area on Figs. 2A–C).
Figure 2.
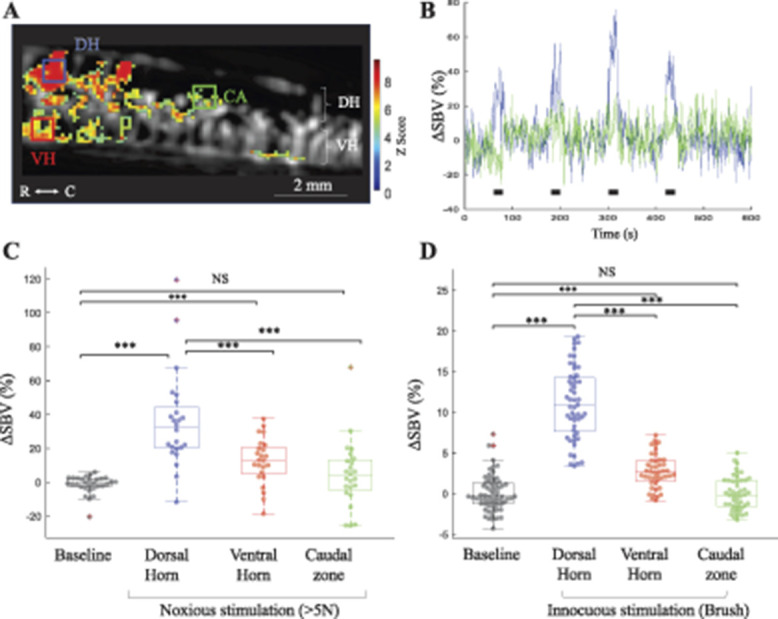
Functional ultrasound imaging reveals that natural mechanical noxious or innocuous stimulations induce a localized hemodynamic response in the spinal dorsal horn in anesthetized rats. (A–C) Hemodynamic response induced by noxious mechanical stimulation, applied using calibrated forceps (<4.5 N). A shows a typical example of the significant spinal hemodynamic response induced by noxious mechanical stimulation, imaged in the sagittal plane using fUS imaging. Are superimposed in (A): the vascularization of the cord imaged in fUS (black and white background) and the z-score of the pixels in the image (red/green pixels) and finally 3 regions of interest: the dorsal horn (DH, blue), ventral horn (VH, red), and the caudal dorsal horn (CA, green). (B) Averaged temporal signals (over all stimulations: N = 52, from 5 animals) over time for the ROIs in the dorsal, showing a strong and robust increased spinal blood volume (SBV) in the lumbar dorsal horn (blue line), but not caudal horn during the stimulation (green line). Black squares indicate the stimulations. The red ROI is not shown for better clarity. The y-axis unit is the relative increase in spinal blood volume compared to baseline (portion of the signal without stimulation). (C and D) Box plots and overimposed individual values of changes in spinal blood volume (SBV) in all individual activations induced by either noxious (C) or innocuous (D) peripheral mechanical stimulations. In both cases, a statistically significant hemodynamic response is observed locally in the dorsal horn (not significant in the ventral horn [red], nor 4 mm more caudally [green]). Note that the amplitude of response evoked by noxious stimulations is much greater than for innocuous stimulations. Colored dots represent individual ΔSBV obtained for all individual stimulations. (C) Baseline: N = 65 from 5 rats—dorsal horn: N = 52 from 5 rats—ventral horn: N = 44 from 5 rats—caudal area: N = 48 from 5 rats. (D) Baseline: N = 30 from 4 rats—dorsal horn: N = 24 from 4 rats—ventral horn: N = 24 from 4 rats—caudal area: N = 24 from 4 rats. Statistical analysis: The statistical analysis was performed using a LMM. In this set of experiments, the fixed effect factor is the condition (eg, location of hemodynamic response [dorsal horn, ventral horn] or the intensity of fiber stimulation), whereas the animal and acquisition are random effect factors. Inclusive results of this analysis are shown in details in Supplementary table 1, and results of the post hoc tests are presented in the Supplementary table 2 (available at http://links.lww.com/PAIN/B176). They show a lack of effect of the random factors but statistical effect of various conditions. ***P < 0.001. NS, nonstatistically significant.
Natural stimulation of Aβ fibers using dynamic stimulation of the foot pad with a brush induced also a statistically significant increase of the local SBV in the dorsal horn (Fig. 2D), but this effect was of a lesser amplitude. This effect was also restricted to the dorsal horn (not statistically significant in the ventral horn, see the red square on Fig. 2D) and to the lumbar level (not statistically significant more caudally, see the green square on Fig. 2D).
3.2.2. Electrical stimulation of the hind paw
To study the HRF and the fiber selectivity of the spinal cord stimulation, we chose to apply noxious or innocuous stimulations using electrical stimulations of either Aβ, Aδ, or C fibers. In this particular case, although the stimulations applied are obviously less natural, they have the great advantage of being triggered, and provide high temporal accuracy in the evoked response.
Because to date the HRF function of the rat spinal cord was never established, we determined it experimentally to further use it for the deconvolution of the stimulus patterns and therefore obtain a more accurate calculation of the hemodynamic response induced by electrical stimulations.
3.2.3. Determination of the hemodynamic response function
To accurately compute the hemodynamic responses to short stimuli induced by electrical stimulations, we determined the hemodynamic impulse response in the rat spinal cord experimentally, to use it as a transfer function.
To do so, we applied the shortest supramaximal peripheral stimulation of C fibers that elicited a reproducible response (2 seconds at 5 mA). Five acquisitions per rat on 2 rats were made to determine the HRF for ultrafast ultrasound imaging in the spinal cord of the rat. All acquisitions were averaged (Figs. 3B and C), and an inverse gamma distribution was individually fitted to each acquisition. Finally, we averaged the parameters obtained across all the experiments to have the analytical HRF parameters (Fig. 3C). We found the following HRF expression (Equation 1):
| (1) |
with A = 6.1 ± 1.8, α = 2.5 ± 1.3, and β = 12.7 ± 7.0. The onset time (threshold corresponding to an SBV increase reaching twice the amplitude of the SD of the baseline) was of 1.4 ± 0.2 seconds after the stimulation, at 14% ± 4% of SBV increase, with a maximal hemodynamic response at 3.0 ± 0.9 seconds after the onset. It is interesting to note that this transfer function is very close to the transfer function between neuronal and vascular responses recently described by Aydin et al2 in the olfactory bulb. Also, despite the difference of location in the central nervous system, the physiological properties of this HRF (onset time and time to peak) were very similar with previous observations in the brain of anesthetized rats: (2.0 seconds ± 0.3/5 ± 0.7,22) and awake nonhuman primates (1.4 seconds ± 0.6/2.520). These results are also consistent with measurements described in the literature using functional magnetic resonance imaging (fMRI).26,64,82 Some authors reported very different time response (10 seconds) in the human spinal cord. The fact that this was for a motor task (and not sensory) might explain the difference. However, as we measured blood volume and not deoxyhemoglobin, neither initial dip nor poststimulus undershoot was present.
Figure 3.
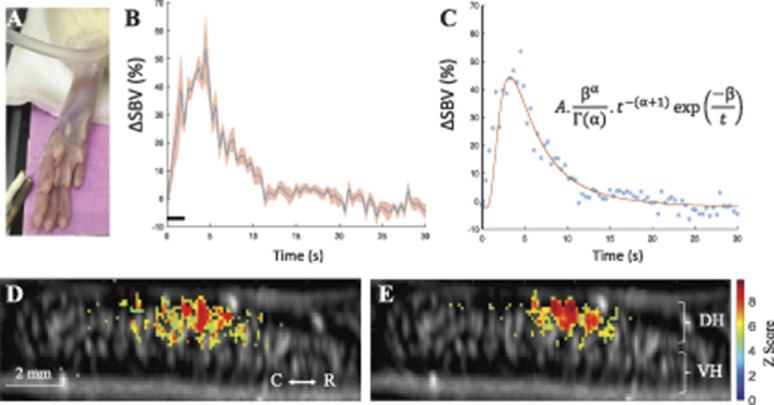
Determination of the spinal hemodynamic response function using functional ultrafast ultrasound imaging. (A) Image illustrating the implantation of the stimulation acupuncture electrodes in the rat hind paws. (B) Average changes (blue line) ± standard error deviation of the mean of the spinal blood volume evoked by peripheral noxious electrical stimulations in all animals and stimulations (2 rats, 5 acquisitions per rat, N = 20 individual stimulations). Black line illustrates the stimulation (2 seconds, 40 Hz, 5 mA). (C) Analytical determination of the fUS HRF using inverse gamma distribution. These acquisitions were fitted individually, and the final values are the mean of each fit. The figure shows the individual values (blue dots) and the fitted function (red line). The equation and parameters are indicated in the panel (A = 6.1 ± 1.8, α = 2.5 ± 1.3, β = 12.7 ± 7.0). (D–E) Example of activation maps in one representative animal, showing the Z-score of all the pixels in the image with a P-value < (0.05/image size in pixel, Bonferroni correction). (E) Without the use of the HRF in the correlation model, whereas (D) is with the use of our hemodynamic response function convoluted with the stimulation pattern. Orientation: caudal (C)—rostral (R) is indicated. fUS, functional ultrasound; HRF, hemodynamic response function.
3.2.4. Functional activation in the spinal cord using electrical stimulation
To evaluate the ability of the different afferent modalities to induce an evoked hemodynamic response, we stimulated electrically different groups of peripheral afferents, using previously described parameters.10,40,64 Note that when the intensity of stimulation is increasing, fibers of lower threshold are also stimulated. Therefore, Aβ fibers are also stimulated when Aδ and/or C fibers are stimulated.
Electrical stimulations of Aβ fibers (0.5 mΑ,10) did not evoke any hemodynamic response (−0.4 ± 6.0% SBV) compared to baseline (0.5 ± 0.7% SBV, P > 0.05). Electrical stimulation of Aδ (1.5 mΑ,10,64) and C fibers (3 mA,10,40) fibers, however, induced a statistically significant hemodynamic activation (Figs. 4A–C, 35.4 ± 5.1% SBV, P < 0.001/73.4 ± 7.5% SBV, P < 0.001, respectively). The amplitude of the response induced by C fibers was greater than the one induced by Aδ fibers, suggesting that C fibers have a major role in this effect.
Figure 4.

The spinal hemodynamic response induced by peripheral electrical stimulation is fiber-specific and localized ipsilaterally. (A) Typical example of functional activation induced in the dorsal horn in a naive rat by the electrical stimulation of C fibers (imaged in sagittal view). The functional activation was calculated using a global linear model, using the analytical HRF obtained previously. The color bar indicates the Z-score. (B) Averaged temporal dynamic of Doppler signal in relative augmentation of the spinal blood volume induced by electrical stimulation of C fibers in all stimulations (3 mA, N = 84, from 9 rats). Black dots represent electrical stimulations (5 seconds). The blue line represents the average experimental Doppler signal over all stimulations (N = 84), whereas the orange line represents the theoretical response to the stimulation pattern describing the spinal cord HRF. (C) Statistical analysis of hemodynamic responses induced by either 0.5 mA (Aβ fibers), 1.5 mA (Aδ fibers), or 3 mA (C fibers) stimulation showing that only Aδ- and C-fiber stimulations induced a significant hemodynamic response. The C-fiber response was specifically blocked by NMDA-receptor antagonist, ketamine, suggesting that glutamatergic neurotransmission through the NMDA receptors is a necessary mechanism in this neurovascular response. (D–E) Functional ultrasound imaging of the hemodynamic response induced by C-fiber stimulations viewed in a transverse plane. (D) Example of a functional activation map in one rat showing that the area activated is in the ipsilateral dorsal horn. The scale applies to both panels of (D). (E) Statistical analysis of these functional activations over all individual stimulations (N = 48, from 5 animals), showing that the response is statistically significant only in the ipsilateral dorsal horn, suggesting a very localized and specific neurovascular response to the C-fiber stimulations. Results were expressed as in (C). In (C and E), colored dots represent individual ΔSBV obtained for all individual stimulations (C: Baseline: N = 105 from 9 rats—3 mA: N = 84 from 9 rats—1.5 mA: N = 48 from 5 rats—0.5 mA: N = 36 from 9 rats—3 mA + ketamine: N = 16 from 4 rats). (E) Baseline: N = 60 from 5 rats—ipsilateral and contralateral: N = 48 from 5 rats). *P < 0.05, ***P < 0.001. Orientation: caudal (C)—rostral (R), dorsal horn (DH), and ventral horn (VH) are indicated. HRF, hemodynamic response function; NS, nonstatistically significant.
Finally, spinal topic application of ketamine (an NMDA receptor antagonist) completely blocked the hemodynamic response induced by C-fiber stimulation (−0.4 ± 1.5% SBV, P > 0.05 compared to baseline). These results suggest that (1) the evoked spinal neurovascular response is fiber-specific and (2) that glutamate (through the involvement of the NMDA receptor) plays a major role in the hemodynamic activation induced by C fibers. As further discussed in the discussion section, this hemodynamic response is likely to be the dual consequence of specific neuronal activation and neurovascular coupling.
3.2.5 Spatial localization of the spinal hemodynamic response
All neurovascular responses observed in the dorsal horn imaged in the sagittal plane were of heterogenous oval shape (Fig. 4A), typically (after C-fiber stimulation) 2 mm long.
The reason for this shape and size could be (1) the spinal areas where responsive neurons are located and (2) the spread of increased local blood supply, 2 hypotheses that are not mutually exclusive.
At each spinal level, activated primary sensory afferents enter the dorsal horn of the spinal cord ipsilaterally, terminating in different laminae of the dorsal horn, locally activating various subpopulation of dorsal horn neurons. Therefore, imaging the hemodynamic response induced by C fibers in the transverse plane could provide crucial clue on the specificity of the hemodynamic response measured in fUS towards neuronal activation. As shown in Figure 4D, despite the thin network of blood vessels and weak Doppler signal in laminae I-III (Fig. 1), a strong increased blood volume was observed in laminae I-V (Figs. 4D and E) of the dorsal horn ipsilateral to noxious stimulation (44.0 ± 3.1% SBV vs 0.2 ± 0.7% SBV for baseline, P < 0.001). This effect was not observed in the contralateral dorsal horn (1.4 ± 1.8% SBV, P > 0.05 compared to baseline), suggesting a specific hemodynamic response where activated neurons are known to be located. Therefore, this restricted area of activation of approximately 1 mm suggests that fUS imaging faithfully measures the local increased blood volume induced by neuronal activation.
3.2.6 Spinal hemodynamic response respects the somatotopy of afferent entries in the dorsal horn
Compelling evidence brought forward from different but complementary techniques ranging from electrophysiological recordings52,88 to tracing experiments73,88 and Evans blue extravasations74,75 have shown that entries of afferent fibers are somatotopically organized in the spinal cord, activating nociceptive specific or nonspecific neurons in the corresponding spinal cord levels. However, due to the difficulty to image in the spinal cord, no neuroimaging technique so far was able to verify such mechanisms in vivo. Combining the large field of view achievable in fUS imaging of the spinal cord, the high spatial resolution, and sensitivity of the technique, using electrically stimulated C fibers in different dermatomes consecutively (L3, L4, or L5) in the same animal, we analyzed the spatial shift of the activated areas. As shown in Figure 5A (example in one animal), the areas of activation shift along the neuroaxis caudally as the stimulated dermatomes shift from L3, L4, to L5. This phenomenon was quantified over several animals by calculating the weighted centroid of the activated area (white stars in Fig. 5B), using the location of L5 in each animal as the spatial reference. Note that surroundings of the activated areas are shown as correlation level curves in Figures 5B and C, using the following color code: red (L3), blue (L4), and green (L5). This analysis confirmed that the area functionally activated by C-fiber stimulation shifted caudally of approximately 1.2 ± 0.4 mm between L5 and L4 and 2.5 ± 0.3 mm between L5 and L3.
Figure 5.

The spinal hemodynamic response respects the somatotopy of afferent entries in the dorsal horn. (A) Typical example in one animal of spatial shift the spinal area functionally activated (z-score map) by C-fiber stimulation in the dermatomes L3, L4, and L5. The scale bar (2 mm) applies to all panels in (A). (B–E) Quantification of the spatial areas functionally activated over several animals (and their spatial shift) by calculation of the weighted centroid of these areas, in the sagittal plane (B–D) and in the transverse plane (E). (B and E) The white stars are the weighted centroid of the correlations averaged over all the acquisitions (N = 6 individual acquisitions in B–D; N = 6 in E). (B–D) Color code of the different dermatomes: red: L3, blue: L4, and green: L5. The blue, red, and green curves represent contour lines corresponding to the first, second, and third quartiles of the correlations, respectively. (C–D) The centroid of L5 (star) was used as an invariant point to allow relative calculation for L4 (diamonds) and L3 (circle) positions on different animals. Only the horizontal position was taken into account; the vertical position was ignored. (N = 4 rats; 4 for L5, 3 for L4, and 3 for L3). (D) The yellow star represents the centroid of the calculated relative positions for the dermatome L4 (diamonds, blue) and L3 (circle, red). The scale bar in (D) applies for (C and D). (E) Same as (B) in a transverse plane at lumbar level L4 (obtained from one animal and 6 activation maps). The bottom panel in E allows the localization of the laminae where the response is observed. Orientation: caudal (C)—rostral (R), dorsal horn (DH), ventral horn (VH), medial (M), and lateral (L).
In a transverse plane of imaging, this analysis showed that the functionally activated areas were restricted to the whole laminae I, II, III, and the medial aspect of laminae IV and V, with a weighted centroid located in the medial part of lamina III (Fig. 5E). These are the spinal locations of nociceptive specific and nonspecific neurons.
3.2.7. Imaging of Aβ fibers induced mechanical allodynia
Allodynia is an abnormal pain perception induced by the application of an innocuous stimulation. It is probably the most frequent and debilitating clinical symptom observed in chronic pain diseases (both in clinical condition and in animal models33). Because pathways mediating pain and touch are segregated in physiological conditions, there is a large consensus that allodynia might be due to the functional reorganization of spinal circuits.37,38
During the installation of peripheral inflammation, due to the tonic activation of sensitized primary afferent fibers, the spinal mechanism of central sensitization takes place, in which spinal neurons are in a state of facilitation, potentiation, augmentation, or amplification.38 In this inflammatory condition, wide-dynamic-range neurons have an increased spontaneous firing rate, and the application of a low-threshold mechanical stimulation induces both a pain sensation (allodynia) and an increased firing rate of these neurons, but not of nociceptive-specific neurons.50
In this study, we reevaluated the neurobiological mechanisms underlying allodynia in inflammatory pain, imaging the neurovascular response to mechanical tactile allodynia in a model of central sensitization induced by short-term inflammatory pain (24 hours after unilateral subcutaneous injection of Complete Freund's Adjuvant [25 uL, Sigma Aldrich, France] in the hind paw). Using the large field of view and the temporal resolution of fUS imaging, we imaged the hemodynamic response evoked by stimulation of low-threshold mechanoreceptors (induced by brush stimulation on the hind paw) and observed an increased spinal hemodynamic response in inflamed animals compared to the controls (Fig. 6). This increased responsiveness was characterized by an increased evoked local SBV in the dorsal horn (Fig. 6D).
Figure 6.

After short-term peripheral inflammation, a peripheral mechanical stimulation (brush, ie, allodynic stimulation) induces an enhanced spinal hemodynamic response. (A) Drawing illustrating the experimental design. At T = 0, animals received a unilateral intraplantar injection of either saline (control group) or inflamed group (Complete Freund's Adjuvant, CFA). The functional spinal response to a brush stimulation was studied 24 hours later. (B) Typical example of a functional activation in the dorsal horn during mechanical stimulation of the hind paw in one inflamed animal, using a brush. Quantification and presentation of the functional activation was determined as described above. (C) Changes in averaged Doppler signal over time (induced by brush stimulation) in control (blue, 7 rats, N = 76 individual hemodynamic responses) and CFA inflamed rats (red, 7 rats, N = 96 individual hemodynamic responses) in the ipsilateral dorsal horn. The black squares indicate the stimulations of the injected hind paw. The traces were averaged values over all responses in each group. (D) The statistical analysis of these functional activations reveals an enhanced responsiveness in the dorsal horn of inflamed animals (D). Colored dots represent individual ΔSBV values obtained for all individual stimulations (N = 76 in control animals; N = 96 in CFA animals). Statistical analysis (mixed linear model) shows a statistically significant effect of the treatment (Saline/CFA), but also of the animal, suggesting that this effect was not observed in all animals (see Supplementary Table 1, available at http://links.lww.com/PAIN/B176). ***P < 0.001. Orientation: caudal (C)—rostral (R), dorsal horn (DH), and ventral horn (VH) are indicated. SBV, spinal blood volume.
4. Discussion
Functional ultrasound imaging is a relatively new modality of neuroimaging that allows, through ultrafast imaging of blood flow, the study of functional activations5,25,55 and functional connectivity.55,58 Compared to other modalities of neuroimaging, it has a very good spatial resolution, competing with the best fMRI scanners.12,71,81 The temporal resolution is remarkably high. However, because the physiological process measured by fUS imaging is happening at slower temporal and larger spatial scales than the actual imaging modality due to the neurovascular coupling, both the effective spatial and temporal resolutions are thereby limited. It has to be noted, nevertheless, that this fast temporal resolution enabled us in the past to measure directional propagation of hemodynamic signals within layers of the cortex in the primate brain, thanks to lag correlation at high sampling rates (<10 ms) faster than the cardiac cycle or the hemodynamic response.20 The effective spatial resolution provided in fUS imaging was also shown to be comparable to the resolution of the CBV images in another recent work.5 During auditory stimuli, Bimbard et al.5 demonstrated in awake ferrets that fUS imaging was able to provide voxel-to-voxel independent information both in the auditory cortex and deep-seated regions with an effective resolution of 100 µm for voxel responsiveness and 300 µm for voxel frequency tuning. Probably the 2 main advantages of fUS imaging are its high sensitivity (comparable to calcium imaging at the pixel level, as demonstrated recently6) and its portability compared to other techniques. Apart for very recent developments in 3D imaging,57 the main disadvantage of the technique (compared to others) is the imaging in 2 dimensions. Also, as ultrasounds are attenuated by bones, apart in conditions where the skull is thin (rat pups, mice79) or naturally (through the fontanel in infants16) or surgically opened (perioperative interventions in adults32), fUS imaging requires more invasive preparations (such as a laminectomy in this study).
4.1. Functional activations in the rat's spinal cord
It has long been established that peripheral application of a noxious stimulus induces in the spinal cord a concomitant increased neuronal activity,11 energy consumption,34 metabolic response,49 and BOLD signal.39 Interestingly, the physiological properties of the neurovascular coupling in the brain and the spinal cord are very similar.13,54 One important difference, however, is the tight neurovascular coupling that exists in the spinal cord between neuronal activation and increased blood flow, independently of changes in mean arterial blood pressure, a feature not observed in the brain after C-fiber stimulations.56
Our study showed, using fUS imaging, a C-fiber-evoked hemodynamic response (elicited by activation of either natural noxious mechanical stimulations or electrically activated C fibers) in the ipsilateral dorsal horn to the stimulus and was restricted spatially to approximately 1 to 2 mm, after the somatotopy of the dermatome stimulated. The localization in the ipsilateral dorsal horn is consistent with previous observations by other groups using fMRI,43,46,48,90 intrinsic optical imaging,61 and in light scattering imaging,27 and suggests, as discussed by these authors, that the spinal neurovascular response observed is extremely locally restricted to ipsilateral site and to laminae in the dorsal horn where activated neurons are located. A large number of studies in human subjects also reported a contralateral activation after noxious heat stimulations9,59,69,86 (and sometimes innocuous ones59). But this feature was not always observed in human subjects7,21,53 and usually not observed in anesthetized rodents. The nature and intensity of the stimulations, as well as the presence of anesthesia, might explain the difference of results. The observations both in human72 and macaque,89 in the same subjects of a unique ipsilateral activation induced by innocuous stimulation but both ipsilateral and contralateral activations by noxious heat, support this hypothesis.
Stimulation of the interdigit territories are known to activate diverse dermatomes, inducing the transmission of sensory signal in the tibial and (to a smaller extent) to the saphenous nerves to the spinal segments L3 to L5 where they activate postsynaptic neurons.74,75 Study of the somatotopy of hemodynamic responses in the spinal cord using neuroimaging was performed previously in human subjects7,9,53,68,70 but, to the best of our knowledge, it had never been performed in rodents. Despite the spatial heterogeneity of the activated area, we identified the centroid of this activation area and demonstrated its spatial shift along the lumbar segment when stimulations were successively applied to the L3, L4, or L5 dermatomes. The spatial translation of these activation areas along the lumbar segment (L3-L5: 2.5 ± 0.3 mm, L4-L5: 1.2 ± 0.4 mm) was found to be consistent with the known neuroanatomy of the rat spinal cord85 and location of the activated areas in these specific segments.73,74,88
It is interesting to note that although the vasculature of the parenchyma could not be detected in fUS imaging (Fig. 1, and was only detected using ULM), functional activations (ie, measurements of Doppler signal in correlation with the stimulus) could be easily detected using fUS imaging, suggesting the high sensitivity of the technique to detect subtle changes of task-evoked SBV. This agrees with previous observations that fUS imaging is sensitive enough to measure neurovascular changes at the pixel level, within single trials.6
Surprisingly, the shape of the spinal area activated, observed in the sagittal axis, was spatially heterogeneous. Independently of the stimulus intensity, it was consistently formed by 2 to 3 discontinued ovals of 700-µm diameter in the anteroposterior axis. It can be hypothesized that this heterogenous form could be due to (1) the possible heterogeneity in either the afferent fibers and/or the spatial distribution of spinal neurons and/or (2) a heterogeneity in the diameter of the blood vessels irrigating the spinal segment. It has long been described that the somatotopic distribution of tibial, sural, and saphenous nerves terminates in a widespread manner in laminae I-V of the lumbar segments L3 to L5.62,73 Concomitantly, postsynaptic neurons are located homogeneously either in superficial laminae (laminae I, where nociceptive specific neurons are located) or in deep laminae (where nonspecific nociceptive neurons are located).8,87,88 Therefore, because both afferent and postsynaptic neurons are quite homogeneously distributed throughout each spinal segment, it is likely that the heterogenous shape of the activated areas has a vascular origin.
4.2. Intensity-specific hemodynamic response
The comparison of the efficacy of the various types of afferent fiber stimulation to induce an evoked spinal hemodynamic response showed that C fibers and Aδ stimulation induce a robust hemodynamic response due to local neuronal activation through an NMDA receptor-dependent mechanism. Zhao et al.91 showed previously that imaging of the spinal cord allows pharmacological studies in the rat. Stimulation of large myelinated fibers through innocuous stimulations gave rise to increased SBV, but to a smaller extent than other types of fibers. Such increased neurovascular coupling induced by innocuous stimulation has been detected in fMRI in humans,7,53,59,67,68,70 but not in animal models, even using intravenous injection of ultrasmall superparamagnetic iron oxide particles using a gradient echo.90 Only one study managed to detect it using light scattering,27 but this approach lacks spatial discrimination.
4.3. Imaging spinal cord's central sensitization
Persistent pain associated with injury or diseases can result from both peripheral and central sensitization. Central sensitization is characterized by a state of hyperexcitability of the central nervous system, in which application of nonnociceptive stimuli (such as the gentle brush of the skin) is perceived as noxious, a clinical symptom termed “allodynia.”33 Among the approaches usually used to study these mechanisms, electrophysiological recordings measure the neuronal activity with excellent temporal resolution, but in an extremely small area. Other approaches (immunohistochemistry) do not allow dynamic reading over time. Imaging of central sensitization using fMRI has previously reported an increased spinal responsiveness in healthy volunteers86 and diabetic rats.47 Our study measured the spinal responsiveness to allodynic stimulations in the contact of inflammatory pain. Consistent with observations of Rempe et al.,59 we observed an exacerbated response in the ipsilateral dorsal horn. These results, that suggest an increased neuronal activity in this model, are consistent with previous demonstrations that in inflammatory conditions, wide-dynamic-range neurons have both an enhanced spontaneous activity and exacerbated response to innocuous mechanical stimulations.50
As evidenced in other parts of the CNS, it is very likely that the neuronal hyperexcitability, through a glutamate-mediated signaling mechanisms (such as nitric oxide [from neurons] and arachidonic acid derivatives [from astrocytes]), leads to this enhanced hemodynamic response.1,41
In conclusion, this study revealed the ability of fUS imaging to provide insightful information on the spinal physiology and its potential in the future for the development of analgesic drugs.
Conflict of interest statement
M.T. and T.D. are co-founders and shareholders of Iconeus company and are co-inventors of several patents in the field of neurofunctional ultrasound licenced to Iconeus company.The remaining authors have no conflicts of interest to declare.
Appendix A. Supplemental digital content
Supplemental digital content associated with this article can be found online at http://links.lww.com/PAIN/B176.
Supplemental video content
A video abstract associated with this article can be found at http://links.lww.com/PAIN/B177.
Acknowledgements
The authors thank the CNRS, INSERM, and ESPCI Paris for their financial support, and Iconeus company for their collaboration and support on the software development.
Supported by the Foundation Bettencourt-Schueller, the LABEX WIFI (Laboratory of Excellence within the French Program “Investments for the Future”) under reference ANR-10-IDEX-0001-02 PSL, the National Agency for Research under the program “future investments” with the reference ANR-10-EQPX-15, and the European Research Council (ERC) Advanced Grant FUSIMAGINE. Line Rahal was supported by a fellowship from the “Fondation NRJ”-Institut de France award granted to Mickael Tanter. Finally, this work was supported by the Inserm ART (Technology Research Accelerator) in “Biomedical Ultrasound.”
The authors thank Miss Alice Fermigier for her early involvement in the project, Mr Alexandre Dizeux for his help in graphics design, and for his drawing of the cover, Mr Jérémy Ferrier for the critical reading of the manuscript, and Mrs Noémie Dherbe and Nathalie Ialy-Radio for animal husbandry.
Footnotes
Supplemental digital content is available for this article. Direct URL citations appear in the printed text and are provided in the HTML and PDF versions of this article on the journal's Web site (www.painjournalonline.com).
Mickael Tanter and Sophie Pezet directed this work equally.
References
- [1].Attwell D, Buchan AM, Charpak S, Lauritzen M, MacVicar BA, Newman EA. Glial and neuronal control of brain blood flow. Nature 2010;468:232–43. [DOI] [PMC free article] [PubMed] [Google Scholar]
- [2].Aydin A-K, Haselden WD, Goulam Houssen Y, Pouzat C, Rungta RL, Demené C, Tanter M, Drew PJ, Charpak S, Boido D. Transfer functions linking neural calcium to single voxel functional ultrasound signal. Nat Commun 2020;11:2954. [DOI] [PMC free article] [PubMed] [Google Scholar]
- [3].Bergel A, Deffieux T, Demené C, Tanter M, Cohen I. Local hippocampal fast gamma rhythms precede brain-wide hyperemic patterns during spontaneous rodent REM sleep. Nat Commun 2018;9:5364. [DOI] [PMC free article] [PubMed] [Google Scholar]
- [4].Betzig E, Patterson GH, Sougrat R, Lindwasser OW, Olenych S, Bonifacino JS, Davidson MW, Lippincott-Schwartz J, Hess HF. Imaging intracellular fluorescent proteins at nanometer resolution. Science 2006;313:1642–5. [DOI] [PubMed] [Google Scholar]
- [5].Bimbard C, Demene C, Girard C, Radtke-Schuller S, Shamma S, Tanter M, Boubenec Y. Multi-scale mapping along the auditory hierarchy using high-resolution functional UltraSound in the awake ferret. eLife 2018;7:e35028. [DOI] [PMC free article] [PubMed] [Google Scholar]
- [6].Boido D, Rungta RL, Osmanski BF, Roche M, Tsurugizawa T, Le Bihan D, Ciobanu L, Charpak S. Mesoscopic and microscopic imaging of sensory responses in the same animal. Nat Commun 2019;10:1110. [DOI] [PMC free article] [PubMed] [Google Scholar]
- [7].Brooks JCW, Kong Y, Lee MC, Warnaby CE, Wanigasekera V, Jenkinson M, Tracey I. Stimulus site and modality dependence of functional activity within the human spinal cord. J Neurosci 2012;32:6231–9. [DOI] [PMC free article] [PubMed] [Google Scholar]
- [8].Bullitt E. Somatotopy of spinal nociceptive processing. J Comp Neurol 1991;312:279–90. [DOI] [PubMed] [Google Scholar]
- [9].Cahill CM, Stroman PW. Mapping of neural activity produced by thermal pain in the healthy human spinal cord and brain stem: a functional magnetic resonance imaging study. Magn Reson Imaging 2011;29:342–52. [DOI] [PubMed] [Google Scholar]
- [10].Chang C, Shyu BC. A fMRI study of brain activations during non-noxious and noxious electrical stimulation of the sciatic nerve of rats. Brain Res 2001;897:71–81. [DOI] [PubMed] [Google Scholar]
- [11].Coghill RC, Price DD, Hayes RL, Mayer DJ. Spatial distribution of nociceptive processing in the rat spinal cord. J Neurophysiol 1991;65:133–40. [DOI] [PubMed] [Google Scholar]
- [12].Cohen-Adad J. Functional magnetic resonance imaging of the spinal cord: current status and future developments. Semin Ultrasound CT MRI 2017;38:176–86. [DOI] [PubMed] [Google Scholar]
- [13].Cohen-Adad J, Gauthier CJ, Brooks JCW, Slessarev M, Han J, Fisher JA, Rossignol S, Hoge RD. BOLD signal responses to controlled hypercapnia in human spinal cord. NeuroImage 2010;50:1074–84. [DOI] [PubMed] [Google Scholar]
- [14].Couture O, Hingot V, Heiles B, Muleki-Seya P, Tanter M. Ultrasound localization microscopy and super-resolution: a state of the art. IEEE Trans Ultrason Ferroelectr Freq Control 2018;65:1304–20. [DOI] [PubMed] [Google Scholar]
- [15].Davies SN, Lodge D. Evidence for involvement ofN-methylaspartate receptors in wind-up of class 2 neurones in the dorsal horn of the rat. Brain Res 1987;424:402–6. [DOI] [PubMed] [Google Scholar]
- [16].Demene C, Baranger J, Bernal M, Delanoe C, Auvin S, Biran V, Alison A, Mairesse J, Harribaud E, Pernot M, Tanter M, Baud O. Functional ultrasound imaging of brain activity in human newborns. Sci Translational Med 2017;9:eaah6756. [DOI] [PubMed] [Google Scholar]
- [17].Demené C, Deffieux T, Pernot M, Osmanski B-F, Biran V, Gennisson JL, Sieu LA, Bergel A, Franqui S, Correas JM, Cohen I, Baud O, Tanter M. Spatiotemporal clutter filtering of ultrafast ultrasound data highly increases Doppler and fUltrasound sensitivity. IEEE Trans Med Imaging 2015;34:2271–85. [DOI] [PubMed] [Google Scholar]
- [18].Demene C, Tiran E, Sieu LA, Bergel A, Gennisson JL, Pernot M, Deffieux T, Cohen I, Tanter M. 4D microvascular imaging based on ultrafast Doppler tomography. NeuroImage 2015;127:472–83. [DOI] [PubMed] [Google Scholar]
- [19].Dickenson AH, Sullivan AF. Differential effects of excitatory amino acid antagonists on dorsal horn nociceptive neurones in the rat. Brain Res 1990;506:31–9. [DOI] [PubMed] [Google Scholar]
- [20].Dizeux A, Gesnik M, Ahnine H, Blaize K, Arcizet F, Picaud S, Sahel J-A, Deffieux T, Pouget P, Tanter M. Functional ultrasound imaging of the brain reveals propagation of task-related brain activity in behaving primates. Nat Commun 2019;10:1400. [DOI] [PMC free article] [PubMed] [Google Scholar]
- [21].Eippert F, Finsterbusch J, Bingel U, Büchel C. Direct evidence for spinal cord involvement in placebo analgesia. Science 2009;326:404. [DOI] [PubMed] [Google Scholar]
- [22].Errico C, Osmanski BF, Pezet S, Couture O, Lenkei Z, Tanter M. Transcranial functional ultrasound imaging of the brain using microbubble-enhanced ultrasensitive Doppler. NeuroImage 2016;124:752–61. [DOI] [PMC free article] [PubMed] [Google Scholar]
- [23].Errico C, Pierre J, Pezet S, Desailly Y, Lenkei Z, Couture O, Tanter M. Ultrafast ultrasound localization microscopy for deep super-resolution vascular imaging. Nature 2015;527:499–502. [DOI] [PubMed] [Google Scholar]
- [24].Frostig RD, Lieke EE, Ts'o DY, Grinvald A. Cortical functional architecture and local coupling between neuronal activity and the microcirculation revealed by in vivo high-resolution optical imaging of intrinsic signals. Proc Natl Acad Sci U S A 1990;87:6082–6. [DOI] [PMC free article] [PubMed] [Google Scholar]
- [25].Gesnik M, Blaize K, Deffieux T, Gennisson JL, Sahel JA, Fink M, Picaud S, Tanter M. 3D functional ultrasound imaging of the cerebral visual system in rodents. NeuroImage 2017;149:267–74. [DOI] [PMC free article] [PubMed] [Google Scholar]
- [26].Giulietti G, Giove F, Garreffa G, Colonnese C, Mangia S, Maraviglia B. Characterization of the functional response in the human spinal cord: impulse-response function and linearity. NeuroImage 2008;42:626–34. [DOI] [PubMed] [Google Scholar]
- [27].He JW, Liu H, Peng Y. Hemodynamic and light-scattering changes of rat spinal cord and primary somatosensory cortex in response to innocuous and noxious stimuli. Brain Sci 2015;5:400–18. [DOI] [PMC free article] [PubMed] [Google Scholar]
- [28].Henriques R, Lelek M, Fornasiero EF, Valtorta F, Zimmer C, Mhlanga MM. QuickPALM: 3D real-time photoactivation nanoscopy image processing in ImageJ. Nat Methods 2010;7:339–40. [DOI] [PubMed] [Google Scholar]
- [29].Hingot V, Errico C, Heiles B, Rahal L, Tanter M, Couture O. Microvascular flow dictates the compromise between spatial resolution and acquisition time in Ultrasound Localization Microscopy. Scientific Rep 2019;9:2456. [DOI] [PMC free article] [PubMed] [Google Scholar]
- [30].Hingot V, Errico C, Tanter M, Couture O. Subwavelength motion-correction for ultrafast ultrasound localization microscopy. Ultrasonics 2017;77:17–21. [DOI] [PubMed] [Google Scholar]
- [31].Iadecola C. The neurovascular unit coming of age: a journey through neurovascular coupling in health and disease. Neuron 2017;96:17–42. [DOI] [PMC free article] [PubMed] [Google Scholar]
- [32].Imbault M, Chauvet D, Gennisson JL, Capelle L, Tanter M. Intraoperative functional ultrasound imaging of human brain activity. Sci Rep 2017;7:7304. [DOI] [PMC free article] [PubMed] [Google Scholar]
- [33].Jensen TS, Finnerup NB. Allodynia and hyperalgesia in neuropathic pain: clinical manifestations and mechanisms. Lancet Neurol 2014;13:924–35. [DOI] [PubMed] [Google Scholar]
- [34].Kadekaro M, Crane AM, Sokoloff L. Differential effects of electrical stimulation of sciatic nerve on metabolic activity in spinal cord and dorsal root ganglion in the rat. Proc Natl Acad Sci U S A 1985;82:6010–13. [DOI] [PMC free article] [PubMed] [Google Scholar]
- [35].Khaing ZZ, Cates LN, DeWees DM, Hannah A, Mourad P, Bruce M, Hofstetter CP. Contrast-enhanced ultrasound to visualize hemodynamic changes after rodent spinal cord injury. J Neurosurg Spine 2018;29:306–13. [DOI] [PubMed] [Google Scholar]
- [36].Kuhn HW. The Hungarian method for the assignment problem. In: Jünger M, Liebling TM, Naddef D, Nemhauser GL, Pulleyblank WR, Reinelt G, Rinaldi G, Wolsey LA, editors. 50 Years of Integer Programming 1958-2008: From the Early Years to the State-of-the-Art. Heidelberg: Springer Berlin Heidelberg, 2010. p. 29–47. doi: 10.1007/978-3-540-68279-0_2. [DOI] [Google Scholar]
- [37].Kuner R. Central mechanisms of pathological pain. Nat Med 2010;16:1258–66. [DOI] [PubMed] [Google Scholar]
- [38].Latremoliere A, Woolf CJ. Central sensitization: a generator of pain hypersensitivity by central neural plasticity. J Pain 2009;10:895–926. [DOI] [PMC free article] [PubMed] [Google Scholar]
- [39].Lawrence J, Stroman PW, Bascaramurty S, Jordan LM, Malisza KL. Correlation of functional activation in the rat spinal cord with neuronal activation detected by immunohistochemistry. NeuroImage 2004;22:1802–7. [DOI] [PubMed] [Google Scholar]
- [40].Le Bars D, Dickenson AH, Besson JM. Diffuse noxious inhibitory controls (DNIC). I. Effects on dorsal horn convergent neurones in the rat. PAIN 1979;6:283–304. [DOI] [PubMed] [Google Scholar]
- [41].Lecrux C, Hamel E. Neuronal networks and mediators of cortical neurovascular coupling responses in normal and altered brain states. Phil Trans R Soc B 2016;371:20150350. [DOI] [PMC free article] [PubMed] [Google Scholar]
- [42].Li Y, Song Y, Zhao L, Gaidosh G, Laties AM, Wen R. Direct labeling and visualization of blood vessels with lipophilic carbocyanine dye DiI. Nat Protoc 2008;3:1703–8. [DOI] [PMC free article] [PubMed] [Google Scholar]
- [43].Lilja J, Endo T, Hofstetter C, Westman E, Young J, Olson L, Spenger C. Blood oxygenation level-dependent visualization of synaptic relay stations of sensory pathways along the neuroaxis in response to graded sensory stimulation of a limb. J Neurosci 2006;26:6330–6. [DOI] [PMC free article] [PubMed] [Google Scholar]
- [44].Lindquist MA, Meng Loh J, Atlas LY, Wager TD. Modeling the hemodynamic response function in fMRI: efficiency, bias and mis-modeling. NeuroImage 2009;45:S187–98. [DOI] [PMC free article] [PubMed] [Google Scholar]
- [45].Mace EE, Montaldo G, Cohen I, Baulac M, Fink M, Tanter M. Functional ultrasound imaging of the brain. Nat Methods 2011;8:662–4. [DOI] [PubMed] [Google Scholar]
- [46].Majcher K, Tomanek B, Jasinski A, Foniok T, Stroman PW, Tuor UI, Kirk D, Hess G. Simultaneous functional magnetic resonance imaging in the rat spinal cord and brain. Exp Neurol 2006;197:458–64. [DOI] [PubMed] [Google Scholar]
- [47].Malisza KL, Jones C, Gruwel MLH, Foreman D, Fernyhough P, Calcutt NA. Functional magnetic resonance imaging of the spinal cord during sensory stimulation in diabetic rats. J Magn Reson Imaging 2009;30:271–6. [DOI] [PMC free article] [PubMed] [Google Scholar]
- [48].Malisza KL, Stroman PW, Turner A, Gregorash L, Foniok T, Wright A. Functional MRI of the rat lumbar spinal cord involving painful stimulation and the effect of peripheral joint mobilization. J Magn Reson Imaging 2003;18:152–9. [DOI] [PubMed] [Google Scholar]
- [49].Marcus ML, Heistad DD, Ehrhardt JC, Abboud FM. Regulation of total and regional spinal cord blood flow. Circ Res 1977;41:128–34. [DOI] [PubMed] [Google Scholar]
- [50].McGaraughty S, Chu KL, Xu J. Characterization and pharmacological modulation of noci-responsive deep dorsal horn neurons across diverse rat models of pathological pain. J Neurophysiol 2018;120:1893–905. [DOI] [PubMed] [Google Scholar]
- [51].McMahon SB, Lewin GR, Wall PD. Central hyperexcitability triggered by noxious inputs. Curr Opin Neurobiol 1993;3:602–10. [DOI] [PubMed] [Google Scholar]
- [52].Menétrey D, Giesler GJ, Besson JM. An analysis of response properties of spinal cord dorsal horn neurones to nonnoxious and noxious stimuli in the spinal rat. Exp Brain Res 1977;27:15–33. [DOI] [PubMed] [Google Scholar]
- [53].Nash P, Wiley K, Brown J, Shinaman R, Ludlow D, Sawyer A-M, Glover G, Mackey S. Functional magnetic resonance imaging identifies somatotopic organization of nociception in the human spinal cord. PAIN 2013;154:776–81. [DOI] [PubMed] [Google Scholar]
- [54].Nix W, Capra NF, Erdmann W, Halsey JH. Comparison of vascular reactivity in spinal cord and brain. Stroke 1976;7:560–3. [DOI] [PubMed] [Google Scholar]
- [55].Osmanski BF, Martin C, Montaldo G, Lanièce P, Pain F, Tanter M, Gurden H. Functional ultrasound imaging reveals different odor-evoked patterns of vascular activity in the main olfactory bulb and the anterior piriform cortex. NeuroImage 2014;95:176–84. [DOI] [PubMed] [Google Scholar]
- [56].Piché M, Paquette T, Leblond H. Tight neurovascular coupling in the spinal cord during nociceptive stimulation in intact and spinal rats. Neuroscience 2017;355:1–8. [DOI] [PubMed] [Google Scholar]
- [57].Rabut C, Correia M, Finel V, Pezet S, Pernot M, Deffieux T, Tanter M. 4D functional ultrasound imaging of whole-brain activity in rodents. Nat Methods 2019;16:994–7. [DOI] [PMC free article] [PubMed] [Google Scholar]
- [58].Rahal L, Thibaut M, Rivals I, Claron J, Lenkei Z, Sitt JD, Tanter M, Pezet S. Ultrafast ultrasound imaging pattern analysis reveals distinctive dynamic brain states and potent sub-network alterations in arthritic animals. Scientific Rep 2020;10:1–17. [DOI] [PMC free article] [PubMed] [Google Scholar]
- [59].Rempe T, Wolff S, Riedel C, Baron R, Stroman PW, Jansen O, Gierthmühlen J. Spinal and supraspinal processing of thermal stimuli: an fMRI study: processing of Thermal Stimuli. J Magn Reson Imaging 2015;41:1046–55. [DOI] [PubMed] [Google Scholar]
- [60].Rosa PN, Figueiredo P, Silvestre CJ. On the distinguishability of HRF models in fMRI. Front Comput Neurosci 2015;9:54. [DOI] [PMC free article] [PubMed] [Google Scholar]
- [61].Sasaki S, Yazawa I, Miyakawa N, Mochida H, Shinomiya K, Kamino K, Momose-Sato Y, Sato K. Optical imaging of intrinsic signals induced by peripheral nerve stimulation in the in vivo rat spinal cord. NeuroImage 2002;17:1240–55. [DOI] [PubMed] [Google Scholar]
- [62].Shortland P, Woolf CJ, Fitzgerald M. Morphology and somatotopic organization of the central terminals of hindlimb hair follicle merents in the rat lumbar spinal cord. 1989;289:416–33. [DOI] [PubMed] [Google Scholar]
- [63].Sieu LA, Bergel A, Tiran E, Deffieux T, Pernot M, Gennisson JL, Tanter M, Cohen I. EEG and functional ultrasound imaging in mobile rats. Nat Methods 2015;12:831–4. [DOI] [PMC free article] [PubMed] [Google Scholar]
- [64].Silva AC, Lee SP, Iadecola C, Kim SG. Early temporal characteristics of cerebral blood flow and deoxyhemoglobin changes during somatosensory stimulation. J Cereb Blood Flow Metab 2000;20:201–6. [DOI] [PubMed] [Google Scholar]
- [65].Song P, Cuellar CA, Tang S, Islam R, Wen H, Huang C, Manduca A, Trzasko JD, Knudsen BE, Lee KH, Chen S, Lavrov IA. Functional ultrasound imaging of spinal cord hemodynamic responses to epidural electrical stimulation: a feasibility study. Front Neurol 2019;10:279. [DOI] [PMC free article] [PubMed] [Google Scholar]
- [66].Soubeyrand M, Badner A, Vawda R, Chung YS, Fehlings MG. Very high resolution ultrasound imaging for real-time quantitative visualization of vascular disruption after spinal cord injury. J Neurotrauma 2014;31:1767–75. [DOI] [PMC free article] [PubMed] [Google Scholar]
- [67].Sprenger C, Finsterbusch J, Buchel C. Spinal cord-midbrain functional connectivity is related to perceived pain intensity: a combined spino-cortical fMRI study. J Neurosci 2015;35:4248–57. [DOI] [PMC free article] [PubMed] [Google Scholar]
- [68].Stroman P. Mapping of neuronal function in the healthy and injured human spinal cord with spinal fMRI. NeuroImage 2002;17:1854–60. [DOI] [PubMed] [Google Scholar]
- [69].Stroman PW. Spinal fMRI investigation of human spinal cord function over a range of innocuous thermal sensory stimuli and study-related emotional influences. Magn Reson Imaging 2009;27:1333–46. [DOI] [PubMed] [Google Scholar]
- [70].Stroman PW, Bosma RL, Tsyben A. Somatotopic arrangement of thermal sensory regions in the healthy human spinal cord determined by means of spinal cord functional MRI. Magn Reson Med 2012;68:923–31. [DOI] [PubMed] [Google Scholar]
- [71].Stroman PW, Wheeler-Kingshott C, Bacon M, Schwab JM, Bosma R, Brooks J, Cadotte D, Carlstedt T, Ciccarelli O, Cohen-Adad J, Curt A, Evangelou N, Fehlings MG, Filippi M, Kelley BJ, Kollias S, Mackay A, Porro CA, Smith S, Strittmatter SM, Summers P, Tracey I. The current state-of-the-art of spinal cord imaging: Methods. NeuroImage 2014;84:1070–81. [DOI] [PMC free article] [PubMed] [Google Scholar]
- [72].Summers PE, Ferraro D, Duzzi D, Lui F, Iannetti GD, Porro CA. A quantitative comparison of BOLD fMRI responses to noxious and innocuous stimuli in the human spinal cord. NeuroImage 2010;50:1408–15. [DOI] [PubMed] [Google Scholar]
- [73].Swett JE, Woolf CJ. The somatotopic organization of primary afferent terminals in the superficial laminae of the dorsal horn of the rat spinal cord. J Comp Neurol 1985;231:66–77. [DOI] [PubMed] [Google Scholar]
- [74].Takahashi Y, Chiba T, Kurokawa M, Aoki Y. Dermatomes and the central organization of dermatomes and body surface regions in the spinal cord dorsal horn in rats. J Comp Neurol 2003;462:29–41. [DOI] [PubMed] [Google Scholar]
- [75].Takahashi Y, Nakajima Y. Dermatomes in the rat limbs as determined by antidromic stimulation of sensory C-fibers in spinal nerves. PAIN 1996;67:197–202. [DOI] [PubMed] [Google Scholar]
- [76].Thibault K, Calvino B, Pezet S. Characterisation of sensory abnormalities observed in an animal model of multiple sclerosis: a behavioural and pharmacological study. Eur J Pain 2011;15:231.e1–16. [DOI] [PubMed] [Google Scholar]
- [77].Thibault K, Calvino B, Rivals I, Marchand F, Dubacq S, McMahon SB, Pezet S. Molecular mechanisms underlying the enhanced analgesic effect of oxycodone compared to morphine in chemotherapy-induced neuropathic pain. PLoS One 2014;9:e91297. [DOI] [PMC free article] [PubMed] [Google Scholar]
- [78].Thibault K, Carrel D, Bonnard D, Gallatz K, Simon A, Biard M, Pezet S, Palkovits M, Lenkei Z. Activation-dependent subcellular distribution patterns of CB1 cannabinoid receptors in the rat forebrain. Cereb Cortex 2013;23:2581–91. [DOI] [PubMed] [Google Scholar]
- [79].Tiran E, Ferrier J, Deffieux T, Gennisson JL, Pezet S, Lenkei Z, Tanter M. Transcranial functional ultrasound imaging in freely moving awake mice and anesthetized young rats without contrast agent. Ultrasound Med Biol 2017;43:1679–89. [DOI] [PMC free article] [PubMed] [Google Scholar]
- [80].Todd AJ. Neuronal circuitry for pain processing in the dorsal horn. Nat Rev Neurosci 2010;11:823–36. [DOI] [PMC free article] [PubMed] [Google Scholar]
- [81].Tsurugizawa T, Tamada K, Ono N, Karakawa S, Kodama Y, Debacker C, Hata J, Okano H, Kitamura A, Zalesky A, Takumi T. Awake functional MRI detects neural circuit dysfunction in a mouse model of autism. Sci Adv 2020;6:eaav4520. [DOI] [PMC free article] [PubMed] [Google Scholar]
- [82].Uludağ K, Blinder P. Linking brain vascular physiology to hemodynamic response in ultra-high field MRI. NeuroImage 2018;168:279–95. [DOI] [PubMed] [Google Scholar]
- [83].Urban A, Dussaux C, Martel G, Brunner C, Mace E, Montaldo G. Real-time imaging of brain activity in freely moving rats using functional ultrasound. Nat Methods 2015;12:873–8. [DOI] [PubMed] [Google Scholar]
- [84].Vergari C, Rouch P, Dubois GJR, Bonneau D, Dubousset JF, Tanter M, Gennisson JL, Skalli W. Intervertebral disc characterization by shear wave elastography: an in vitro preliminary study. Proc Inst Mech Eng H 2014;228:607–15. [DOI] [PubMed] [Google Scholar]
- [85].Waibl H. Zur Topographie der Medulla spinalis der Albinoratte (Rattus norvegicus)/Contributions to the Topography of the Spinal Cord of the Albino Rat (Rattus norvegicus). 1973. Available at: http://link.springer.com/openurl?genre=book&isbn=978-3-540-06344-5. Accessed February 26, 2020. [Google Scholar]
- [86].Weber KA, Chen Y, Wang X, Kahnt T, Parrish TB. Functional magnetic resonance imaging of the cervical spinal cord during thermal stimulation across consecutive runs. NeuroImage 2016;143:267–79. [DOI] [PMC free article] [PubMed] [Google Scholar]
- [87].Wilson P, Kitchener PD. Plasticity of cutaneous primary afferent projections to the spinal dorsal horn. Prog Neurobiol 1996;48:105–29. [DOI] [PubMed] [Google Scholar]
- [88].Woolf CJ, Fitzgerald M. Somatotopic organization of cutaneous afferent terminals and dorsal horn neuronal receptive fields in the superficial and deep laminae of the rat lumbar spinal cord. J Comp Neurol 1986;251:517–31. [DOI] [PubMed] [Google Scholar]
- [89].Yang P-F, Wang F, Chen LM. Differential fMRI activation patterns to noxious heat and tactile stimuli in the primate spinal cord. J Neurosci 2015;35:10493–502. [DOI] [PMC free article] [PubMed] [Google Scholar]
- [90].Zhao F, Williams M, Meng X, Welsh DC, Coimbra A, Crown ED, Cook JJ, Urban MO, Hargreaves R, Williams DS. BOLD and blood volume-weighted fMRI of rat lumbar spinal cord during non-noxious and noxious electrical hindpaw stimulation. NeuroImage 2008;40:133–47. [DOI] [PubMed] [Google Scholar]
- [91].Zhao F, Williams M, Welsh DC, Meng X, Ritter A, Abbadie C, Cook JJ, Reicin AS, Hargreaves R, Williams DS. fMRI investigation of the effect of local and systemic lidocaine on noxious electrical stimulation-induced activation in spinal cord. PAIN 2009;145:110–19. [DOI] [PubMed] [Google Scholar]
Associated Data
This section collects any data citations, data availability statements, or supplementary materials included in this article.
Supplementary Materials
Supplemental digital content associated with this article can be found online at http://links.lww.com/PAIN/B176.
A video abstract associated with this article can be found at http://links.lww.com/PAIN/B177.