Abstract
Sepsis is the most common cause of death for patients in intensive care worldwide, due to a dysregulated host response to infection. Here, we investigate the role of sequestosome 1 (SQSTM1/p62), an autophagy receptor that functions as a regulator of innate immunity, in sepsis. We find that lipopolysaccharide elicits gasdermin D (GSDMD)-dependent pyroptosis to enable passive SQSTM1 release from macrophages and monocytes, whereas transmembrane protein 173 (TMEM173/STING)-dependent TANK-binding kinase 1 (TBK1) activation results in phosphorylation of SQSTM1 at Ser403 and subsequent SQSTM1 secretion from macrophages and monocytes. Moreover, extracellular SQSTM1 binds to insulin receptor (INSR), which in turn activates an nuclear factor kappa B (NFKB)-dependent metabolic pathway, leading to aerobic glycolysis and polarization of macrophages. Intraperitoneal injection of anti-SQSTM1–neutralizing monoclonal antibodies or conditional depletion of Insr in myeloid cells using the Cre-loxP system protects mice from lethal sepsis (cecal ligation and puncture or infection by Escherichia coli or Streptococcus pneumoniae) and endotoxemia. We also report that circulating SQSTM1 and mRNA expression levels of SQSTM1 and INSR in peripheral blood mononuclear cells are related to the severity of sepsis in 40 patients. Thus, extracellular SQSTM1 has a pathological role in sepsis and could be targeted to develop therapies for sepsis.
INTRODUCTION
Sepsis is a life-threatening organ dysfunction caused by a dysregulated host response to infection1, often due to Gram-negative bacteria, and occasionally Gram-positive bacteria, fungi, or viruses2. Infections with bacteria are characterized by the excessive activation of the innate immune system that upregulates the release of mediators that trigger inflammation, metabolic deregulation, immunosuppression, and multiple organ failure2. Identifying previously unrecognized immunotherapy targets may revolutionize the treatment of sepsis and septic shock.
Macroautophagy/autophagy is a lysosome-dependent degradation pathway that plays a dual role in inflammation, immunity, and diseases3–6. Autophagy not only eliminates invading foreign organisms or inhibits the activation of inflammasome, but also mediates the release of cytokines. The process of autophagy is controlled by a family of autophagy-related (ATG) proteins and autophagy receptors (e.g., sequestosome 1 [SQSTM1/p62])7,8. In addition to the function of intracellular ATG, some ATGs (e.g., ATG5 or BECN1) are detected in the blood of patients with chronic central nervous system inflammation or diabetic kidney diseases9–11. Moreover, elevated serum SQSTM1 levels are independent risk factors for patients with steatosis and lobular inflammation12. These findings indicate the emerging role of extracellular autophagy regulators in disease.
SQSTM1/p62 is a multi-faceted regulator of innate immunity through autophagy-dependent and independent functions13–17. For example, intracellular SQSTM1 binds to tumor necrosis factor receptor-associated factor 6 (TRAF6) to activate nuclear factor kappa B (NFKB/NFκB), a key regulator of immunity18,19. Compared with intracellular SQSTM1, the molecular mechanism of innate immunity mediated by extracellular SQSTM1 is unclear. In this study, we reported that extracellular SQSTM1 mediates septic death in mice by activating insulin receptor signaling in myeloid cells (macrophages and monocytes).
RESULTS
The activation of MYD88-dependent TLR4 signaling induces SQSTM1 expression and secretion
Lipopolysaccharide (LPS) is a pathogen-associated molecular pattern (PAMP) from Gram-negative bacteria during sepsis. Large amounts of SQSTM1 were released from monocytes or macrophages (including immortalized murine bone marrow-derived macrophages [BMDMs], THP1 [a human monocytic cell line], primary human blood monocyte-derived macrophages [HPBMs], primary mouse peritoneal macrophages [MPMs], primary mouse lung macrophages [MLMs], and primary mouse hepatic macrophages [MHMs]) in a time-dependent manner, beginning 12 h after stimulation with LPS (Fig. 1a and Extended Data Fig. 1a). LPS concentrations that induced the accumulation of extracellular SQSTM1 failed to cause cytotoxicity (Fig. 1a, Extended Data Fig. 1b, and Extended Data Fig. 1c). The dynamic of LPS-induced SQSTM1 release was similar to the release of late-mediator high-mobility group box 1 (HMGB1) (Extended Data Fig. 1c)20,21, but not the release of early-mediator TNF (Extended Data Fig. 1c)22. The size of released SQSTM1 was not changed compared to intracellular SQSTM1 in LPS-induced BMDMs (Fig. 1b). In contrast, LPS failed to induce the release of other autophagy receptors, such as NBR1 autophagy cargo receptor (NBR1), calcium-binding and coiled-coil domain 2 (CALCOCO2/NDP52), and optineurin (OPTN), in BMDMs (Fig. 1b).
Fig. 1. Activation of MYD88-dependent TLR4 signaling induces the expression and secretion of SQSTM1.
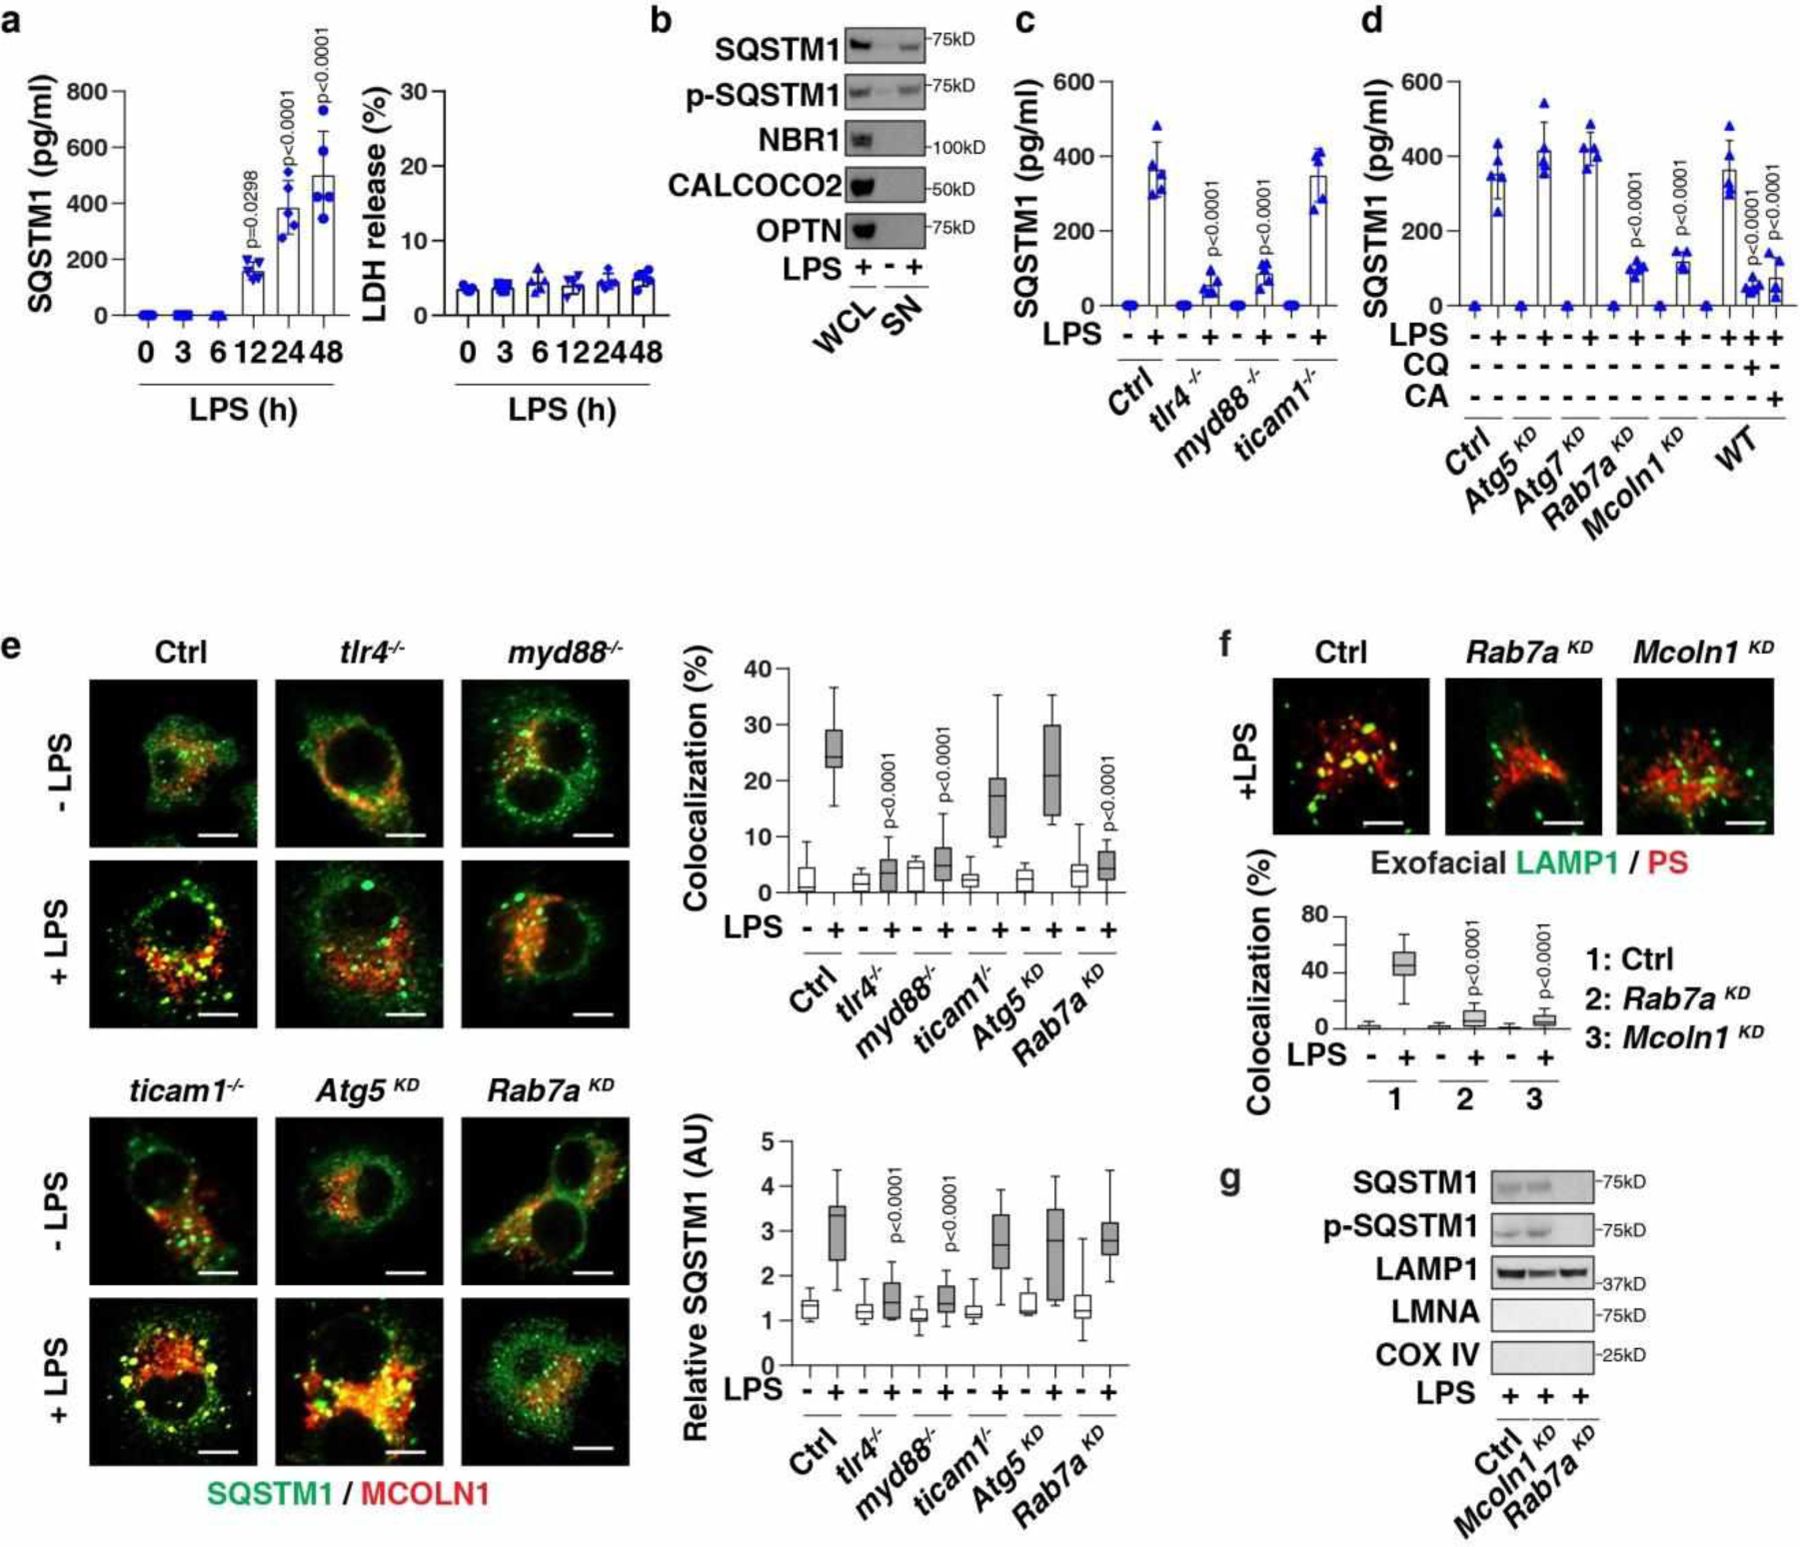
(a) SQSTM1 release and LDH release in LPS-treated BMDMs (n = 5 well /group; one-way ANOVA test, versus control group). (b) Protein levels in whole cell lysate (“WCL”) or supernatant (“SN”) in LPS-treated (200 ng/ml, 24 h) BMDMs. (c) SQSTM1 release in indicated BMDMs following treatment with LPS (200 ng/ml) for 24 h (n = 5 well /group; two-tailed t test, versus control group). (d) SQSTM1 release in the indicated BMDMs following treatment with LPS (200 ng/ml) in the absence or presence of chloroquine (“CQ,” 40 μM) or CA-047Me (“CA”, 40 μM) for 24 h (n = 5 well /group; two-tailed t test, versus LPS-alone group). (e) Analysis of co-localization between SQSTM1 (shown in green) and MCOLN1 (shown in red) in the indicated BMDMs following treatment with LPS (200 ng/ml) for 24 h (n=10 random fields; two-tailed t test, versus control group; bar = 15 μm). (f) Representative images of indicated BMDMs treated with LPS (200 ng/ml) for 24 h and stained for exofacial LAMP1 and exofacial phosphatidylserine (“PS”). The co-localization between LAMP1 and PS was quantified from 10 random fields (two-tailed t test, versus control group; bar = 15 μm). (g) SQSTM1 expression in lysosome-enriched fractions in indicated LPS-treated (200 ng/ml, 24 h) BMDMs. Data in (a), (c), and (d) are presented as mean ± SD. Data in (e) and (f) are presented as median value (black line), interquartile range (box), and minimum and maximum of all data (black line). Data in (e) and (f) are from one independent experiment. Data in (b), (c), (d), and (g) are from two independent experiments. Data in (a) are from three independent experiments.
Toll-like receptor 4 (TLR4) is a cell surface receptor for LPS23. The LPS-induced TLR4 signaling pathway uses several adaptor proteins, such as myeloid differentiation primary response gene 88 (MYD88) and toll-like receptor adaptor molecule 1 (TICAM1/TRIF), to activate transcription factors and cytokine production24. The depletion of Tlr4 (tlr4−/−), Myd88 (myd88−/−), but not Ticam1 (ticam1−/−), limited LPS-induced SQSTM1 secretion (Fig. 1c) and mRNA upregulation (Extended Data Fig. 1d). Like LPS, treatment with agonists for TLR1/2 (pam3CSK4), TLR2 (HKLM), TLR5 (FLA-ST), TLR6/2 (FSL1), TLR7 (imiquimod), TLR8 (ssRNA40), and TLR9 (ODN2006) or IL1B increased SQSTM1 release in wild-type (WT), but not in myd88−/−, BMDMs (Extended Data Fig. 1e). MYD88-independent stimuli, such as TLR3 ligands (e.g., poly[I:C]), TNF, and IL6, failed to induce SQSTM1 release (Extended Data Fig. 1e).
To determine whether autophagy and lysosome pathways is involved in SQSTM1 secretion, small interfering RNAs (siRNAs) targeting Atg5 or Atg7 or chloroquine (an inhibitor that prevents endosomal or lysosomal acidification) or CA-074Me (an inhibitor of cathepsin B) were used. The knockdown of Atg5 or Atg7 failed to block LPS-induced SQSTM1 secretion (Fig. 1d). In contrast, chloroquine or CA-074Me inhibited LPS-induced SQSTM1 secretion (Fig. 1d), indicating that the modulation of lysosomal function affects SQSTM1 release.
Moreover, we observed that the siRNA-mediated knockdown of Rab7a (encoding a small GTPase involved in organelle trafficking and protein release)25 or Mcoln1/Trpml1 (encoding a lysosomal ion channel involved in lysosomal exocytosis)26 blocked LPS-induced SQSTM1 secretion (Fig. 1d), but not its expression (Extended Data Fig. 1d). The depletion or knockdown of Tlr4, Myd88, or Rab7a (but not Mcoln1 or Atg5) inhibited LPS-induced co-localization between SQSTM1 and MCOLN1 (Fig. 1e). As expected, the knockdown of Rab7a or Mcoln1 inhibited LPS-induced exofacial LAMP1 production (Fig. 1f). The knockdown of Rab7a, but not Mcoln1, inhibited LPS-induced SQSTM1 localization in lysosomes (Fig. 1g). Collectively, these findings demonstrate that MCOLN1-dependent lysosome exocytosis contributes to LPS-induced SQSTM1 secretion.
TMEM173-dependent TBK1 activation mediates SQSTM1 phosphorylation, expression, and secretion
Protein phosphorylation is one of the most common posttranslational modifications that affects protein secretion or activity27. LPS increased intracellular SQSTM1 phosphorylation at Ser403 (but not Ser349) (Fig. 2a). The release of SQSTM1 also produced an increase in phosphorylation at Ser403 (Fig. 1b). When unmutated (WT) Sqstm1 was transfected into Sqstm1-knockdown BMDMs, the SQSTM1 protein was readily released in response to LPS. S403A mutant Sqstm1 failed to be released in these conditions (Fig. 2b), indicating that LPS-induced SQSTM1 phosphorylation at Ser403 is required for its secretion.
Fig. 2. TMEM173-dependent TBK1 activation mediates SQSTM1 phosphorylation, expression, and secretion.
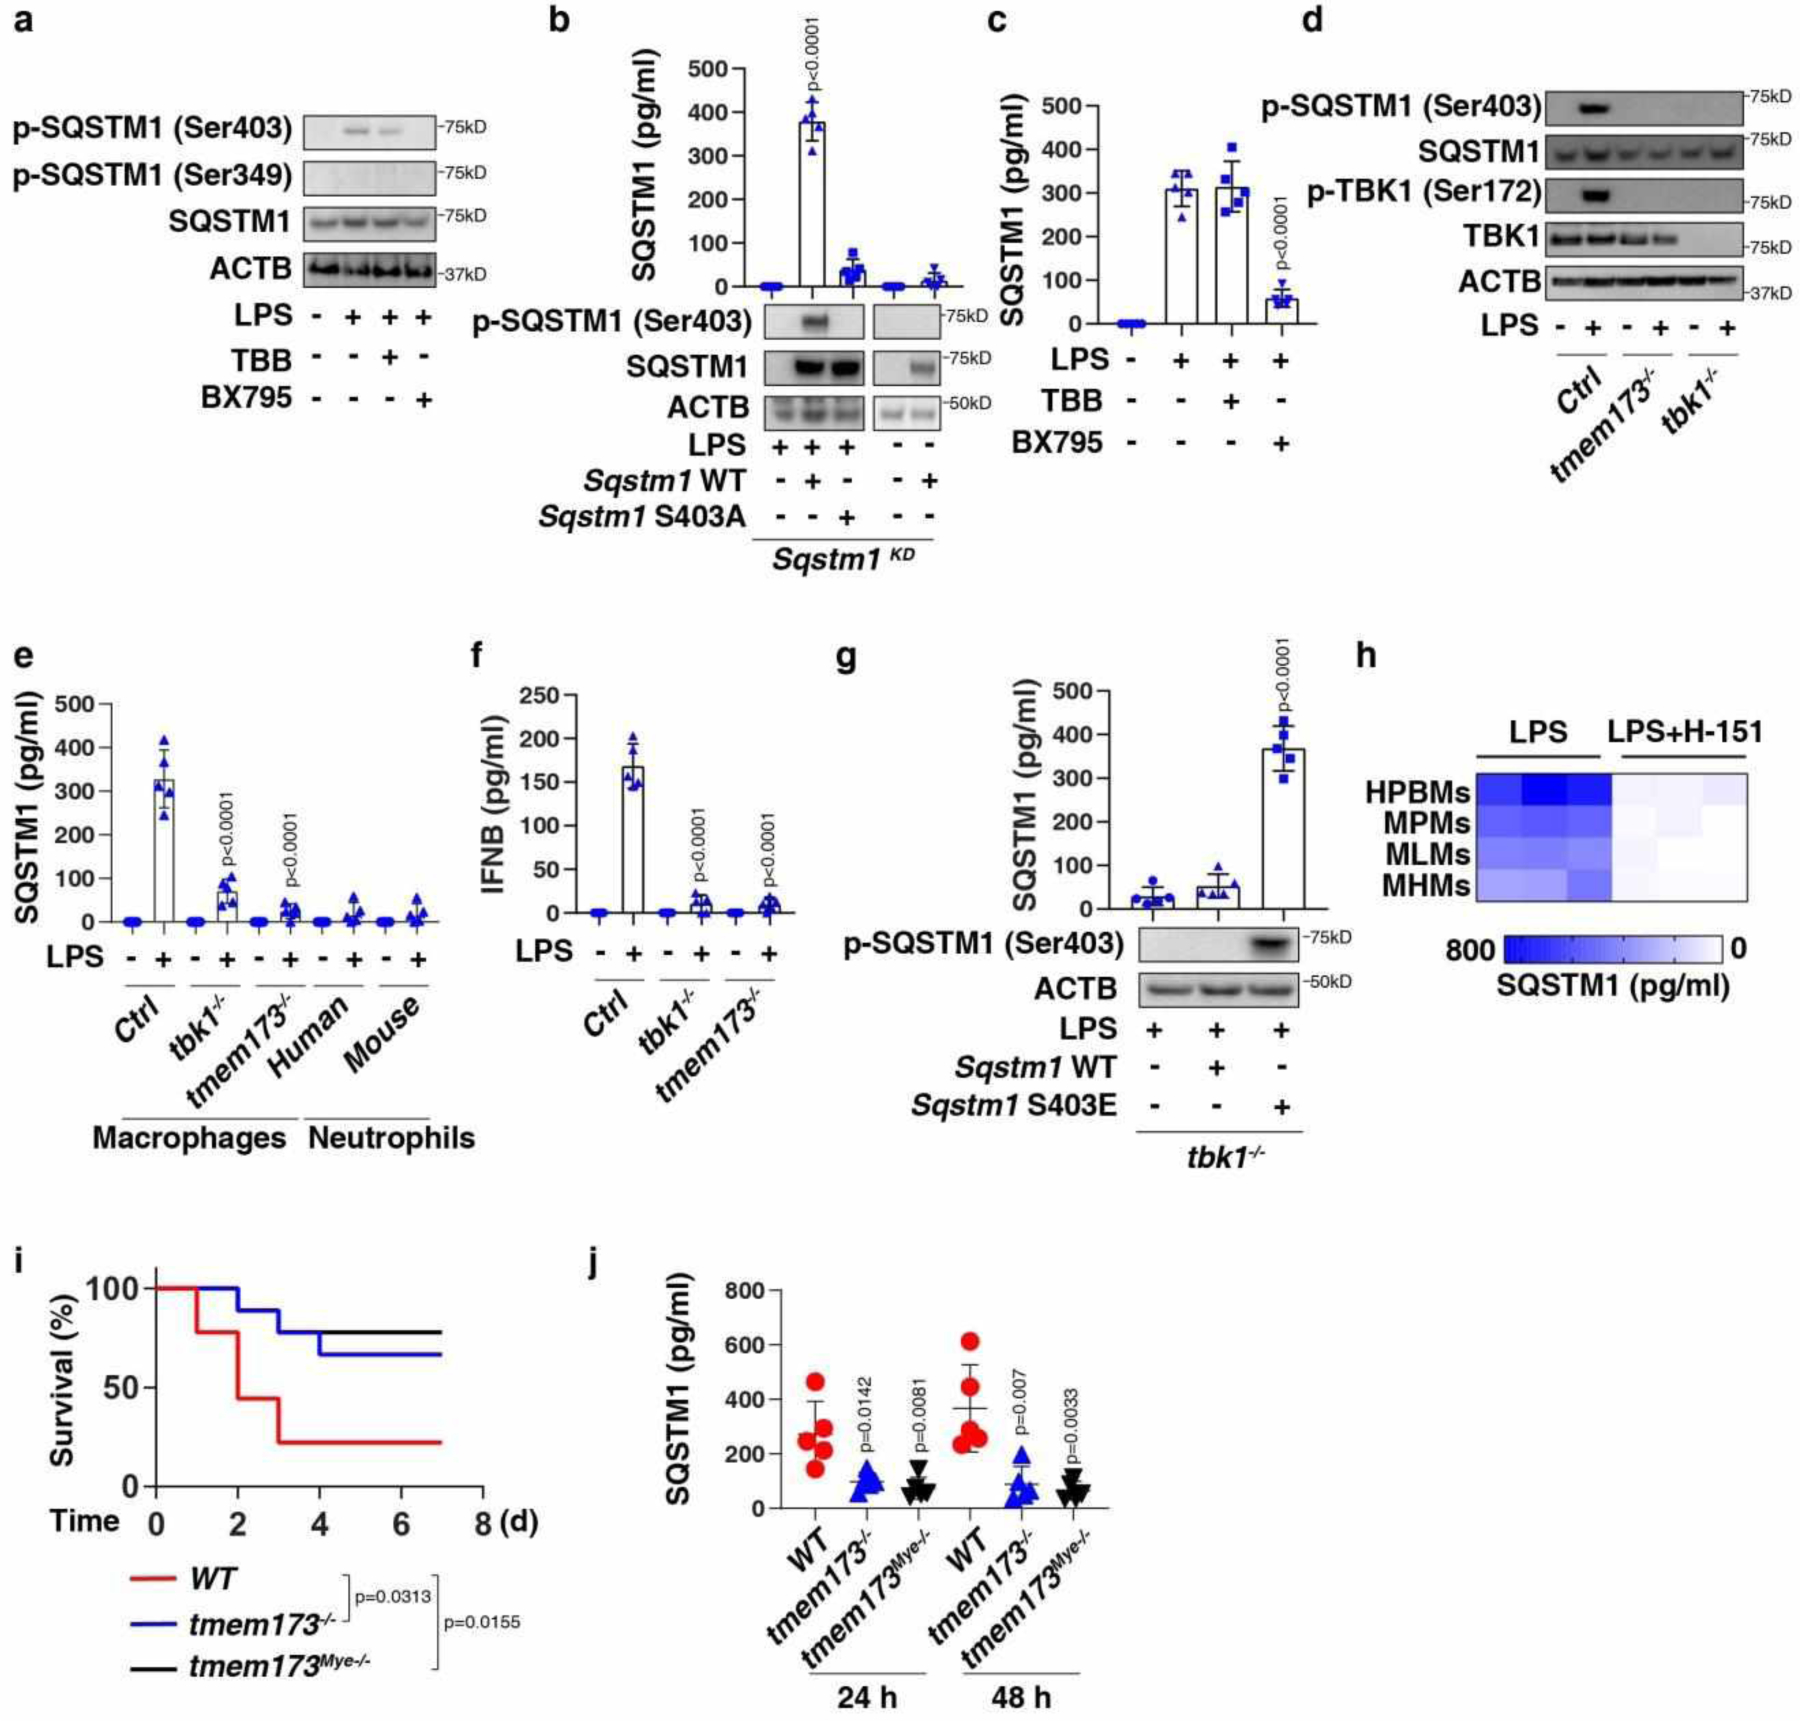
(a) Western blot analysis of protein expression in BMDMs following treatment with LPS (200 ng/ml) in the absence or presence of TBB (5 μM) and BX795 (5 μM) for 24 h. (b) ELISA analysis of SQSTM1 release in the indicated BMDMs following treatment with LPS (200 ng/ml) for 24 h (n = 5 well/group; two-tailed t test, versus control group). (c) ELISA analysis of SQSTM1 release in BMDMs following treatment with LPS (200 ng/ml) in the absence or presence of TBB (5 μM) and BX795 (5 μM) for 24 h (n = 5 well/group; two-tailed t test, versus LPS-alone group). (d) Western blot analysis of protein expression in the indicated RAW264.7 cells following treatment with LPS (200 ng/ml) for 24 h. (e) ELISA analysis of SQSTM1 release in the indicated macrophages (RAW264.7 cells) or neutrophils following treatment with LPS (200 ng/ml) for 24 h (n = 5 well/group; two-tailed t test, versus control LPS group). (f) ELISA analysis of IFNB release in the indicated RAW264.7 cells following treatment with LPS (200 ng/ml) for 3 h (n = 5 well/group; two-tailed t test, versus control LPS group). (g) ELISA analysis of SQSTM1 release in the indicated RAW264.7 cells following treatment with LPS (200 ng/ml) for 24 h (n = 5 well/group; two-tailed t test, versus control group). (h) Heatmap of SQSTM1 release in the indicated primary human or mouse macrophages following treatment with LPS (200 ng/ml) in the absence or presence of H-151 (2 μM) for 24 h. (i) Depletion of Tmem173 in mice (tmem173−/−) or in myeloid cells (tmem173Mye−/−) prevented LPS (10 mg/kg)-induced animal death (n = 9 mice/group; Log-rank test). (j) In parallel, the level of serum SQSTM1 was assayed (n = 5 mice/group; two-tailed t test, versus wild type group). Data in (b), (c), (e), (f), (g), and (j) are presented as mean ± SD. Data in (a), (d), (i), and (j) are from two independent experiments. Data in (b), (c), and (e-h) are from three independent experiments.
Ser403 on SQSTM1 is phosphorylated by casein kinase 2 (CSNKK2/CK2)28 or TANK-binding kinase 1 (TBK1)29. BX795 (a TBK1 inhibitor), but not TBB (a CSNKK2 inhibitor), inhibited LPS-induced expression (Fig. 2a), phosphorylation (Fig. 2a), and secretion (Fig. 2c) of SQSTM1. Tbk1 depletion also blocked the LPS-induced expression (Fig. 2d), phosphorylation (Fig. 2d), and secretion of SQSTM1 (Fig. 2e) in RAW 264.7 cells. Consistent with previous studies30, Tbk1 depletion inhibited LPS-induced interferon beta (IFNB) secretion (Fig. 2f). TBK1 depletion also inhibited the release of extopically overexpressed WT Sqstm1 (but not Sqstm1 phospho-mimicking mutant S403E) in RAW264.7 cells following LPS treatment (Fig. 2g), indicating that TBK1-mediated SQSTM1 phosphorylation is important for subsequent SQSTM1 secretion.
Transmembrane protein 173 (TMEM173/STING) is an important regulator of lethal inflammation31–34. In Tmem173-deficient macrophages, LPS failed to elicit TBK1 phosphorylation (Fig. 2d), SQSTM1 expression (Fig. 2d), SQSTM1 phosphorylation (Fig. 2d), SQSTM1 secretion (Fig. 2e), and IFNB secretion (Fig. 2f). The knockout of Tbk1 or Tmem173 also suppressed LPS-induced Sqstm1 mRNA expression in macrophages (Extended Data Fig. 1d). LPS failed to trigger SQSTM1 release in primary neutrophils (Fig. 2e) that express extremely low levels of TMEM17335. H-151, an inhibitor of TMEM173, blocked LPS-induced SQSTM1 secretion in macrophages (Fig. 2h). Consistent with previous studies31,33, tmem173−/− mice or mice with the deletion of Tmem173 in myeloid cells (termed tmem173Mye−/− mice) were resistant to the lethal effects of endotoxemia (Fig. 2i). Circulating levels of SQSTM1 were downregulated during endotoxemia in tmem173−/− mice (Fig. 2j). Thus, TMEM173-dependent TBK1 activation promotes SQSTM1 expression and phosphorylation, leading to its subsequent release.
GSDMD-dependent pyroptosis induces passive release of SQSTM1
In addition to extracellular LPS-mediated TLR4 activation, cytosolic LPS is a ligand of CASP11 that triggers gasdermin D (GSDMD)-dependent pyroptotic cell death36. The knockout of Casp11 or Gsdmd abolished LPS electroporation- or Escherichia coli infection-induced cytotoxicity (Fig. 3a and Extended Data Fig. 2a) and the release of HMGB1 (Fig. 3b and Extended Data Fig. 2a) or SQSTM1 (Fig. 3c and Extended Data Fig. 2a). However, the knockdown of Mcoln1 or Tbk1 failed to inhibit these processes (Fig. 3a–3c), indicating that TBK1-mediated SQSTM1 phosphorylation and MCOLN1-dependent lysosome exocytosis are only required for the active secretion of SQSTM1 in macrophages.
Fig. 3. Activation of the GSDMD-dependent pyroptosis pathway induces passive release of SQSTM1.
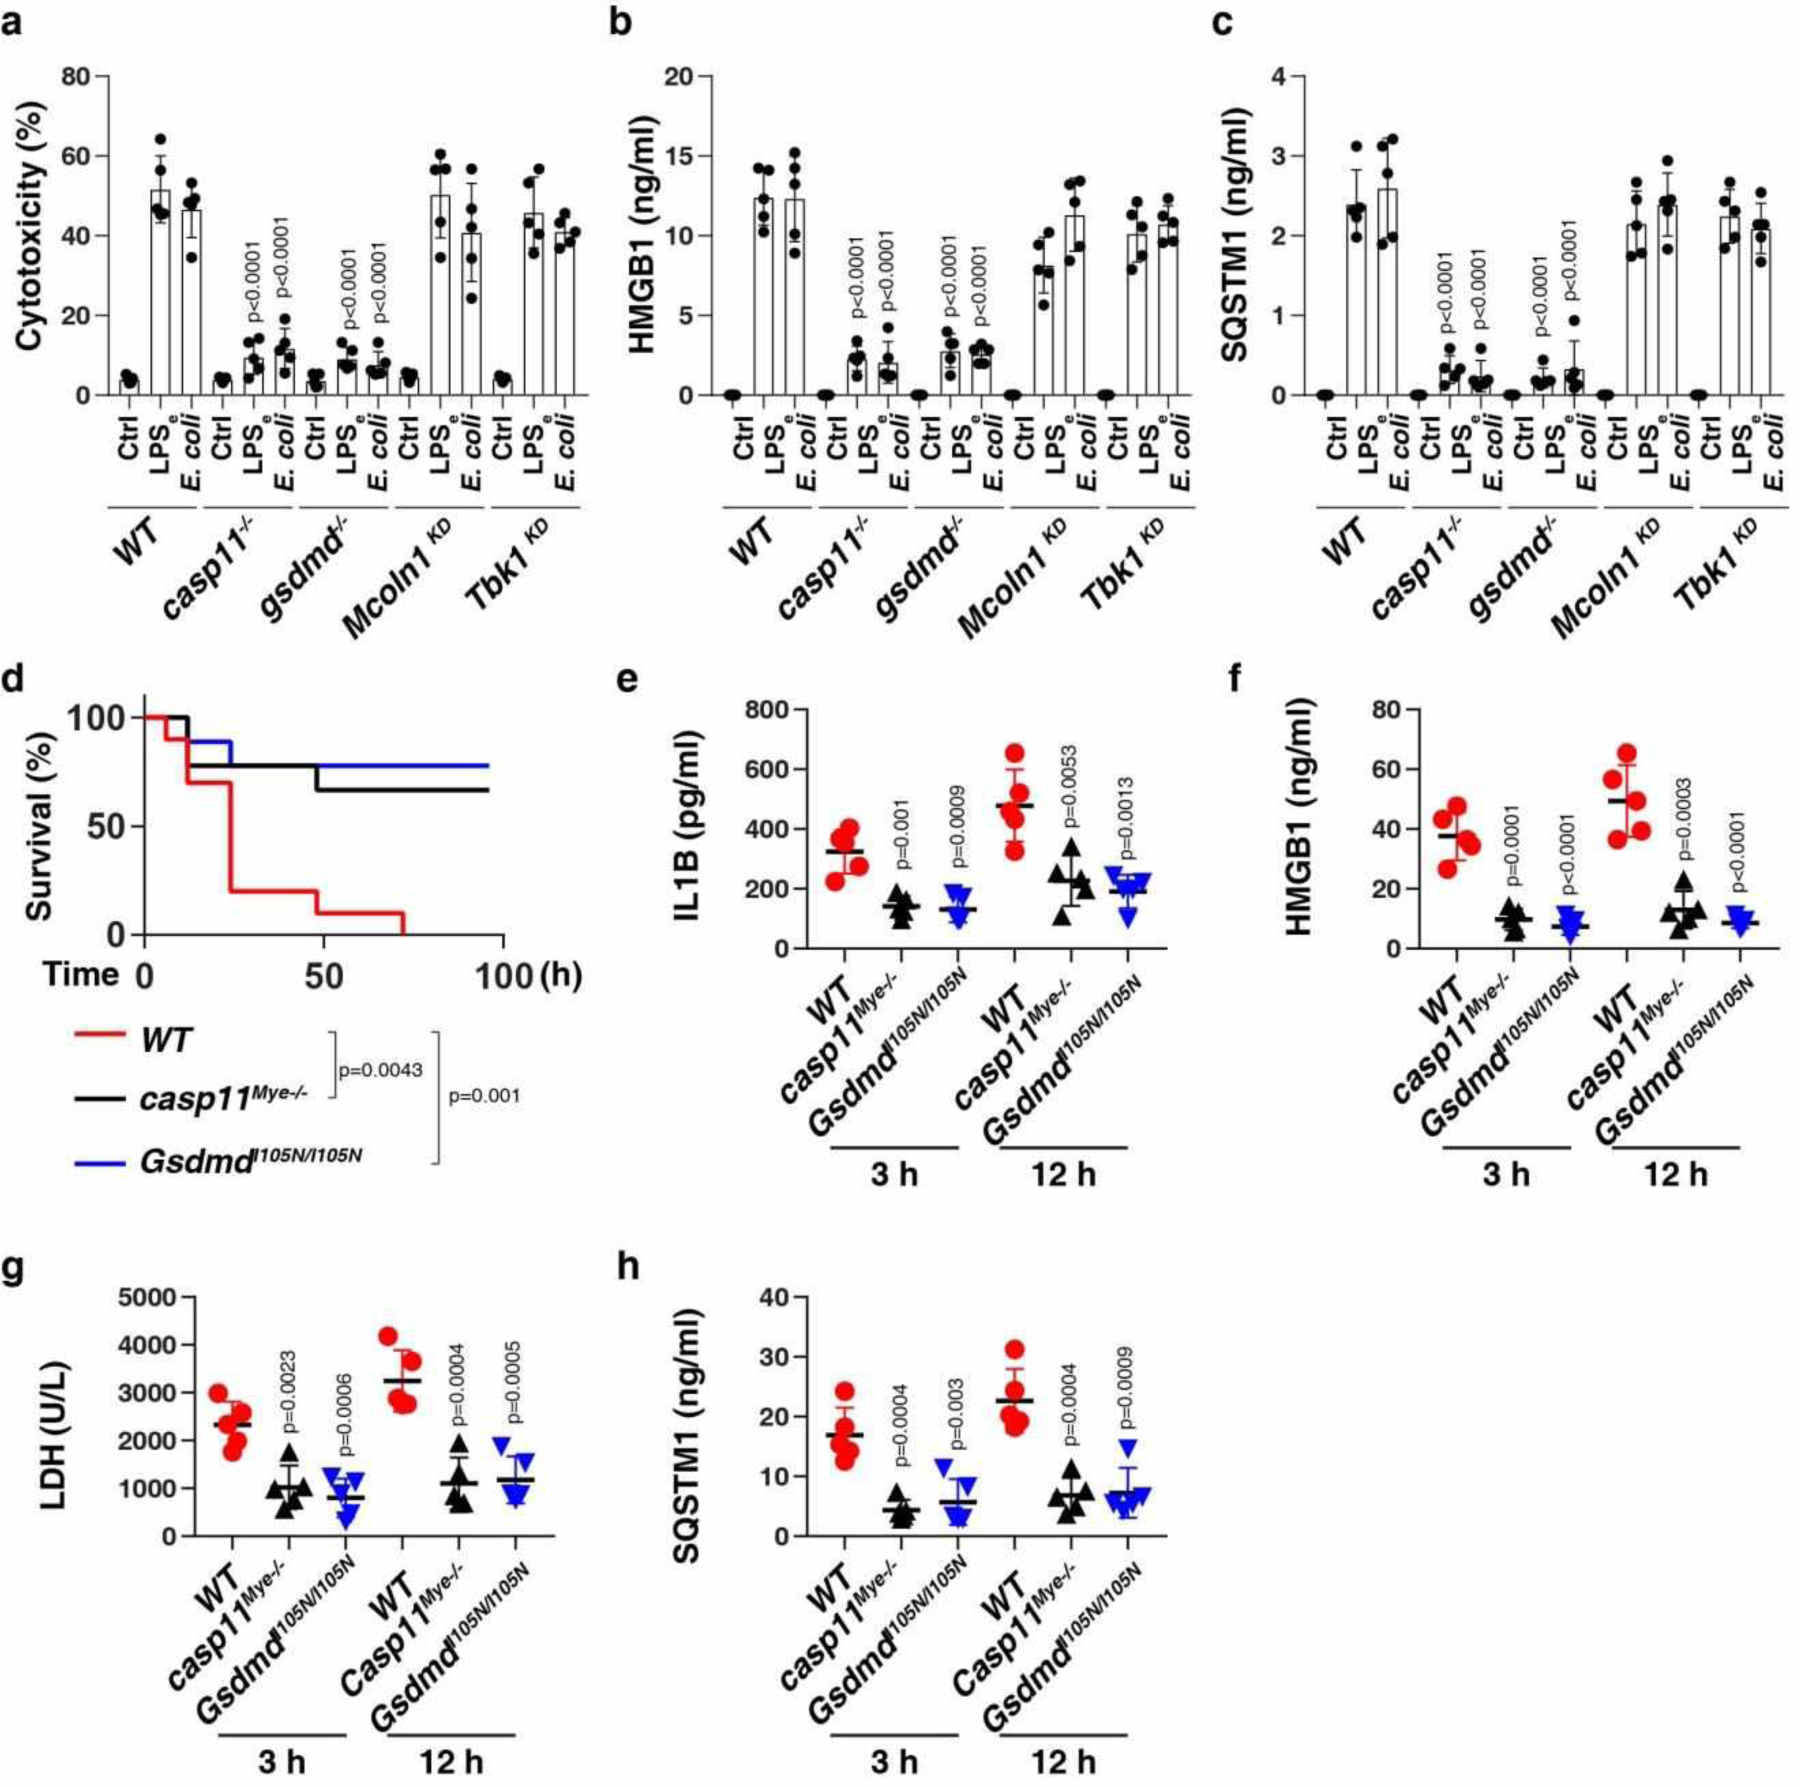
(a-c) Analysis of cytotoxicity (a), HMGB1 release (b), and SQSTM1 release (c) in the indicated LPS-primed BMDMs following LPS electroporation (LPSe) or E. coli (MOI = 25) infection for 24 h (n = 5 well/group; two-tailed t test, versus wild type group). (d) Survival of the indicated mice primed with poly (I:C) (10 mg/kg, i.p.) and then challenged 6 h later with LPS (2 mg/kg, i.p.; n = 10 mice/group; Log-rank test). (e-h) In parallel, the serum level of IL1B (e), HMGB1 (f), LDH (g), and SQSTM1 (h) were assayed (n = 5 mice/group; two-tailed t test, versus wild type group). Data in (a-c) and (e-h) are presented as mean ± SD. Data in (d-h) are from two independent experiments. Data in (a-c) are from three independent experiments.
Consistent with the in vitro data (Fig. 3c), myeloid cell-specific casp11-knockout mice (casp11Mye −/−) or GsdmdI105N/I105N mice (which harbor a GSDMD mutant) were resistant against LPS-induced death (Fig. 3d), and exhibited lower circulating levels of IL1B (Fig. 3e), HMGB1 (Fig. 3f), LDH (Fig. 3g), and SQSTM1 (Fig. 3h) than WT control mice. Thus, the CASP11-GSDMD pathway is required for LPS-induced SQSTM1 release in vivo.
Adenosine triphosphate (ATP) and nigericin, which are NLRP3 inflammasome activators, induced cell death coupled to the release of HMGB1 and SQSTM1 in LPS-primed WT or casp11−/− BMDMs, but not in nlrp3−/− or casp1−/− casp11−/− or gsdmd−/− BMDMs (Extended Data Fig. 2b). This analysis revealed that the CASP1-GSDMD pathway mediates NLRP3 ligand-induced SQSTM1 release. Y. pestis infection- or LPS5Z7 (LPS+5Z-7-oxozeaenol)-induced CASP8 activation causes cell death through inducing GSDMD cleavage to elicit inflammasome-independent pyroptosis37,38. Yersinia infection or LPS5Z7 also resulted in cell death, HMGB1 release, and SQSTM1 release in casp11−/− or casp1−/− casp11−/− BMDMs, but not in gsdmd−/− or Casp8-knockdown BMDMs (Extended Data Fig. 2c). Thus, SQSTM1 is a DAMP during GSDMD-dependent pyroptotic cell death.
Extracellular SQSTM1 promotes metabolic programming and macrophage polarization
We focused on the effects of extracellular SQSTM1 on metabolic reprogramming because hyperlactatemia is a diagnostic biomarker in patients with septic shock1. We monitored the extracellular acidification rate (ECAR, an indicator of glycolysis and lactate production) and oxygen consumption rate (OCR, an indicator of oxidative phosphorylation) in cells cultured in the absence or presence of human recombinant SQSTM1 protein (rSQSTM1) (Fig. 4a). THP1-derived macrophages (TMs) exhibited increased ECAR (Fig. 4b) and decreased OCR in response to rSQSTM1 compared to untreated cells (Fig. 4c). Consistently, rSQSTM1 (but not heat-inactivated rSQSTM1) induced glucose uptake and lactate production in TMs (Fig. 4d and 4e) or primary macrophages (Extended Data Fig. 3a and 3b).
Fig. 4. Exogenous SQSTM1 promotes metabolic programming and macrophage polarization.
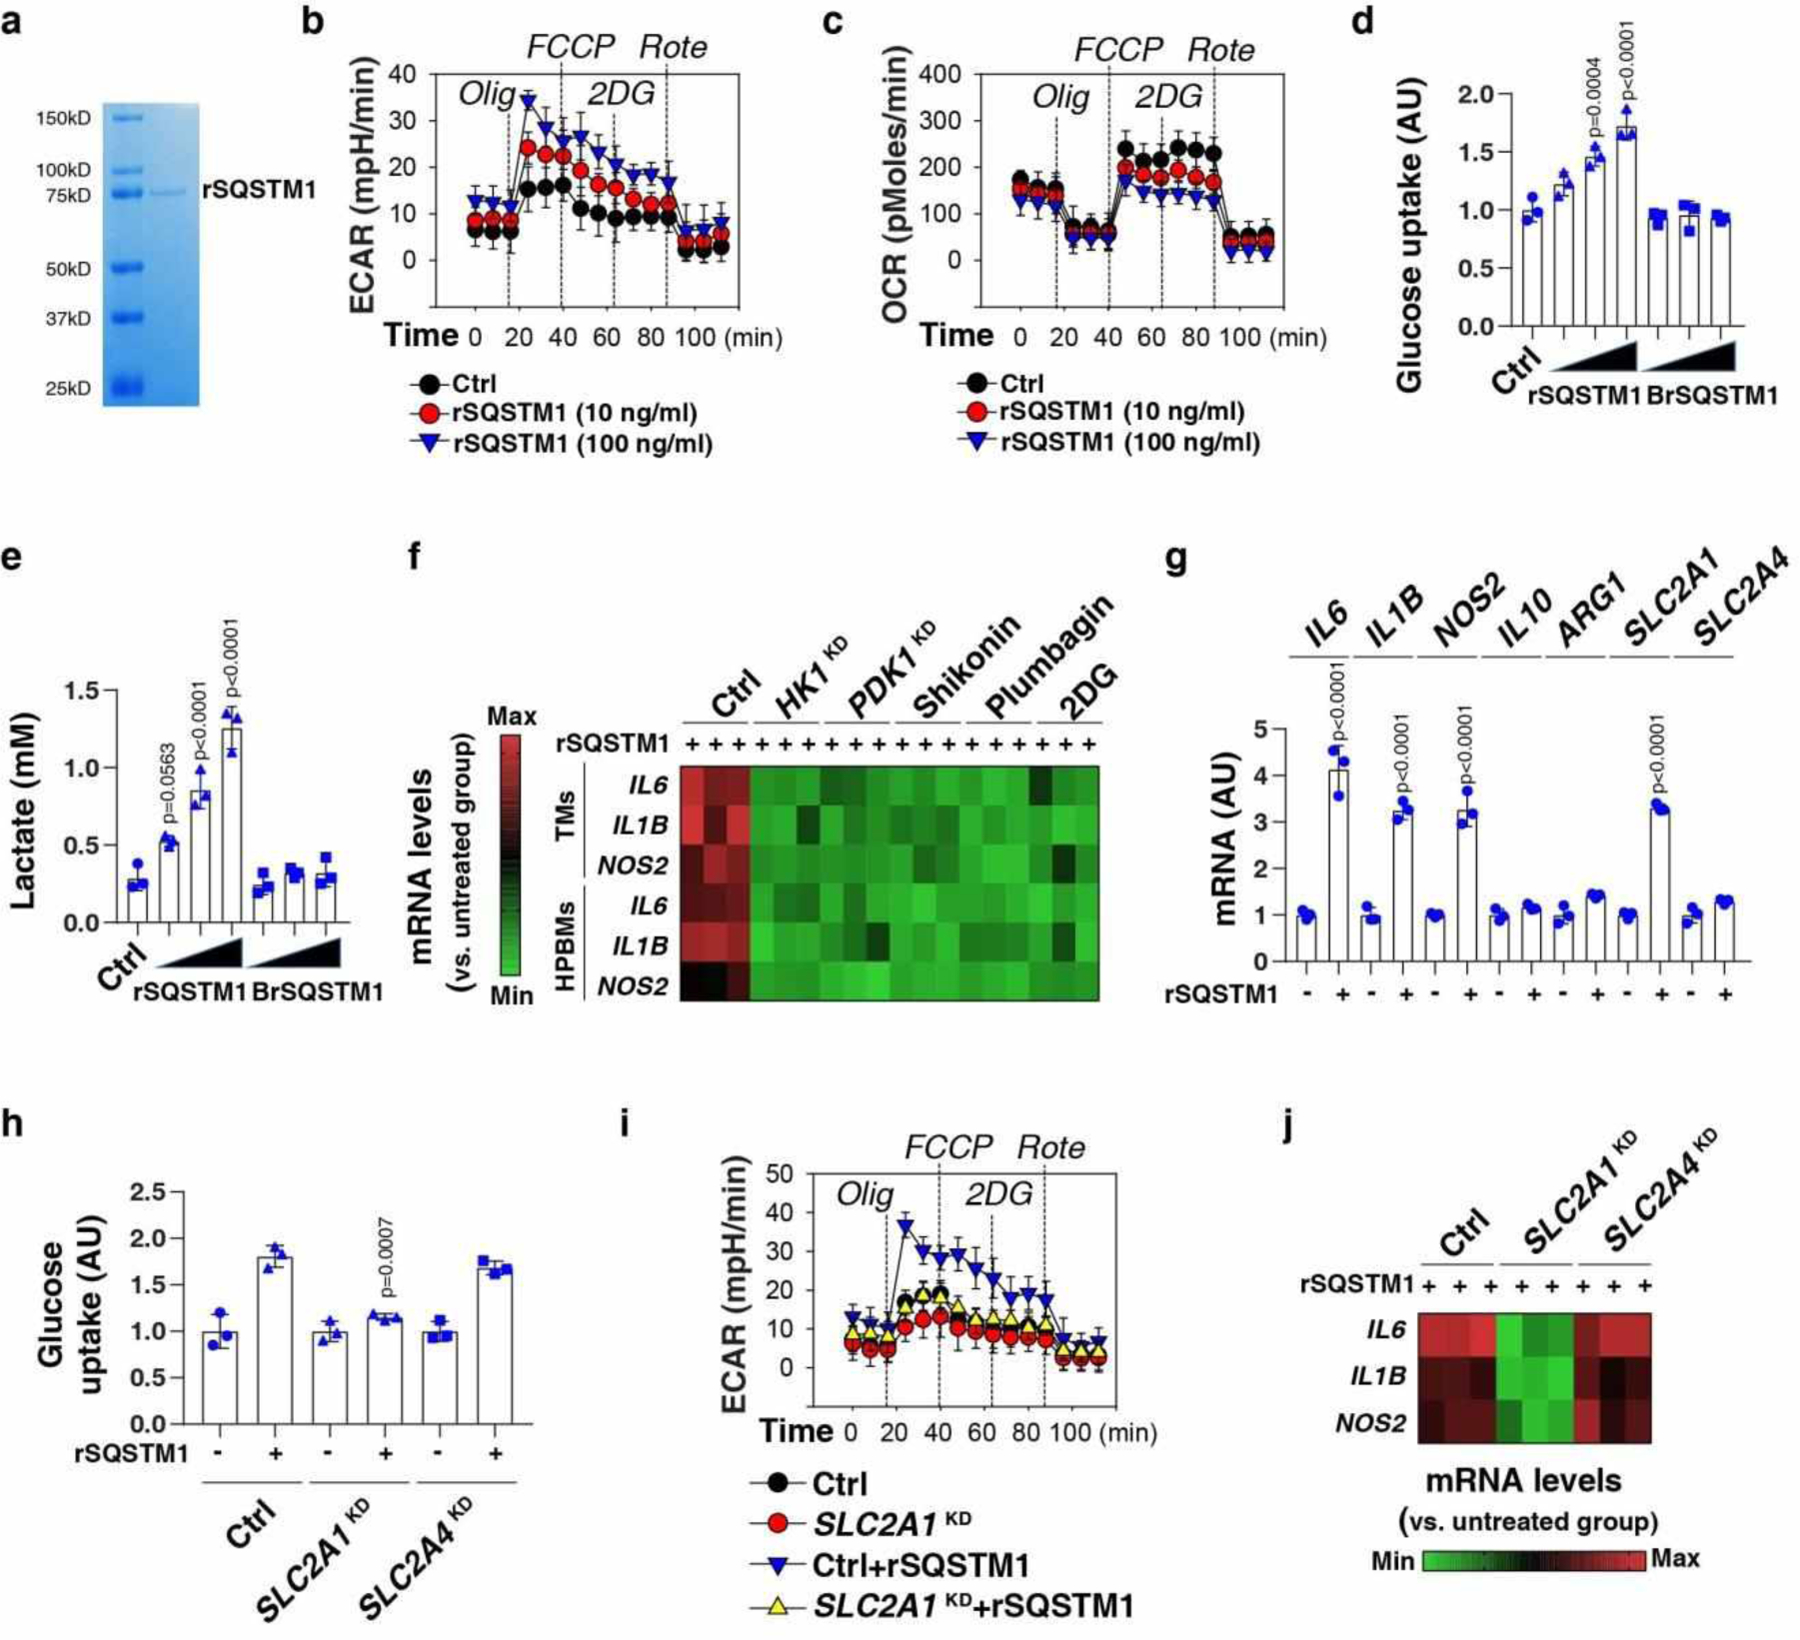
(a) Coomassie blue staining of the rSQSTM1 protein. (b, c) THP1-derived macrophages (TMs) were stimulated with rSQSTM1 (10 and 100 ng/ml) for 24 h and sequentially treated as indicated with oligomycin (“Olig,” 1 uM), p-trifluoromethoxy carbonyl cyanide phenyl hydrazone (“FCCP,” 0.3 uM), 2-deoxyglucose (“2DG,” 100 mM), and rotenone (“Rote,” 1 uM). Extracellular acidification rates (ECAR) indicative of glycolysis (b), and oxygen consumption rates (OCR) indicative of OXPHOS (c) were monitored using the Seahorse Bioscience Extracellular Flux Analyzer in real time. (d, e) TMs were stimulated with rSQSTM1 (10, 100, and 1000 ng/ml) or boiled rSQSTM1 (BrSQSTM1) for 24 h. The glucose uptake (d) and lactate production (e) were assayed (n = 3 well/group; one-way ANOVA test, versus control group). AU, arbitrary units. (f) Heatmap of gene mRNA changes in indicated TMs or primary HPBMs after rSQSTM1 (100 ng/ml) stimulation for 24 h with or without pharmacological (shikonin [5 μM], plumbagin [3 μM], and 2DG [2 mM]) or genetic inhibition (HK1KD or PDK1KD) of glycolysis. (g) qPCR analysis of indicated gene expression in TMs after rSQSTM1 (100 ng/ml) stimulation for 5 days (n = 3 well/group; two-tailed t test, versus untreated group). (h-j) Indicated TMs (control, SLC2A1KD or SLC2A4KD) were stimulated with rSQSTM1 (100 ng/ml) for 24 h. The glucose uptake (h), ECAR (i), and gene mRNA expression (j) were assayed (n = 3 well/group; two-tailed t test, versus control rSQSTM1 group). AU, arbitrary units. Data in (b-e) and (g-i) are presented as mean ± SD. Data in (a-c) and (i-j) are from two independent experiments. Data in (d-h) are from three independent experiments.
M1 macrophages have a pro-inflammatory effect, while M2 macrophages have an anti-inflammatory effect. The expression of M1 markers (e.g., IL6, IL1B, and NOS2/inos [nitric oxide synthase 2]) (Fig. 4f), but not M2 markers (IL10 and ARG1 [arginase 1]) (Extended Data Fig. 3c), were upregulated by rSQSTM1 treatment for 24 h in TMs or HPBMs. As a positive control, the M2 stimulus IL4 increased mRNA expression of IL10 and ARG1 (Extended Data Fig. 3c). The knockdown of glycolytic enzyme (e.g., HK1 [hexokinase 1] and PDK1 [pyruvate dehydrogenase kinase 1]) or using glycolysis inhibitors (e.g., shikonin, plumbagin, and deoxy-D-glucose [2DG]) impaired rSQSTM1-induced M1 polarization (Fig. 4f). Long-term exposure to rSQSTM1 for 5 days also upregulated the mRNA expression of IL6, IL1B, and NOS2 (but not IL10 and ARG1) in TMs (Fig. 4g), indicating that the impact of rSQSTM1 on pro-inflammatory expression is persistent. Solute carrier family 2 member 1 (SLC2A1/GLUT1) and solute carrier family 2 member 4 (SLC2A4/GLUT4) are glucose transports in monocytes and macrophages39. rSQSTM1-treated TMs expressed high levels of SLC2A1, but not SLC2A4 (Fig. 4g). The knockdown of SLC2A1, but not SLC2A4, limited rSQSTM1-induced glucose uptake (Fig. 4h), ECAR (Fig. 4i), and mRNA expression of IL6, IL1B, and NOS2 (Fig. 4j) in TMs. Together, exogenous SQSTM1 may trigger macrophage M1 polarization by enhancing SLC2A1-mediated glucose uptake and subsequent glycolysis.
INSR is the major receptor for the immunometabolic activity of SQSTM1
To determine which TLR might recognize SQSTM1, we suppressed each TLR (encoded by TLR1 to TLR9) by siRNAs in THP1-Lucia NFKB cells. Whereas the positive and negative controls confirmed the functionality of the assay, the knockdown of none of the TLR genes prevented rSQSTM1-mediated stimulation of NFKB activity (Extended Data Fig. 4). These findings indicate that TLR1 to TLR9 are not involved in the recognition of extracellular SQSTM1.
Receptor tyrosine kinases (RTKs) are cell surface receptors for a large range of growth factors, cytokines, and hormones during inflammation and immunity40,41. Out of 49 RTKs tested, only the phosphorylation of insulin receptor (INSR) was time-dependently upregulated in TMs by rSQSTM1 (Fig. 5a). rSQSTM1 induced the phosphorylation of INSR at Tyr1150/1151 in TMs (Fig. 5b). A GST affinity-isolation assay further demonstrated a direct interaction between INSR and SQSTM1 in vitro (Fig. 5c), although more experimental evidence is needed to confirm this interaction. The knockdown of INSR blocked rSQSTM1-induced NFKB activation (Fig. 5d) and lactate production (Fig. 5e), as well as the expression of M1 markers (Fig. 5f) in TMs. Consistent with this notion that NFKB signaling contributes to glycolysis and M1 polarization in response to inflammatory stimuli42,43, the knockdown of the NFKB subunit-encoding gene RELA/p65 by two specific shRNAs inhibited rSQSTM1-induced NFKB activation (Fig. 5d), lactate production (Fig. 5e), and the expression of IL6, IL1B, NOS2, and SLC2A1 (Fig. 5f) in TMs. Like the knockdown of SLC2A1, the knockdown of RELA also inhibited rSQSTM1-induced glucose uptake (Fig. 5g) and ECAR (Fig. 5h). Pretreatment with anti-INSR antibodies blocked the activity of rSQSTM1 (Fig. 5d–5f), supporting the notion that SQSTM1 binds extracellular INSR to activate macrophages.
Fig. 5. INSR is the major receptor for the immunometabolic activity of SQSTM1.

(a) Heatmap of RTK phosphorylation in THP1-derived macrophages (TMs) after rSQSTM1 (100 ng/ml) stimulation for 1–24 h. (b) Western blot analysis of protein expression in TMs following treatment with rSQSTM1 (100 ng/ml) for 1–24 h. (c) GST affinity isolation analysis of the binding of SQSTM1 to INSR. (d-f) Analysis of NFKB activity (d), lactate production (e), and mRNA expression (f) in the indicated TMs following treatment with rSQSTM1 (100 ng/ml) in the absence or presence of IgG or anti-INSR monoclonal antibodies (10 μg/ml) for 24 h (n = 3 well/group; two-tailed t test, versus control rSQSTM1 group). (g-h) Indicated TMs (control or RELAKD) were stimulated with rSQSTM1 (100 ng/ml) for 24 h. The glucose uptake (g) and ECAR (h) were assayed (n = 3 well/group; two-tailed t test, versus control rSQSTM1 group). AU, arbitrary units. Data in (d), (e), (g), and (h) are presented as mean ± SD. Data in (a) is from one independent experiment. Data in (b-c) and (h) are from two independent experiments. Data in (d-g) are from three independent experiments.
To further investigate the mechanisms responsible for INSR-mediated NFKB activation, we assayed the phosphorylation of stress-associated kinases. Among 43 different kinases and 2 related proteins, the phosphorylation of phospholipase C gamma 1 (PLCG1) at Tyr783 and protein tyrosine kinase 2 beta (PTK2B/PYK2) at Tyr402 were upregulated by rSQSTM1 in WT, but not in INSR-deficient cells (Extended Data Fig. 5a). The knockdown of PTK2B inhibited rSQSTM1-induced PLCG1 phosphorylation (Extended Data Fig. 5b), indicating that PLCG1 acts downstream of PTK2B. Furthermore, the knockdown of either PLCG1 or PTK2B diminished rSQSTM1-induced NFKB activation (Fig. 5d), lactate production (Fig. 5e) and the expression of IL6, IL1B, NOS2 and SLC2A1 (Fig. 5f). In contrast, insulin-induced glucose uptake required SLC2A4, but not SLC2A1 (Extended Data Fig. 5c). Insulin failed to induce phosphorylation of PLCG1 and PTK2B (Extended Data Fig. 5d), and NFKB activation (Extended Data Fig. 5e). As a positive control, insulin induced the phosphorylation of AKT, GSK3β, and ERK1/2 in TMs (Extended Data Fig. 5d). Of note, rSQSTM1, but not insulin, induced an interaction between INSR and PTK2B in the plasma membrane of TMs (Extended Data Fig. 5f). There was not a direct interaction between RTK2B and PLCG1 in TMs in response to rSQSTM1 (Extended Data Fig. 5f). The knockdown of either INSR or RTK2B inhibited rSQSTM1-induced interaction between PLCG1 and NFKB subunit RELA in TMs (Extended Data Fig. 5g). Thus, the SQSTM1-INSR axis (but not the insulin-INSR axis)-mediated NFKB activation occurs in a PLCG1- and PTK2B-dependent manner in macrophages.
Unlike in TMs, rSQSTM1 failed to induce lactate production and IL6 mRNA expression in human mammary epithelial cells (HMECs) and HepG2 (a human hepatocyte cell line) cells (Extended Data Fig. 5h). Skeletal muscle cells (SMCs) exhibited a mild increase in lactate production and IL6 mRNA expression (Extended Data Fig. 5h). These findings suggest that extracellular SQSTM1 may play a major role in the activation of macrophages.
The SQSTM1-INSR axis mediates sepsis and septic shock in mice
Next, we evaluated the effect of anti-SQSTM1 monoclonal antibodies (mAbs) on polymicrobial sepsis induced by the cecal ligation and puncture (CLP). The neutralizing effect of SQSTM1 mAbs on the activity of rSQSTM1-induced lactate production was confirmed in vitro (Fig. 6a). SQSTM1 mAbs protected against CLP-induced lethality (Fig. 6b) and tissue injury (Fig. 6c–f). Moreover, SQSTM1 mAb administration significantly reduced circulating levels of IL6, IL1B, TNF, HMGB1, LDH, and lactate (Extended Data Fig. 6). Similar results were also obtained in an endotoxemia model (Extended Data Fig. 7).
Fig. 6. The SQSTM1-INSR pathway mediates CLP-induced polymicrobial sepsis.
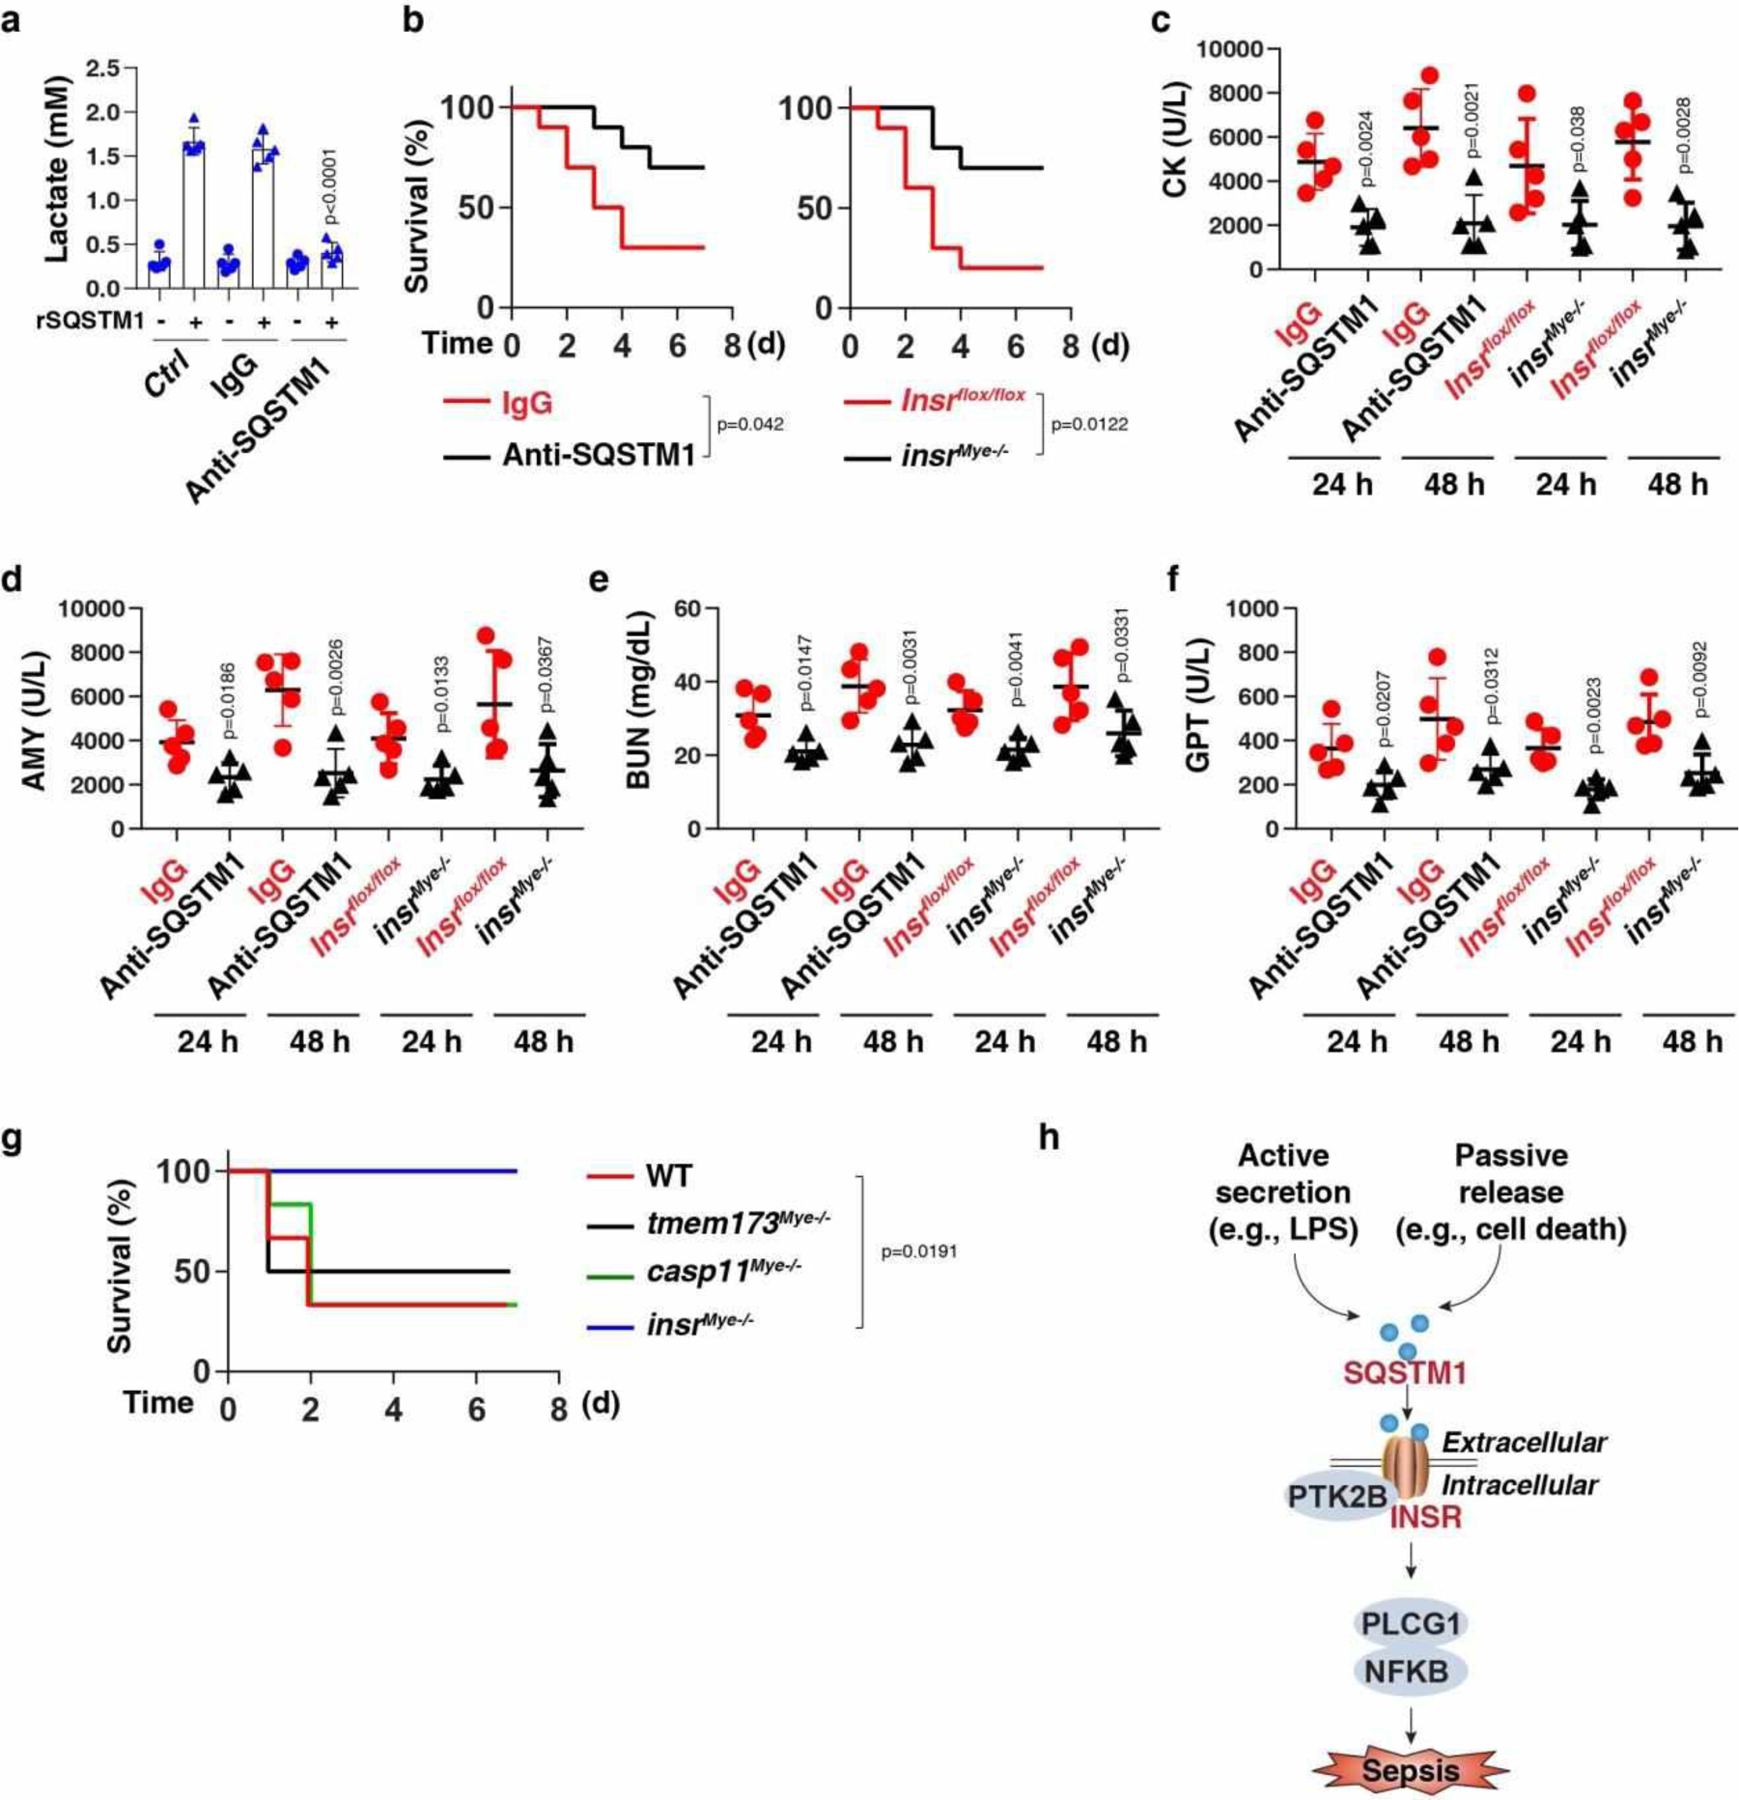
(a) THP1-derived macrophages (TMs) were stimulated with rSQSTM1 (100 ng/ml) in the absence or presence of IgG or anti-SQSTM1 monoclonal antibodies (10 μg/ml) for 24 h, and then the level of intracellular lactate was assayed (n = 5 well/group; two-tailed t test, versus control rSQSTM1 group). (b) Administration of anti-SQSTM1 monoclonal antibodies (20 mg/kg) or depletion of INSR in myeloid cells in mice prevented CLP-induced animal death (n = 10 mice/group; Log-rank test). (c-f) In parallel, the serum level of creatine kinase (CK), amylase (AMY), blood urea nitrogen (BUN), and glutamic pyruvic transaminase, soluble (GPT) were assayed (n = 5 mice/group; two-tailed t test, versus control group). (g) Survival of the indicated mice after administration of rSQSTM1 (500 μg per mouse, i.p., n = 6 mice/group; Log-rank test). (h) Schematic summary of the role of extracellular SQSTM1 in the regulation of sepsis via the activation of the INSR-dependent NFKB pathway. Data in (a) and (c-f) are presented as mean ± SD. Data in (g) is from one independent experiment. Data in (a-f) are from three independent experiments.
To evaluate the role of INSR in vivo, we generated myeloid cell-specific insr-knockout mice (termed insrMye−/− mice). The conditional knockout of Insr in myeloid cells reduced the lethality of both polymicrobial sepsis (Fig. 6a) and endotoxemia (Extended Data Fig. 7a), an effect that was associated with an attenuated tissue dysfunction (Fig. 6b–6e and Extended Data Fig. 7b–7e), reduced proinflammatory cytokine release (Extended Data Fig. 6a–6c and 7f–7h), diminished DAMP release (Extended Data Fig. 6d–6e and 7i–7j), and avoidance of hyperlactatemia (Extended Data Fig. 6f and 7k). SQSTM1 mAbs conferred further protection to insrMye−/− mice in response to CLP-induced sepsis, indicating that SQSTM1 and INSR may have some non-overlapping functions in septic death (Fig. S6G).
To determine if rSQSTM1 can induce septic shock, we administered mouse rSQSTM1 into WT, insrMye−/−, casp11Mye −/−, or tmem173Mye−/− mice. Within 2–4 hours, the mice developed signs of sepsis, such as lethargy and piloerection. 50%−67% mice died within 48 hours after rSQSTM1 administration in WT, casp11Mye −/−, and tmem173Mye−/− mice (Fig. 6g). In contrast, rSQSTM1-induced lethality was not observed in insrMye−/− mice (Fig. 6g). These findings indicate that myeloid INSR is responsible for rSQSTM1-induced septic shock in mice.
Additionally, SQSTM1 mAb administration or depletion of Insr in myeloid cells protected against septic death when mice were infected intraperitoneally with Escherichia coli or Streptococcus pneumoniae, the leading causes of human septic death by Gram-negative or Gram-positive bacterial infection, respectively (Extended Data Fig. 8a and 8b). Blocking the SQSTM1-INSR pathway also protected against septic death in an clinically relevant sepsis model with administering lactated Ringer’s solution and antibiotics (imipenem and cilastatin) (Extended Data Fig. 8c).
Inflammation-induced immunosuppression from T-cell death or dysfunction at a late stage is frequently associated with sepsis-related deaths in patients44. The inhibition of the SQSTM1-INSR pathway reduced apoptosis (Extended Data Fig. 8d) and immunosuppressive checkpoint programmed cell death 1 (PDCD1/PD1) expression (Extended Data Fig. 8e) in CD4+ and CD8+ T cells of mice 72 h after bacterial sepsis (Escherichia coli, Streptococcus pneumoniae, and CLP).
Disseminated intravascular coagulation (DIC) is a hallmark of sepsis involving the systemic activation of the fibrinolytic and coagulation pathways2. The platelet count and fibrinogen concentration were reduced, whereas prothrombin time (PT), activated partial thromboplastin time (APTT), and D-dimer were elevated during bacterial sepsis (Escherichia coli, Streptococcus pneumoniae, and CLP) in WT mice compared to insrMye−/− mice or WT mice treated with SQSTM1 mAbs (Extended Data Fig. 9). Similar to insrMye−/− mice, sqstm1Mye−/− mice were resistant to Escherichia coli-, Streptococcus pneumoniae-, and CLP-induced septic death (Extended Data Fig. 6h–j). Together, these findings indicate that the activation of the SQSTM1-INSR axis mediates the pathophysiology of sepsis and septic shock in mice.
The SQSTM1-INSR axis is associated with the severity of sepsis in patients
We focused on a cohort of 40 patients with bacterial sepsis (Table S2). As expected, the Sequential Organ Failure Assessment (SOFA) score in the nonsurvivor group was higher than in the survivor group (Table S2). The DIC score based on laboratory analyses of platelet counts, prothrombin time-international normalized ratio (PT-INR), D-dimer, and fibrinogen in the nonsurvivor group was also higher than in the survivor group (Table S2). Compared with the survivor group, blood samples from the nonsurvivor group contained elevated levels of mRNAs coding for SQSTM1 and INSR in PBMCs as well as soluble SQSTM1 protein and lactate in the plasma (Table S2). The SOFA and DIC scores significantly correlated with the concentration of circulating SQSTM1 (Extended Data Fig. 10a and 10b) and the mRNA expression levels of SQSTM1 (Extended Data Fig. 10c and 10d) and INSR (Extended Data Fig. 10e and 10f). There was a significant positive correlation between SQSTM1, INSR, and PDCD1 mRNA expression and plasma immune mediator levels (TNF, IL6, IL1A, IL1B, and HMGB1) (Extended Data Fig. 10g). These findings further support a role for the SQSTM1-INSR pathway in human sepsis and critical illness linking coagulation, inflammation, and immunosuppression.
DISCUSSION
In this study, we identified extracellular SQSTM1 as a key immune mediator of septic death that acts via the INSR pathway (Fig. 6h). SQSTM1 is a stress response protein that is upregulated by inflammatory stimuli, oxidative injury, toxic heavy metals, and proteotoxic challenges45,46. We show here that LPS-induced SQSTM1 release from macrophages or monocytes occurs through active secretion (in response to TLR4 stimulation) or passive mechanisms (in the context of pyroptosis). The excessive activation of the SQSTM1-INSR pathway in patients with sepsis is associated with systemic coagulation abnormalities and immune dysfunction, which are important drivers of organ injury and death.
Our study highlights the unconventional pathway required for activated macrophages to secrete SQSTM1. The LPS-induced phosphorylation of SQSTM1 by TBK1 promotes SQSTM1 accumulation in secretory lysosomes for its subsequent secretion into the extracellular environment. This process requires the activation of TMEM173, an endogenous activator of TBK1 that responds to various inflammatory stimuli, including LPS, bacterial cyclic dinucleotides, and host DNA damage47. TMEM173 not only regulates TLR4 signaling, but also mediates inflammasome activation and subsequent pyroptosis34,48,49. TMEM173-mediated CASP11 activation in myeloid cells is not related to type I IFN response, but depends on the calcium released from the endoplasmic reticulum34. Therefore, although they may still have unknown non-overlapping functions, depletion of Casp11 or Temem173 can protect mice from septic shock.
We provide evidence that INSR serves as a receptor for extracellular SQSTM1. INSR is widely distributed in myeloid cells and dysregulated INSR signaling is implicated in chronic inflammatory diseases, such as atherosclerosis and high-fat–induced inflammation50,51. Our work indicates that the INSR stimulation by SQSTM1 enhances LPS-induced aerobic glycolysis and the M1 polarization of macrophages through the activation of the NFKB pathway. We identified PLCG1 and PTK2B as signaling proteins responsible for rSQSTM1-induced NFKB activation. Indeed, inhibition of PLCG1 reduces systemic inflammation and septic death in mice52,53. Unlike with insulin, an rSQSTM-induced interaction between INSR and PTK2B is required for subsequent interaction between PLCG1 and RELA, which finally leads to NFKB-dependent immunometabolism in macrophages. Thus, targeting this SQSTM1-INSR axis may offer a hope for preventing and treating this life-threatening condition, although anti-cytokine therapies have been tried and failed many times in sepsis.
MATERIALS AND METHODS
Reagents
Reagents are as described in Table S1.
Cell culture and bacterial infection
The THP1 (TIB-202), RAW264.7 (TIB-71), and HepG2 (HB-8065) cell lines were obtained from the American Type Culture Collection (ATCC). The tmem173−/− (rawl-kostg), tbk1−/− (rawl-kotbk), and THP1-Lucia NFKB (thpl-nfkb) cell lines were obtained from InvivoGen. Immortalized BMDMs from WT and casp1−/− casp11−/− mice were a gift from Kate Fitzgerald. BMDMs from casp11−/−, tlr4−/−, myd88−/−, and ticam1−/− mice were obtained using 30% L929-cell conditioned medium as a source of CSF2/granulocyte/macrophage colony stimulating factor54. CRISPR/Cas9-mediated gsdmd−/− BMDMs were a kind gift from Derek Abbott. Primary HPBMs were obtained from STEMCELL Technologies (70042). Primary MHMs were obtained from ScienCell Research Laboratories (M5340–57). Primary MLMs were obtained from Cell Biologics (BALB-2313F). MPMs were isolated from C57BL/6J mice by an intraperitoneal injection of 3.0% thioglycollate medium (T9032, Sigma-Aldrich; 2 mL/mouse). Primary HMECs (PCS-600–010) and SMCs (PCS-950–010) were obtained from ATCC. Primary human or mouse neutrophils were obtained from blood using EasySep Neutrophil Isolation Kits (19666 or 19762, STEMCELL Technologies). THP1 monocytes were differentiated into macrophages (TMs) by incubation with 50 ng/ml 12-O-tetradecanoylphorbol-13-acetate for 24 h (4174, Cell Signaling Technology). All cells used were authenticated using STR profiling, and mycoplasma testing was negative.
These cells were cultured in Dulbecco’s Modified Eagle’s Medium (DMEM; 11995073, Thermo Fisher Scientific) or RPMI 1640 (11875119, Thermo Fisher Scientific) supplemented with 10% heat-inactivated fetal bovine serum (TMS-013-B, Millipore) and 1% penicillin and streptomycin (15070–063, Thermo Fisher Scientific) at 37°C, 95% humidity, and 5% CO2. For inflammasome activation, cells were primed with LPS (200 ng/ml, 6 h) or poly (I:C) (5 μg/ml, 6 h) and then stimulated with ATP (5 mM, 3 h), nigericin (10 μM, 3 h), LPS electroporation (1 μg, 24 h), E. coli (multiplicity of infection [MOI] = 25, 24 h), or Y. pestis (MOI = 25, 24 h) infection. Human SQSTM1 full-length recombinant protein with a GST tag at the N-terminal was obtained from ABNOVA (H00008878-P01), which was generated from a wheat germ expression system (purity of >95%; LPS-free). All treatments by rSQSTM1 were carried out in serum-free Opti-MEM I medium (31985070, Thermo Fisher Scientific).
Animal model of sepsis and endotoxemia
C57BL/6J WT (000664), tmem173−/− (025805), Tmem173flox/flox (031670), Lyz2Cre (004781), and Insrflox/flox (006955) mice were obtained from the Jackson Laboratory. GsdmdI105N/I105N mice (C57BL/6) were a gift from Vishva M. Dixit. Casp11flox/flox mice (C57BL/6) were a gift from Timothy R. Billiar. Sqstm1flox/flox mice (C57BL/6) were a gift from Takeshi Sakurai. Mice were housed with their littermates in groups of four animals per cage and kept on a regular 12-h light and dark cycle (7:00–19:00 light period; room temperature: 20–25 °C; relative humidity: 40–60%). Food and water were available ad libitum. Experiments were carried out under pathogen-free conditions and the health status of mouse lines was routinely checked by veterinary staff. No wild animals were used in the study. Experiments were carried out with randomly chosen littermates of the same sex and matched by age and body weight. We conducted all animal care and experimentation in accordance with the Association for Assessment and Accreditation of Laboratory Animal Care guidelines (http://www.aaalac.org) and with approval from institutional animal care and use committees (Guangzhou Medical University, UT Southwestern Medical Center, or Daping Hospital).
CLP model:
Sepsis was induced in male or female C57BL/6J mice (8- to 10-weeks old, 22 to 26 g weight; female or male [1:1]) using a surgical procedure termed CLP55–57. Briefly, anesthesia was induced with ketamine (80–100 mg/kg/i.p.) and xylazine (10–12.5 mg/kg/i.p.). A small midline abdominal incision was made and the cecum was exteriorized and ligated with 4–0 silk immediately distal to the ileocecal valve without causing intestinal obstruction. The cecum was then punctured once with a 22-gauge needle. The abdomen was closed in two layers and mice were injected subcutaneously with 1 ml Ringer’s solution, including analgesia (0.05 mg/kg buprenorphine). For a clinically relevant sepsis model, the antibiotics (primaxin; 25 mg/kg imipenem and 25 mg/kg cilastatin) were repeatedly administered at 2, 24, 48, and 72 h after CLP. SQSTM1 mAbs (20 mg/kg; 814801, BioLegend) were repeatedly administered intraperitoneally to mice at 2, 24, 48, and 72 h after CLP.
Single-bacterial sepsis model:
Male or female C57BL/6J mice (8- to 10-weeks old, 22 to 26 g weight; female or male [1:1]) were intraperitoneally given a single dose of E. coli (Serovar O1:K1:H7, 1 × 10⁹ CFU; ATCC) or S. pneumoniae (CIP 104225, 1 × 10⁹ CFU; ATCC). SQSTM1 mAbs (20 mg/kg; 814801, BioLegend) were repeatedly administered intraperitoneally to mice at 2, 24, 48, and 72 h after CLP.
Endotoxemia model:
LPS (E. coli 0111:B4, 10 mg/kg; L4391, Sigma) was dissolved in PBS. Male or female C57BL/6J mice (8- to 10-weeks old, 22 to 26 g weight; female or male [1:1]) were intraperitoneally administered a single dose of SQSTM1 mAbs (20 mg/kg) followed 30 min later by an infusion of LPS (10 mg/kg, intraperitoneally) and were then re-treated with SQSTM1 mAbs 6, 12, and 24 h later.
CASP11-mediated sepsis model:
Male or female C57BL/6J mice (8- to 10-weeks old, 22 to 26 g weight; female or male [1:1]) were primed with poly(I:C) (10 mg/kg, i.p.) and then challenged 6 h later with LPS (2 mg/kg, i.p.)52,58.
rSQSTM1 model:
Mouse SQSTM1 full-length recombinant protein was obtained from MyBioSource (MBS1399297), which was generated from a yeast expression system (purity of >95%; LPS-free). Male or female C57BL/6J mice (8- to 10-weeks old, 22 to 26 g weight; female or male [1:1]) were intraperitoneally administered a single dose of rSQSTM1 (500 μg/mouse).
We did not exclude samples or animals. No statistical methods were used to predetermine sample sizes, but our sample sizes (n=5–10 mice/group) are similar to those generally employed in the field59,60. All treatments were performed by technicians who were not blind, but not involved in sample measurement.
Patient samples
PBMCs and plasma samples from patients with bacterial sepsis were collected from Daping Hospital of the Third Military Medical University at the time of admission to the ICU before initiation of treatment. The collection of samples was approved by the institutional review board of Daping Hospital and written informed consent was obtained. Sepsis was established according to the Third International Consensus Definitions for Sepsis and Septic Shock (Sepsis-3)1, which defines sepsis as life-threatening organ dysfunction caused by a dysregulated host response to infection. Organ dysfunction can be identified as an acute change in the total SOFA score of ≥2 points due to the infection1. Patients were excluded from the study if they had received a blood transfusion within the past 4 months, a platelet transfusion within the past month, or anticoagulant therapy with the past month. Patients were also excluded if they had a preexisting platelet disorder, such as idiopathic thrombocytopenic purpura, chronic myelogenous leukemia, multiple myeloma, primary myelofibrosis, polycythemia vera, primary thrombocythemia, and thrombotic thrombocytopenic purpura.
Basic demographic and clinical data, including data for age, sex, infection site, types of infection, SOFA score, DIC score, coagulation markers, length of hospital and ICU stay, and 28-day mortalities were retrieved from the registry (Table S2). The SOFA grades the function of six organ systems on a scale of 0 to 4 depending on the degree of dysfunction using objective measurements1. The maximum SOFA scores were the highest (worst) scores within 24 h of emergency department arrival. The DIC scores were evaluated using the scoring system from the International Society on Thrombosis and Haemostasis61.
LPS transfection
To stimulate CASP11 noncanonical inflammasome activation, LPS was electroporated into the indicated cells using the Neon Transfection System (Thermo Fisher Scientific) according to the manufacturer’s protocol. Briefly, BMDMs were electroporated with LPS (1 μg) in buffer R (MPK10025, Thermo Fisher Scientific) under pulse voltage 1400 V, pulse width 10 ms, and pulse number 2.
Cytotoxicity assay
LDH release was evaluated using an LDH Assay Kit (ab102526, Abcam) according to the manufacturer’s instructions. The released LDH was normalized to total LDH content measured in 1% Triton X-100–permeabilized samples of indicated cells. In addition, the dead cells were confirmed using PI (P3566, Thermo Fisher Scientific) staining.
Cell fractionation and organelle isolation
Supernatants of cells were concentrated using a Microcon-10kDa Centrifugal Filter Unit with Ultracel-10 membrane (MRCPRT010, Millipore). The lysosome isolation kit (ab234047, Abcam) was used to isolate lysosomal fractions from cultured cells by differential centrifugation followed by density gradient centrifugation. Finally, the purified lysosomal fraction was obtained using an ultracentrifuge (145,000 × g) for 2 h at 4°C. Membrane protein was extracted using a Mem-PER Plus Membrane Protein Extraction Kit (89842, Thermo Fisher Scientific). Briefly, the cells were permeabilized with a mild detergent containing the permeabilization buffer, with the aim of liberating soluble cytosolic proteins. After removal of the soluble fraction containing hydrophilic proteins, the membrane proteins were extracted from the insoluble fraction using a membrane solubilization buffer.
Biochemical and coagulation assay
Commercially available ELISA kits were used to measure the concentrations or activity of HMGB1 (ST51011, Shino Test Corporation), IL1B (MLB00C, R&D Systems), IL6 (M6000B, R&D Systems), TNF (MTA00B, R&D Systems), D-dimer (ab196269, Abcam; MBS723281, MyBioSource), SQSTM1 (ADI-900–212, Enzo Life Sciences), and lactate (ab65331, Abcam; E4341, BioVision) in the indicated samples. Measurement of tissue enzymes (CK, AMY, and GPT/ALT) and BUN in the serum was performed using the IDEXX Catalyst Dx Chemistry Analyzer. Measurement of glucose uptake was performed using a Glucose Uptake Assay Kit (ab136955, Abcam). PT, APTT, and fibrinogen were measured in an automated coagulometer (Sysmex CA-7000). Platelet count was measured using an IDEXX ProCyte Dx Hematology Analyzer.
RNAi
All shRNA constructs in a lentiviral format as described in Table S1 were purchased from Sigma-Aldrich. We seeded 1 × 10⁵ cells in each well of a 12-well plate in 500 μl of complete medium and transduced by lentiviral vectors at an MOI of 10:1. Transduction was carried out in the presence of polybrene (8 μg/ml). After recovering with complete culture medium, puromycin was used for the selection of transduced cells. TARGETplus SMART pool siRNAs against the indicated genes as described in Table S1 were purchased from Dharmacon. This pool was a mixture of four siRNAs provided as a single reagent. The Neon Electroporation System from Invitrogen was used to deliver siRNAs into cells. Transfected cells were recovered in complete DMEM. The medium was replaced at 3 h post electroporation. The cells were cultured for 48 h before further examination.
qPCR
Total RNA was extracted using a QIAGEN RNeasy Plus Kit according to the manufacturer’s instructions. First-strand cDNA was synthesized from 1 μg of RNA using the iScript cDNA Synthesis kit (1708890, Bio-Rad). Briefly, 20-μl reactions were prepared by combining 4 μl of iScript Select reaction mix, 2 μl of gene-specific enhancer solution, 1 μl of reverse transcriptase, 1 μl of gene-specific assay pool (20×, 2 μM), and 12 μl of RNA diluted in RNase-free water. Quantitative real-time PCR was carried out using synthesized cDNA, primers as described in Table S1, and SsoFast EvaGreen Supermix (172–5204, Bio-Rad). The data were normalized to RNA18S/Rn18s RNA and the fold change was calculated via the 2−ΔΔCt method56. Relative concentrations of mRNA were expressed in arbitrary units based on the untreated group, which was assigned a value of 1.
Western blot analysis
Cells were lysed in Cell Lysis Buffer (9803, Cell Signaling Technology) with protease inhibitor cocktail (Promega), phosphatase inhibitor cocktail (Sigma), and 1 mM Na3VO4. Cleared lysates were resolved by SDS-PAGE (3450124, Bio-Rad) and then transferred onto PVDF membranes (1704273, Bio-Rad)62,63. The membranes were blocked with Tris-buffered saline Tween 20 (TBST) containing 5% skim milk for 1 h at room temperature and then incubated with the indicated primary antibodies (1:1000–1:5000) overnight at 4°C. After being washed with TBST, the membranes were incubated with an HRP-linked anti-mouse IgG secondary antibody (7076, Cell Signaling Technology; 1:1000) or HRP-linked anti-rabbit IgG secondary antibody (7074, Cell Signaling Technology; 1:1000) for 1 h at room temperature. The membranes were washed three times in TBST and then visualized and analyzed with a ChemiDoc Touch Imaging System (1708370, Bio-Rad) or x-ray films.
Immunoprecipitation analysis
Cells were lysed at 4°C in ice-cold RIPA lysis buffer (20–188, Millipore) and cell lysates were cleared by a brief centrifugation (12,000 g, 10 min). Concentrations of proteins in the supernatant were determined by BCA assay. Prior to immunoprecipitation, samples containing equal amounts of proteins were pre-cleared with Protein A/G Sepharose beads (4°C, 3 h) from Abcam (ab193262) and subsequently incubated with various irrelevant IgG or specific antibodies (2–4 μg/ml) in the presence of Protein A/G Sepharose beads for 2 h or overnight at 4°C with gentle shaking64. Following incubation, Protein A/G Sepharose beads were washed extensively with PBS and proteins eluted by boiling in 2 × SDS sample buffer before SDS-PAGE electrophoresis.
Proteome profiler antibody array analysis
The R&D Systems Human Phospho-Kinase Array Kit (ARY003B) and the Proteome Profiler Human Phospho-RTK Array Kit (ARY001B) are membrane-based sandwich immunoassays. Captured antibodies spotted in duplicate on nitrocellulose membranes bind to specific target proteins present in the sample (step 1). Captured proteins are detected with biotinylated detection antibodies (step 2) and then visualized using chemiluminescent detection reagents (step 3). The signal produced is proportional to the amount of analyte bound. The intensities of bands were analyzed with Quick Spots Image Analysis Software (Western Vision Software, http://www.wvision.com/QuickSpots.html).
Oxidative phosphorylation and glycolysis assay
Cellular oxidative phosphorylation (OXPHOS) and glycolysis were monitored using the Seahorse Bioscience Extracellular Flux Analyzer (XF24, Seahorse Bioscience) by measuring the OCR (indicative of respiration) and ECAR (indicative of glycolysis) in real time as previously described65. Briefly, 30,000–50,000 cells were seeded in 24-well plates designed for XF24 in 150 μl of appropriate growth media and incubated overnight. Prior to measurements, cells were washed with unbuffered media once, then immersed in 675 μl of unbuffered media and incubated in the absence of CO2 for 1 h. The OCR and ECAR were then measured in a typical 8-min cycle of mix (2–4 min), dwell (2 min), and measure (2–4 min) as recommended by Seahorse Bioscience. The basal levels of OCR and ECAR were recorded first, followed by the OCR and ECAR levels following the injection of compounds that inhibit the respiratory mitochondrial electron transport chain, ATP synthesis, or glycolysis.
Immunofluorescence analysis
Cells were cultured on glass coverslips and fixed in 3% formaldehyde for 30 min at room temperature prior to detergent extraction with 0.1% Triton X-100 for 10 min at 25°C. Coverslips were saturated with 2% bovine serum albumin (BSA) in phosphate-buffered saline (PBS) for 1 h at room temperature and processed for immunofluorescence with primary antibodies, followed by Alexa Fluor 488- or Cy3-conjugated secondary antibodies. Nuclear morphology was analyzed with the fluorescent dye Hoechst 33342. Images were taken with a ZEISS LSM 800 confocal microscope (ZEISS, Germany). To visualize exofacial LAMP1, cells were washed with ice-cold PBS and then stained with monoclonal antibody (ab25245, Abcam) that recognizes a lumenal sequence of the LAMP1 protein as previously described66. In parallel, cells were also marked with Annexin A5 Alexa Fluor-568 conjugate to visualize exofacial phosphatidylserine.
CD4+ and CD8+ T-cell isolation
A single-cell suspension from mouse spleen was prepared using gentleMACS Dissociator (Miltenyi Biotec Inc.). CD4+ and CD8+ T cells were then isolated from this single-cell suspension using the magnetic CD4+ T Cell Isolation Kit (130-104-454, Miltenyi Biotec Inc.) or CD8+ T Cell Isolation Kit (130-104-075, Miltenyi Biotec Inc.) according to the manufacturer’s instructions.
Statistical analysis
Unpaired Student’s t tests were used to compare the means of two groups. One-way analysis of variance (ANOVA) was used for comparison among the different groups. When the ANOVA was significant, post hoc testing of differences between groups was performed using the least significant difference test. The correlative analysis was performed with the Pearson rank correlation test. Log-rank test was used to compare differences in mortality rates between groups. A P value < 0.05 was considered statistically significant. The exact value of n within figures is indicated in the figure legends.
Extended Data
Extended Data Fig. 1. LPS induces SQSTM1 secretion in monocytes and macrophages.
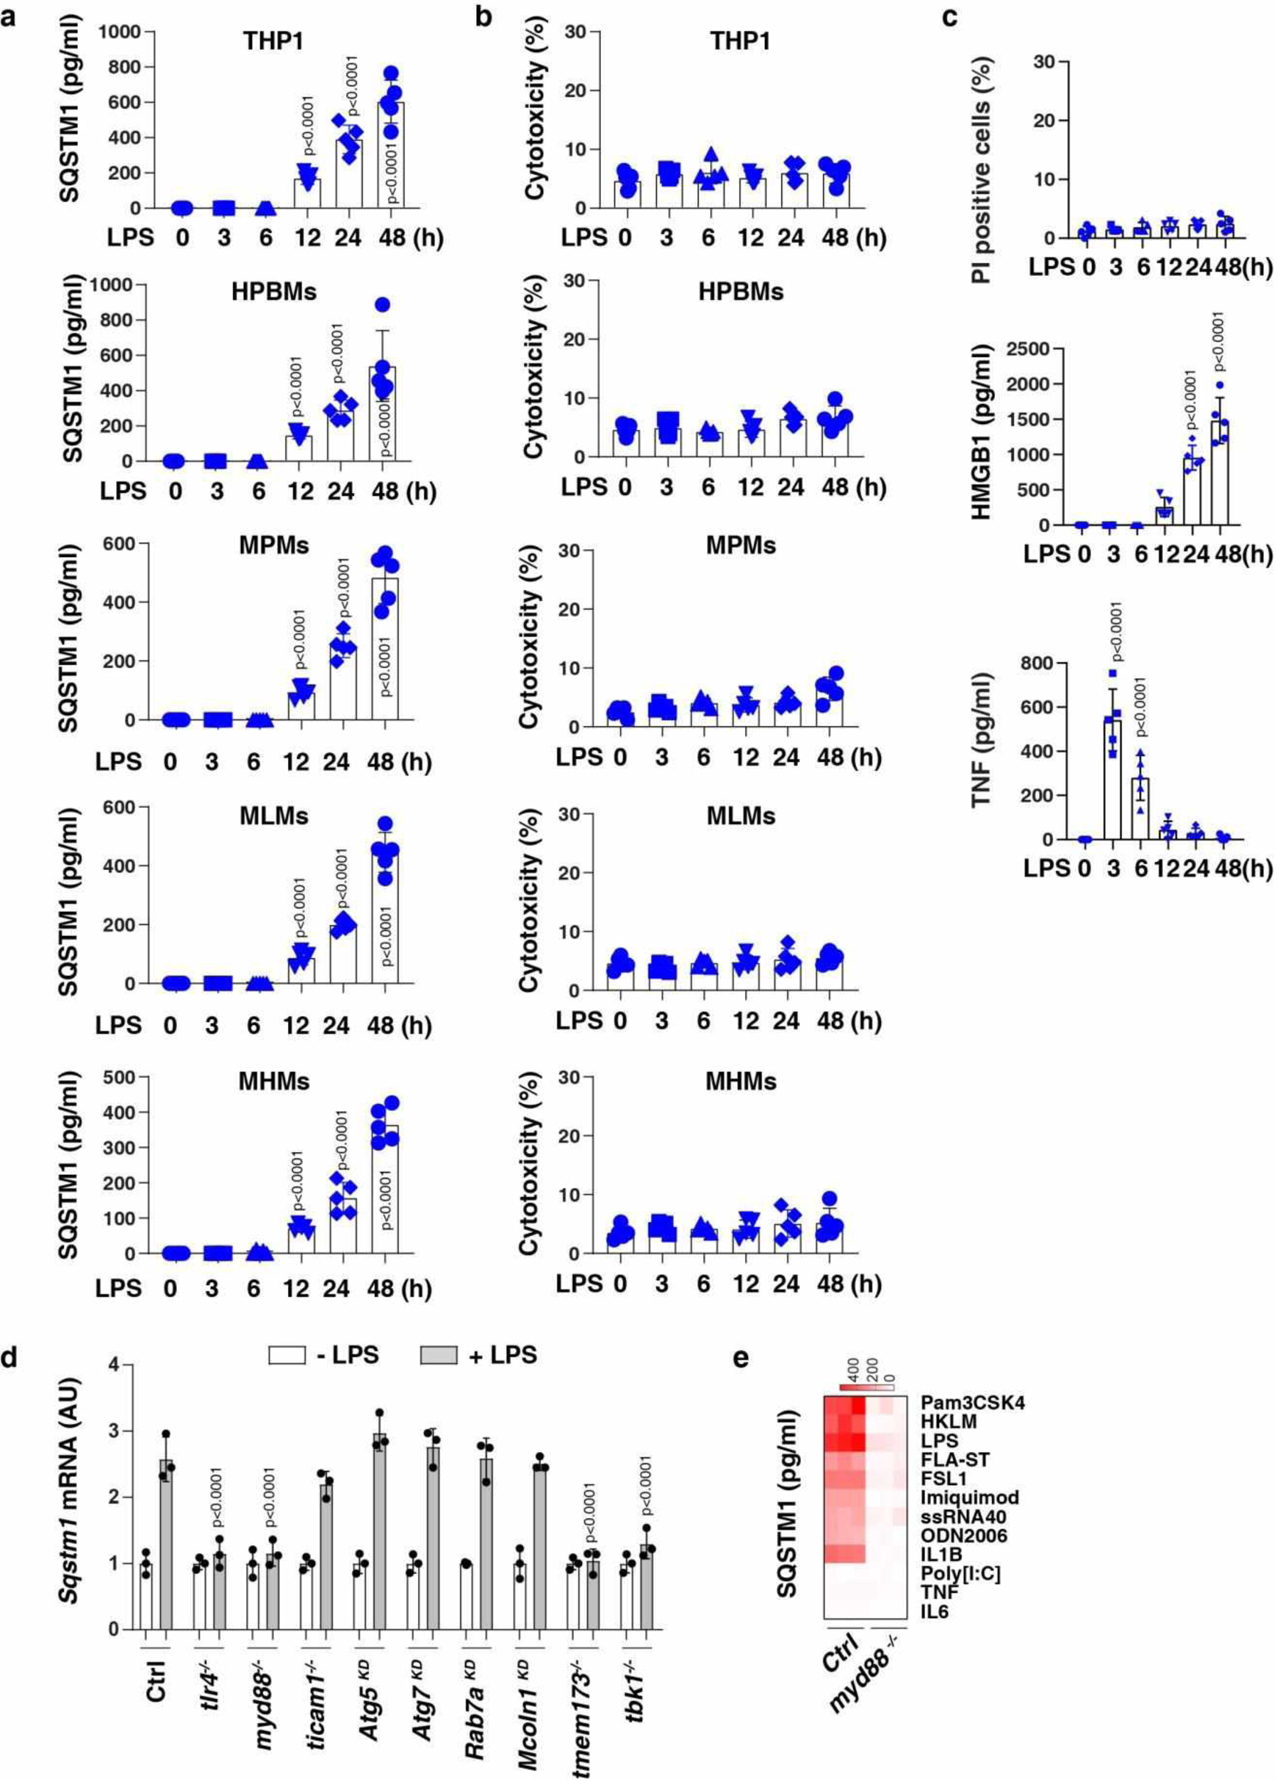
(a) ELISA analysis of SQSTM1 release in THP1 (a human monocytic cell line), primary human blood monocyte-derived macrophages (HPBMs), primary mouse peritoneal macrophages (MPMs), primary mouse lung macrophages (MLMs), and primary mouse hepatic macrophages (MHMs) following treatment with LPS (200 ng/ml) for 3–48 h (n = 5 well /group; two-tailed t test, versus untreated group). (b) LDH analysis of cytotoxicity in the indicated cells following treatment with LPS (200 ng/ml) for 3–48 h (n = 5 well /group). (c) Analysis of propidium iodide (PI)-positive cells, HMGB1 release, and TNF release in BMDMs following treatment with LPS (200 ng/ml) for 3–48 h (n = 5 well /group; one-way ANOVA test, versus control group). (d) The indicated BMDMs were treated with LPS (200 ng/ml) for 24 h and the level of Sqstm1 mRNA was assayed by qPCR (n = 3 well /group; two-tailed t test, versus control LPS group). (e) Heat map of SQSTM1 release in WT and myd88−/− BMDMs following treatment with pam3CSK4 (1 ng/ml), HKLM (107 cells/ml), poly(I:C) (10 μg/ml), LPS (200 ng/ml), FLA-ST (100 ng/ml), FSL1 (0.1 ng/ml), imiquimod (5 μg/ml), ssRNA40 (5 μg/ml), ODN2006 (10 μg/ml), IL1B (5 ng/ml), IL6 (5 ng/ml), or TNF (5 ng/ml) for 24 h. Data in (a-c) are presented as mean ± SD. Data in (a-c) and (e) are from two independent experiments. Data in (d) are from three independent experiments.
Extended Data Fig. 2. The activation of the GSDMD-dependent pyroptosis pathway induces SQSTM1 release.
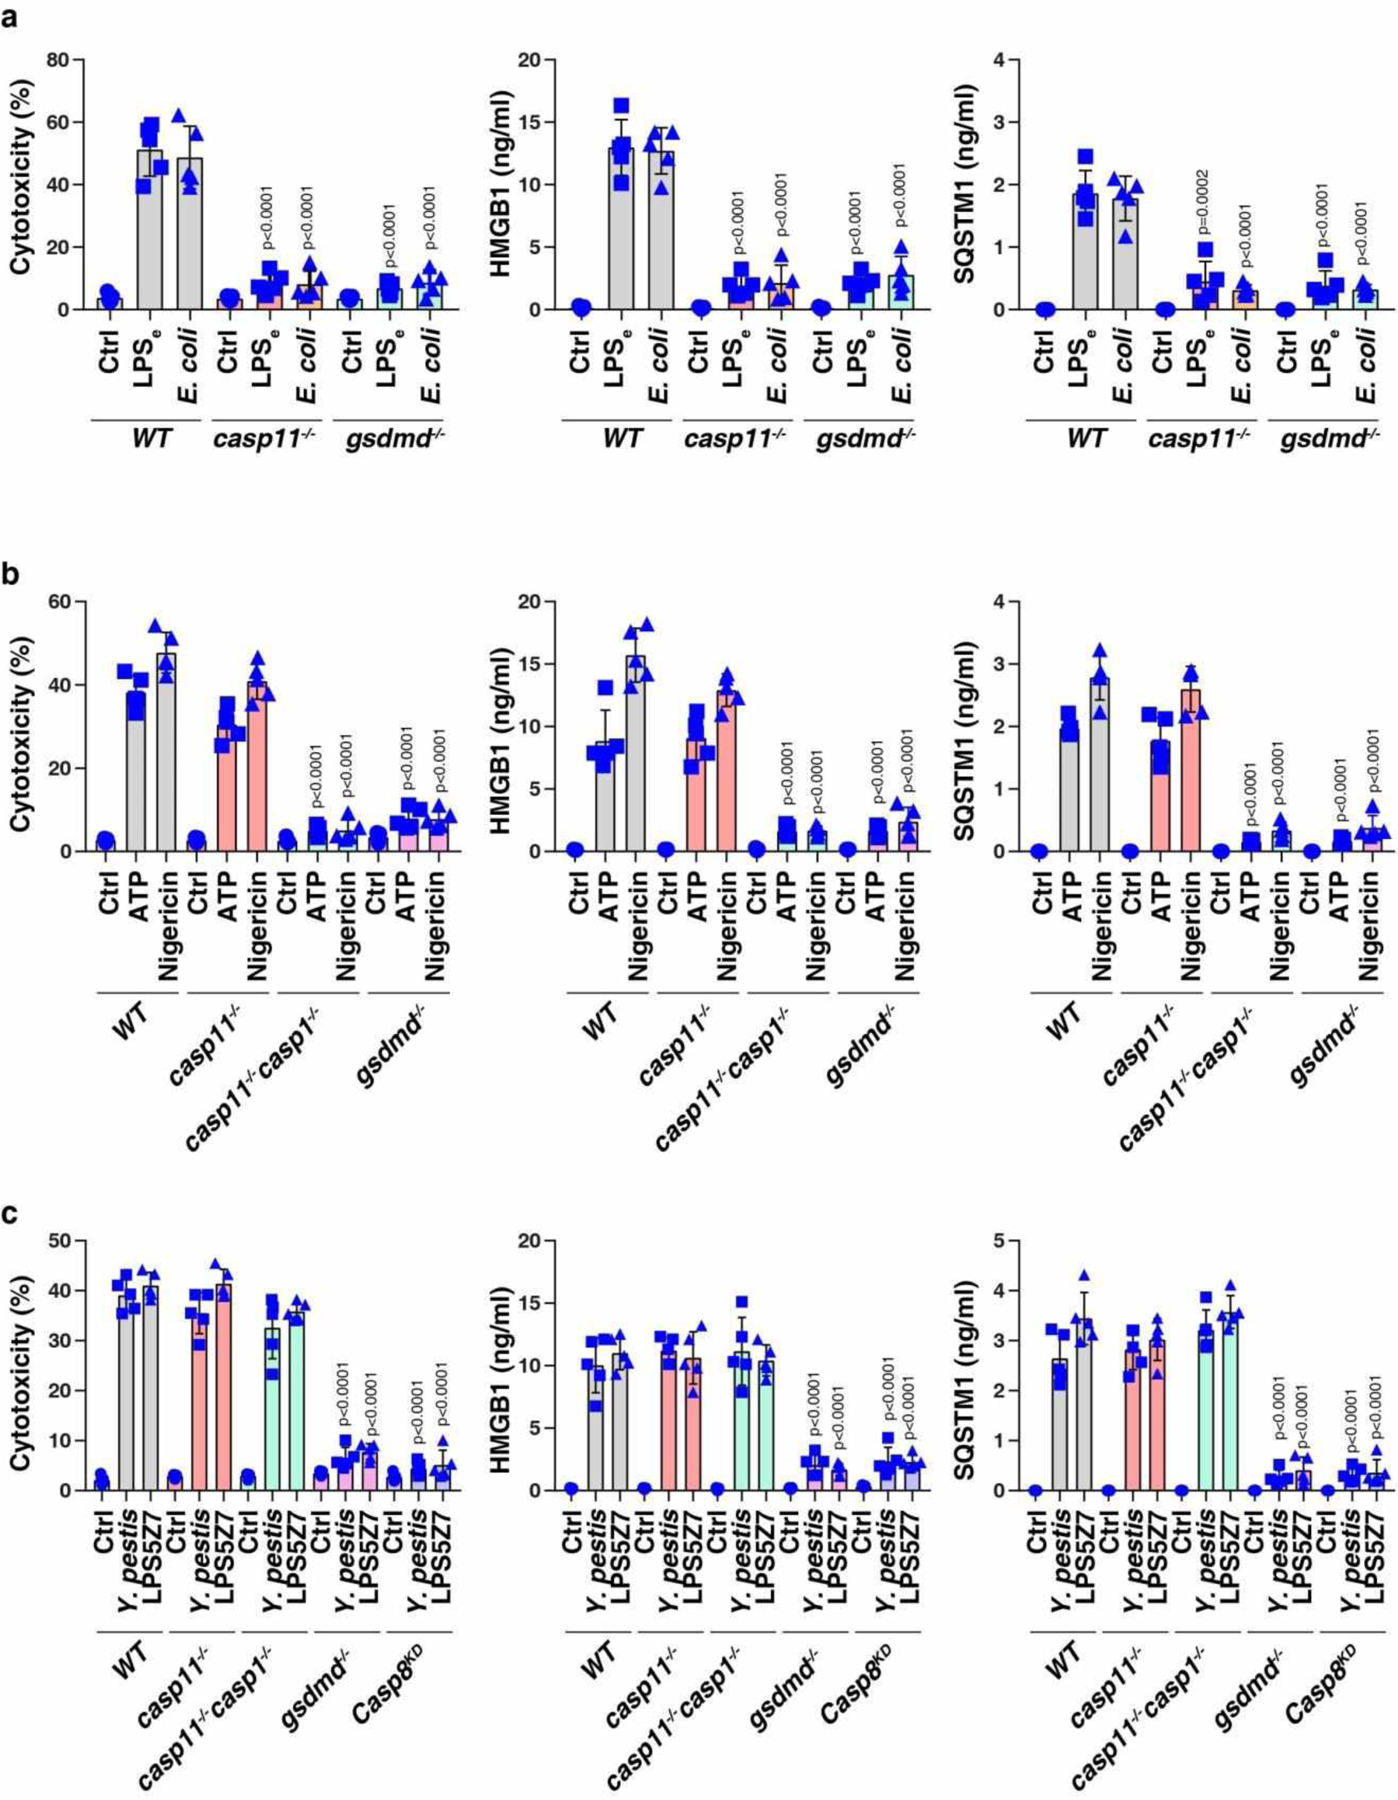
(a) Analysis of cytotoxicity, HMGB1 release, and SQSTM1 release in the indicated poly (I:C)-primed BMDMs following LPS electroporation (LPSe) or E. coli (MOI = 25) infection for 24 h (n = 5 well/group; two-tailed t test, versus wild type group). (b) Analysis of cytotoxicity, HMGB1 release, and SQSTM1 release in the indicated LPS-primed BMDMs following ATP (5 mM, 3 h) or nigericin (10 μM, 3 h) treatment (n = 5 well/group; two-tailed t test, versus wild type group). (c) Analysis of cytotoxicity, HMGB1 release, and SQSTM1 release in the indicated BMDMs following Y. pestis (MOI = 25) infection or LPS5Z7 (LPS [50 ng/ml] + 5z7 [400 nM]) (n = 5 well/group; two-tailed t test, versus wild type group). Data in (a-c) are presented as mean ± SD from two independent experiments.
Extended Data Fig. 3. Exogenous SQSTM1 promotes glucose uptake and lactate production.

(a, b) Indicated primary macrophages were stimulated with rSQSTM1 (10, 100, and 1000 ng/ml) or boiled rSQSTM1 (BrSQSTM1) for 24 h. The glucose uptake (a) and lactate production (b) were assayed (n = 3 well/group; one-way ANOVA test, versus control group). (c) TMs and HPBMs were treated with rSQSTM1 (100 ng/ml) and IL4 (50 ng/ml) for 48 h and the mRNA expression of Il10 and Arg1 were assayed (n = 3 well/group; two-tailed t test, versus control group). HPBMs, primary human blood monocyte-derived macrophages; MPMs, primary mouse peritoneal macrophages; MLMs, primary mouse lung macrophages; MHMs, primary mouse hepatic macrophages. Data in (a-c) are presented as mean ± SD from two independent experiments.
Extended Data Fig. 4. Effects of TLRs on rSQSTM1-induced NFKB activity.
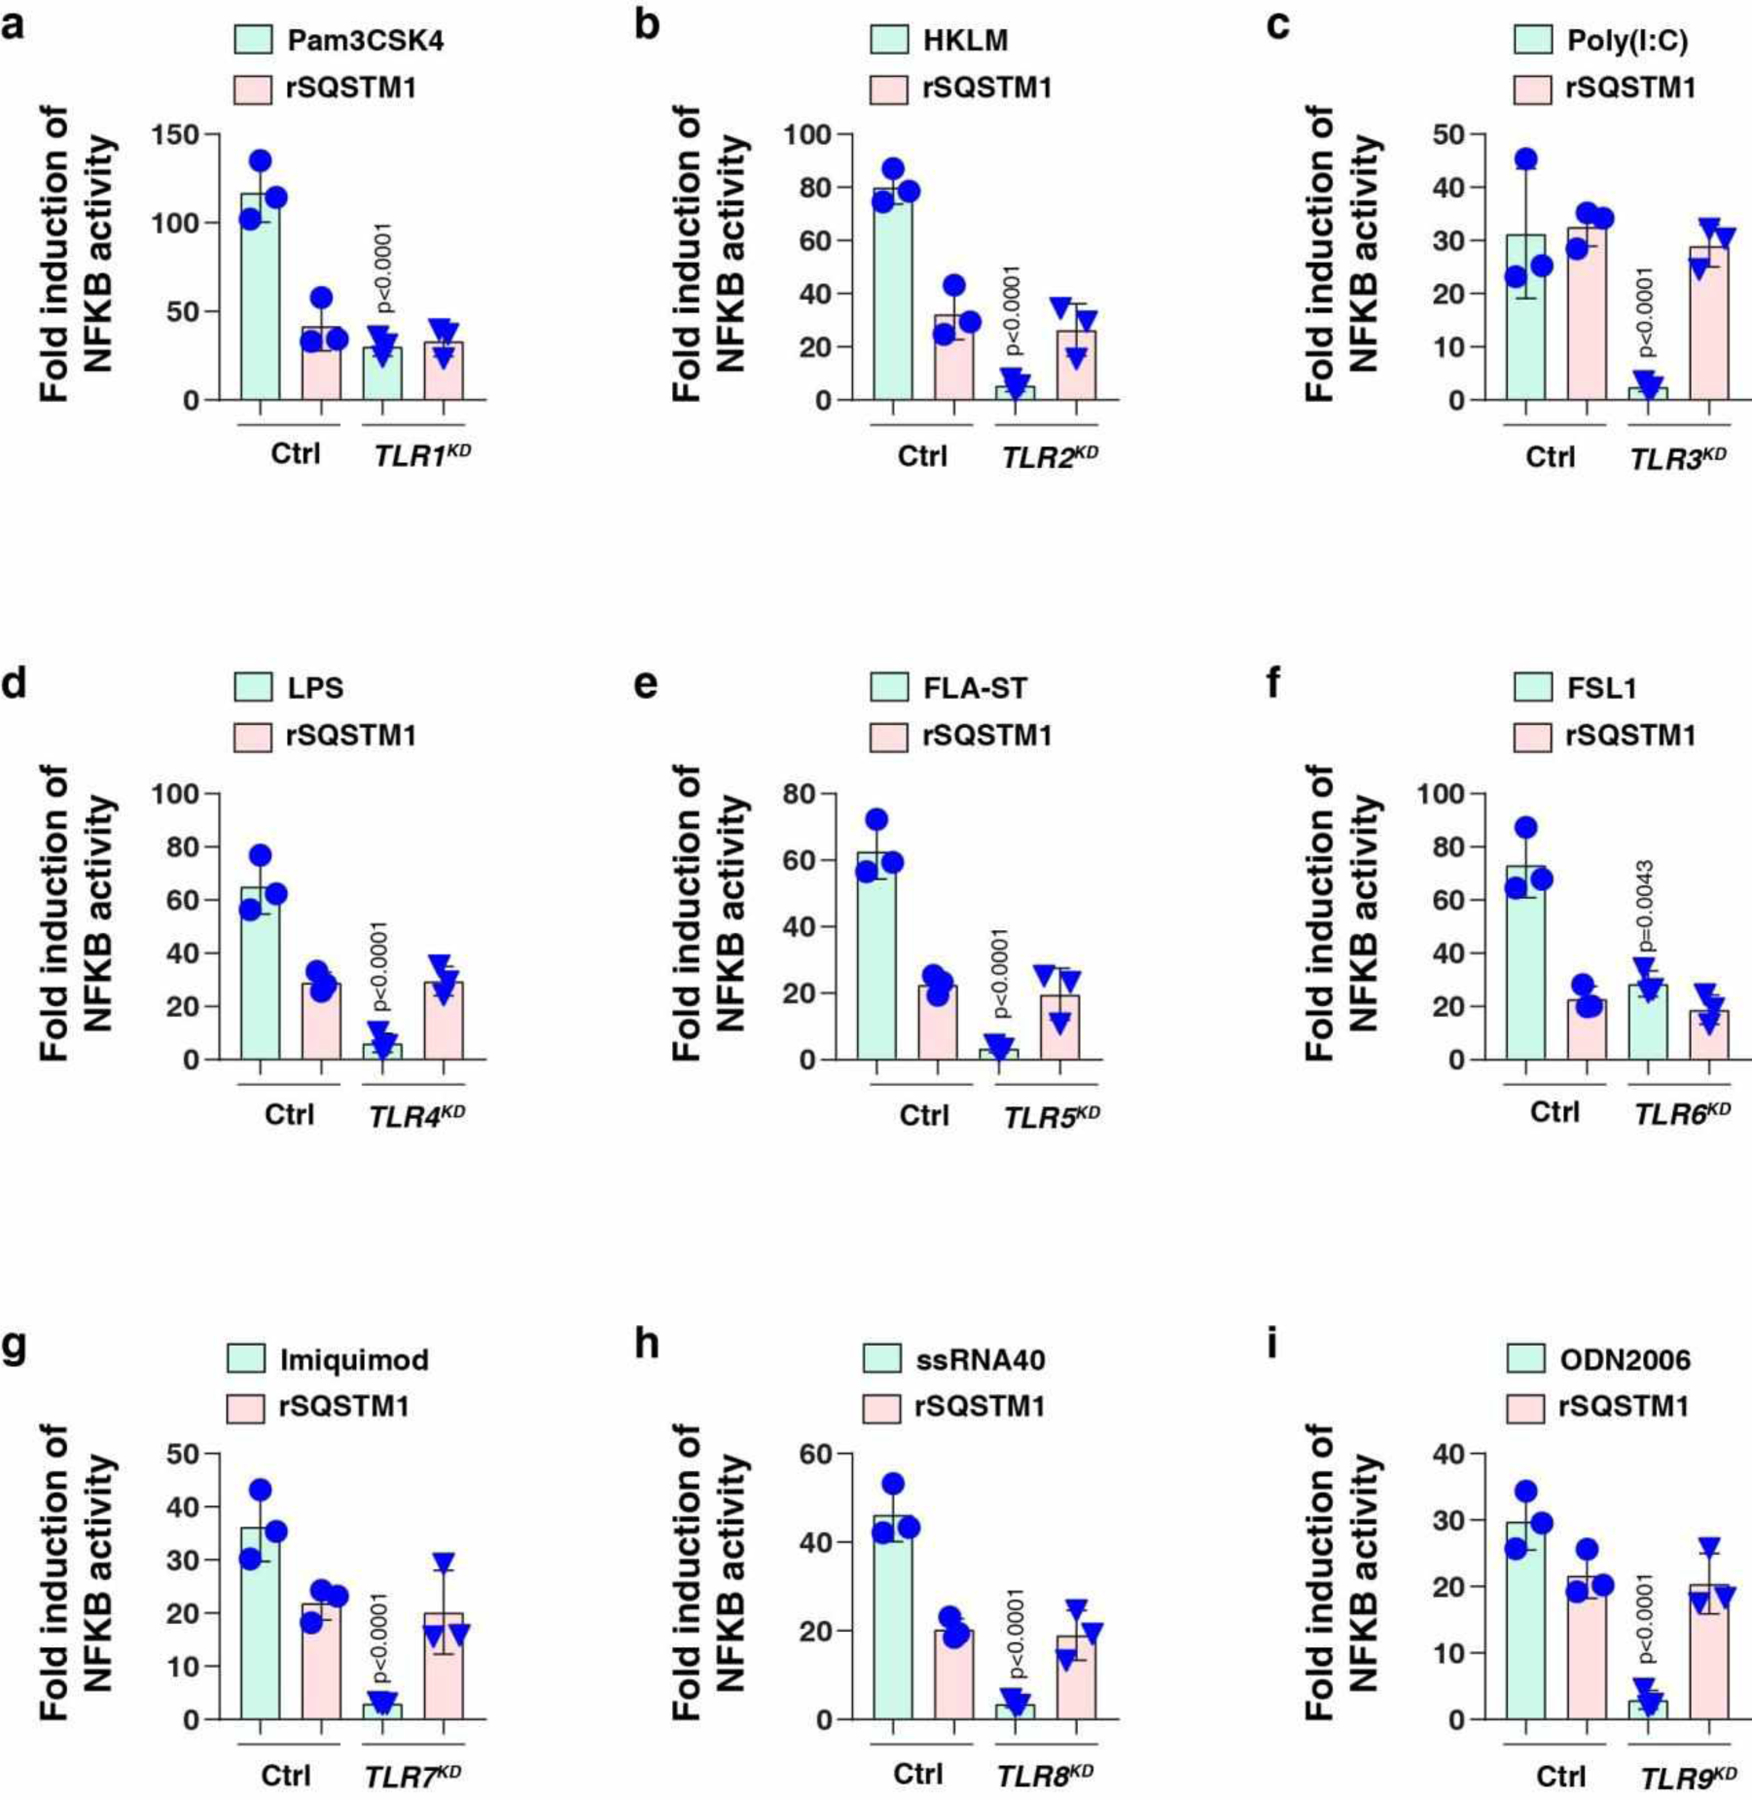
The indicated TLR-knockdown THP1 cells were stimulated with (a) pam3CSK4 (1 ng/ml), (b) HKLM (107 cells/ml), (c) poly(I:C) (10 μg/ml), (d) LPS (200 ng/ml), (e) FLA-ST (100 ng/ml), (f) FSL1 (0.1 ng/ml), (g) imiquimod (5 μg/ml), (h) ssRNA40 (5 μg/ml), (i) ODN2006 (10 μg/ml), or (a-i) rSQSTM1 (100 ng/ml) for 24 h and the levels of NFKB-induced Lucia luciferase were assessed (n = 3 well/group; two-tailed t test, versus control group). Data in (a-i) are presented as mean ± SD from two independent experiments.
Extended Data Fig. 5. PLCG1 and PTK2B mediate the activity of SQSTM1.
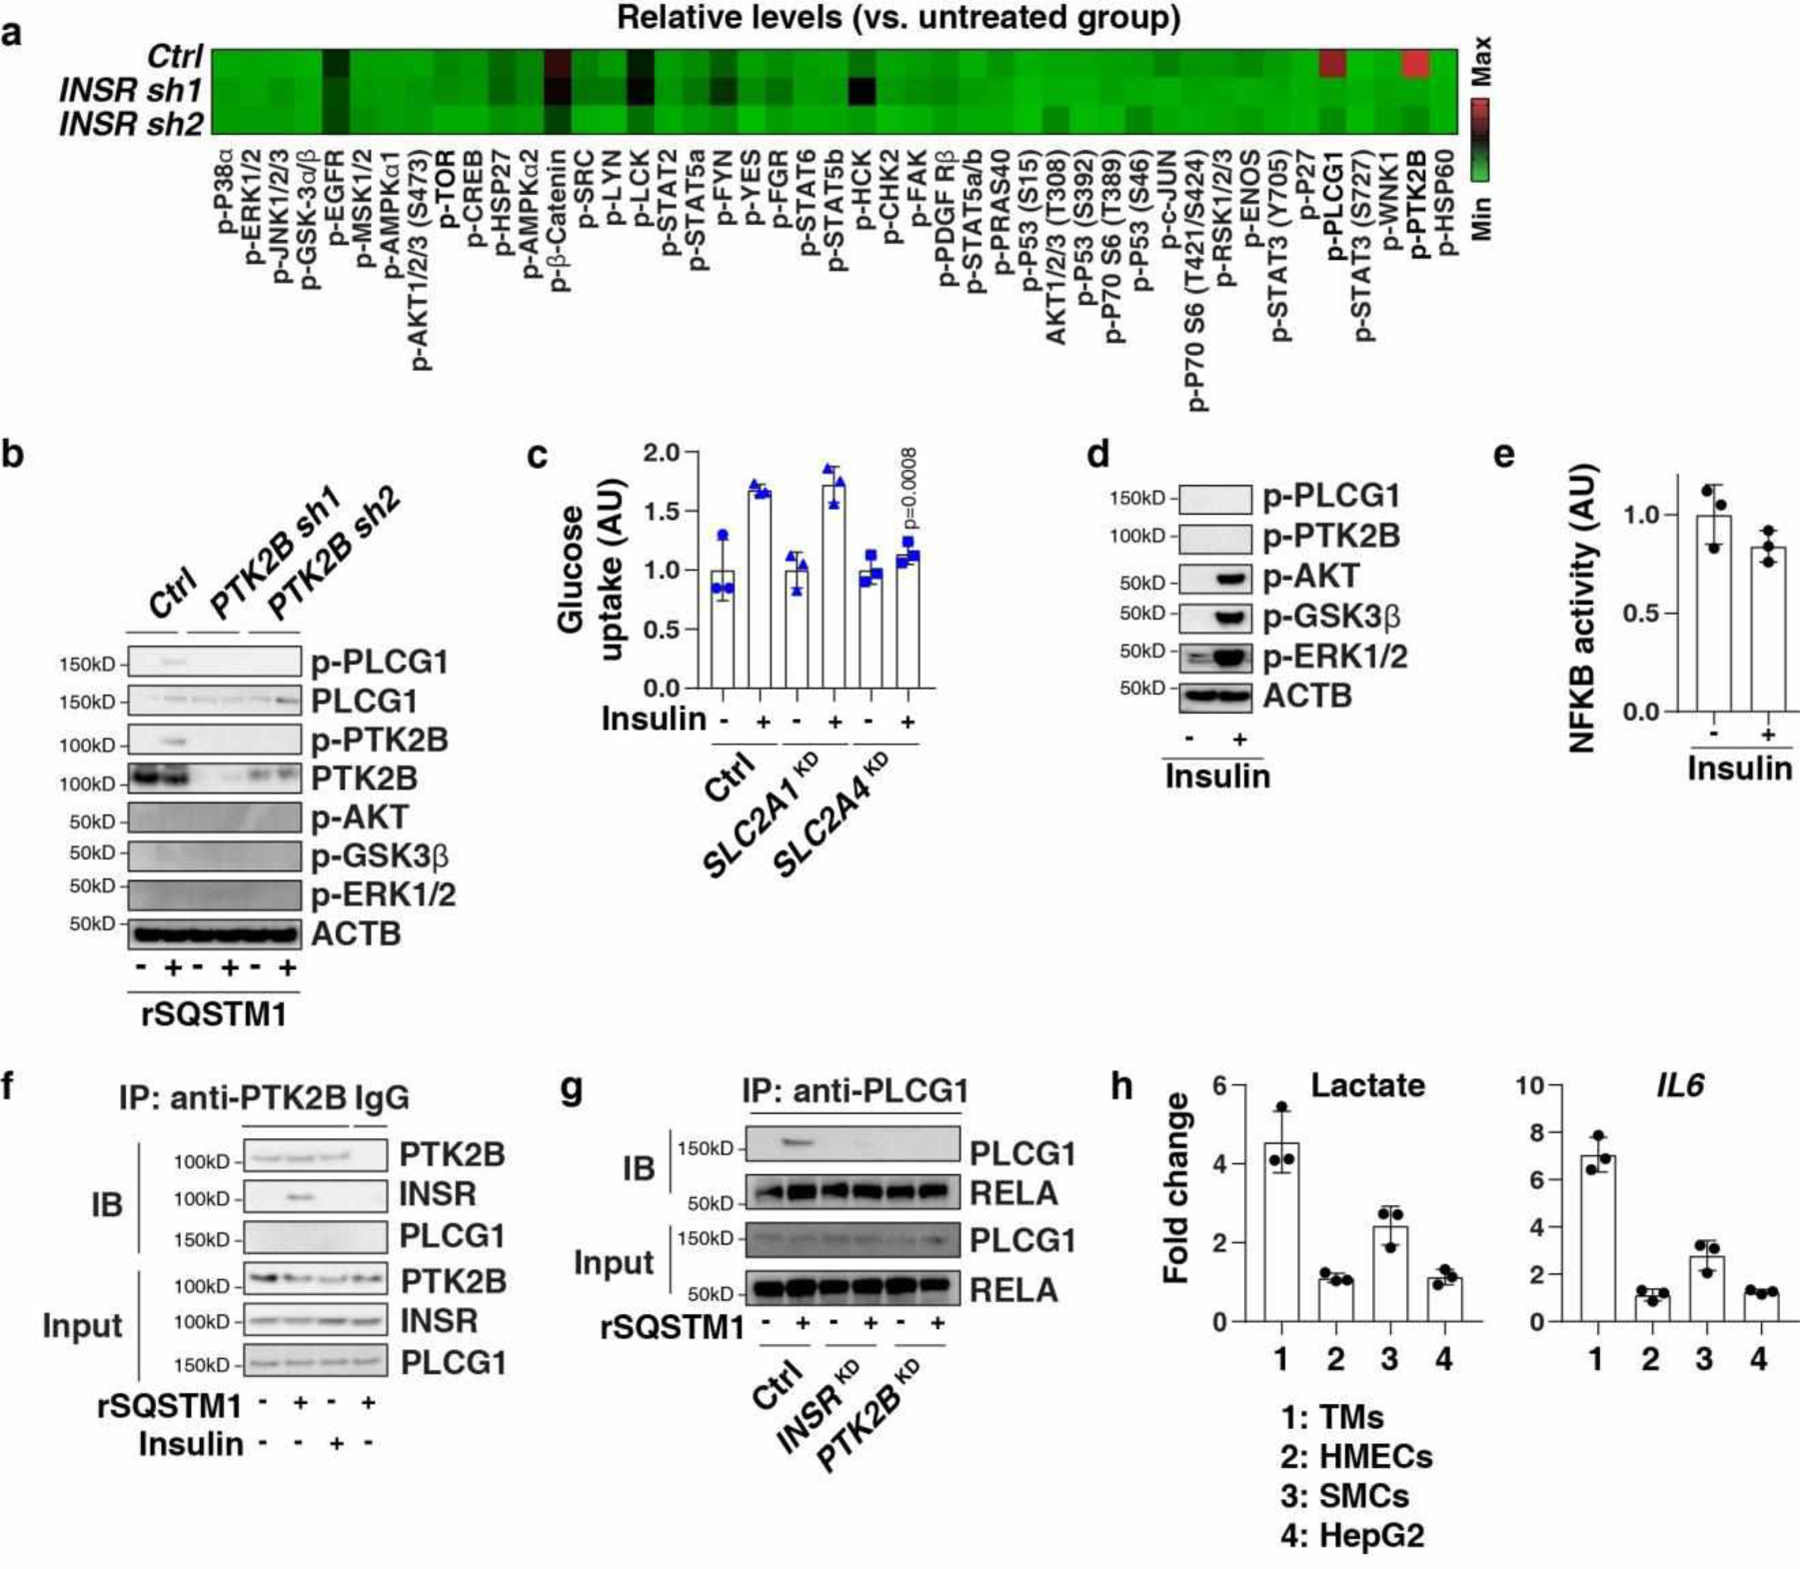
(a) Heatmap of kinase phosphorylation in the indicated TMs after rSQSTM1 (100 ng/ml) stimulation for 24 h. (b) Western blot analysis of protein expression in the indicated TMs following treatment with rSQSTM1 (100 ng/ml) for 24 h. (c) Indicated TMs (control, SLC2A1KD, or SLC2A4KD) were stimulated with insulin (100 nM) for 24 h. The glucose uptake was assayed (n = 3 well/group; two-tailed t test, versus control group). AU, arbitrary units. (d, e) Analysis of protein expression and NFKB activity in TMs following treatment with insulin (100 nM) for 24 h (n = 3 well/group). (f) Analysis of interaction between PTK2B and INSR in membrane protein extraction from TMs following treatment with insulin (100 nM) or rSQSTM1 (100 ng/ml) for 24 h. (g) Analysis of interaction between PLCG1 and RELA in whole protein extraction from indicated TMs following treatment with rSQSTM1 (100 ng/ml) for 24 h. (h) Indicated cells were treated with rSQSTM1 (100 ng/ml) for 24 h, and the levels of lactate and IL6 mRNA were assayed (n = 3 well/group). Data in (c), (e), and (h) are presented as mean ± SD. Data in (a) is from one independent experiment. Data in (b), (d), (f), and (g) are from two independent experiments. Data in (c), (e), and (h) are from three independent experiments.
Extended Data Fig. 6. The SQSTM1-INSR pathway mediates CLP-induced polymicrobial sepsis.
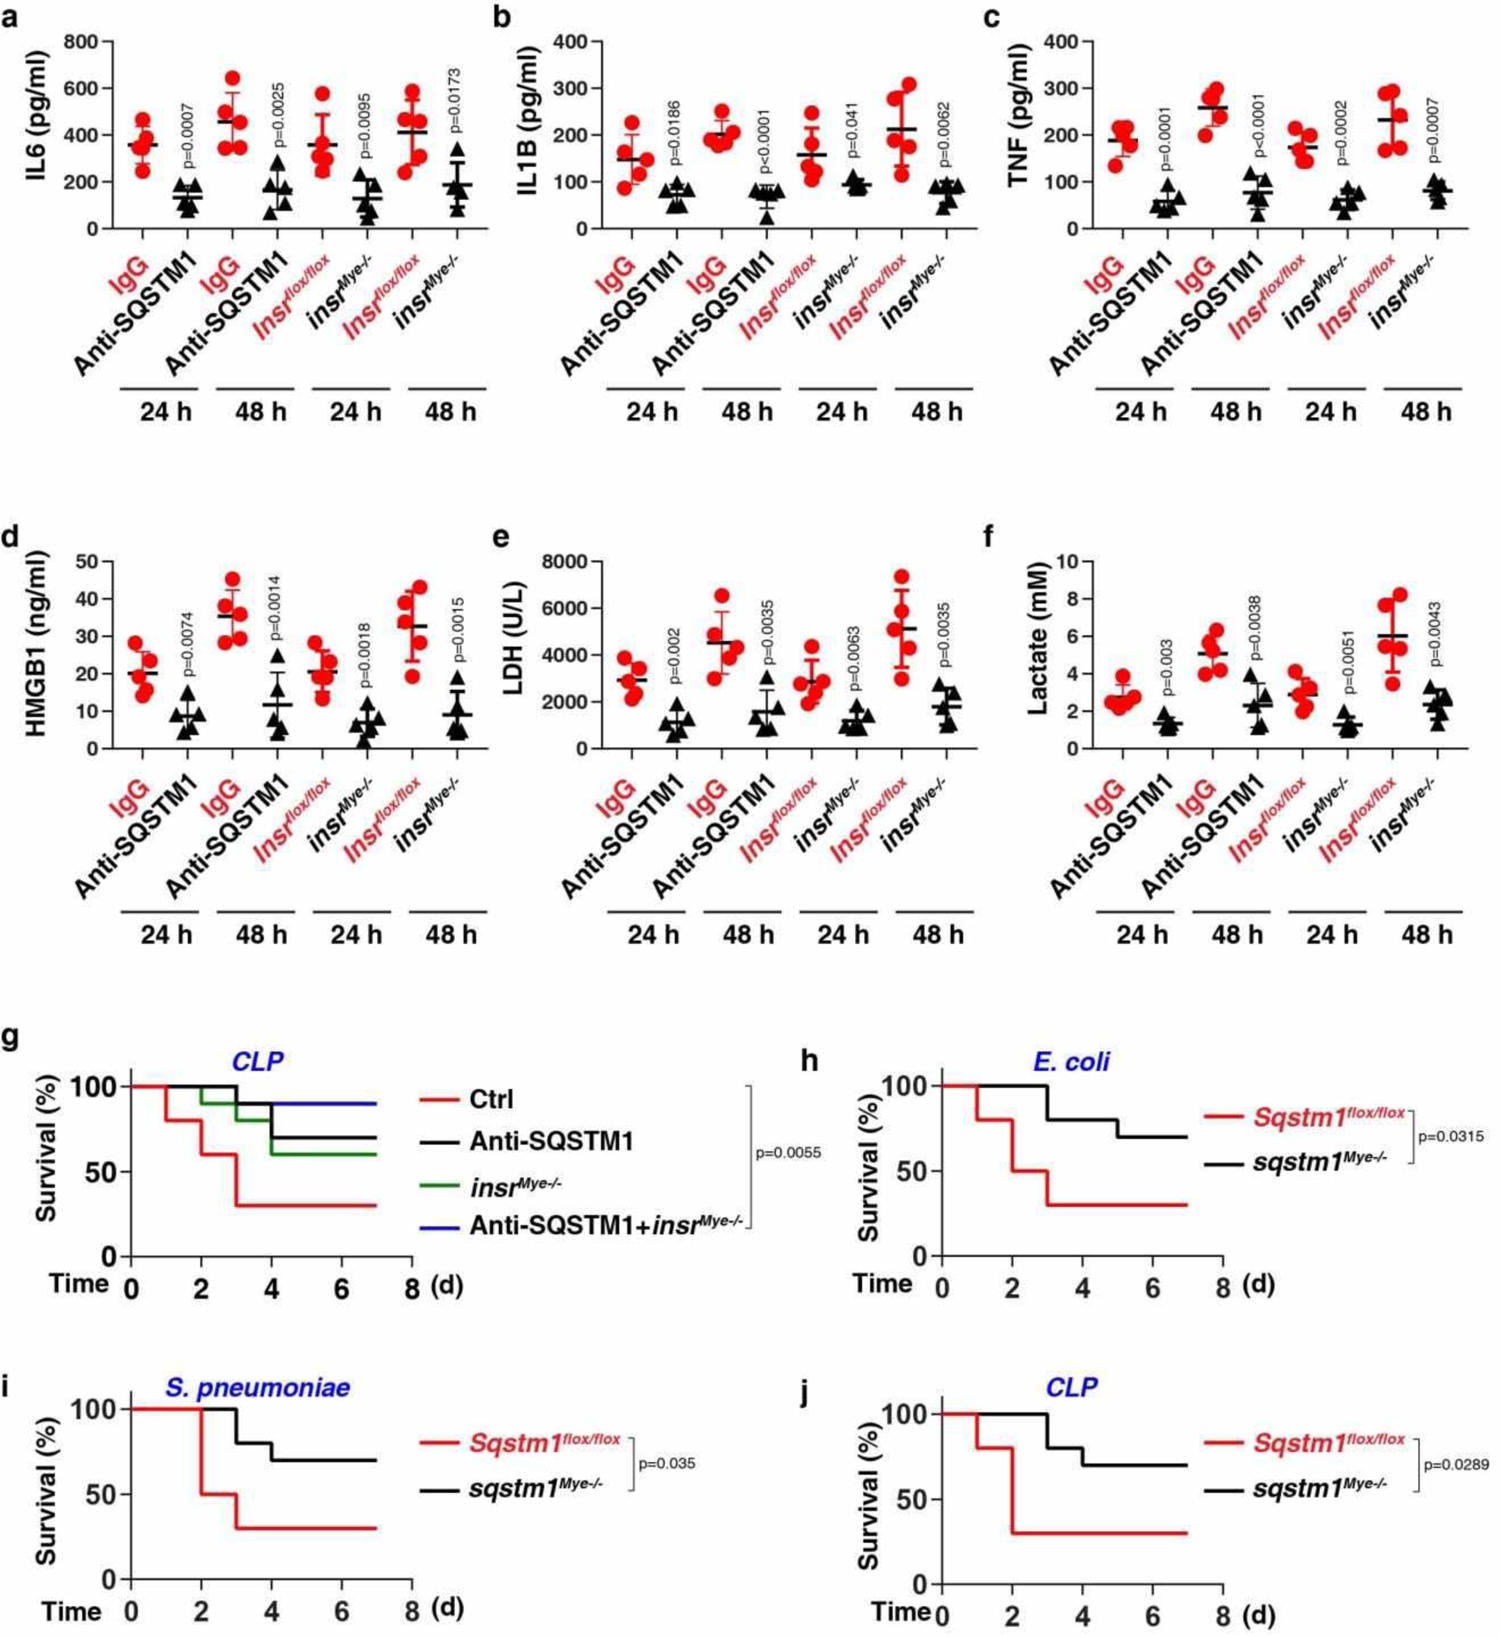
(a-f) The serum level of IL6 (a), IL1B (b), TNF (c), HMGB1 (d), LDH (e), and lactate (f) were assayed in indicated CLP-induced mice with or without anti-SQSTM1 monoclonal antibodies (20 mg/kg) treatment or depletion of INSR in myeloid cells (n = 5 mice/group; two-tailed t test, versus control group). (g) Administration of anti-SQSTM1 monoclonal antibodies (20 mg/kg) and/or depletion of INSR in myeloid cells in mice prevented CLP-induced animal death (n = 10 mice/group; Log-rank test). (h-j) Survival of the indicated mice after E. coli (h) or S. pneumoniae (i) infection or (j) CLP-induced sepsis (n = 10 mice/group; Log-rank test). Data in (a-f) are presented as mean ± SD from three independent experiments. Data in (g-j) are from two independent experiments.
Extended Data Fig. 7. The inhibition of the SQSTM1-INSR pathway protects mice against LPS-induced endotoxemia.
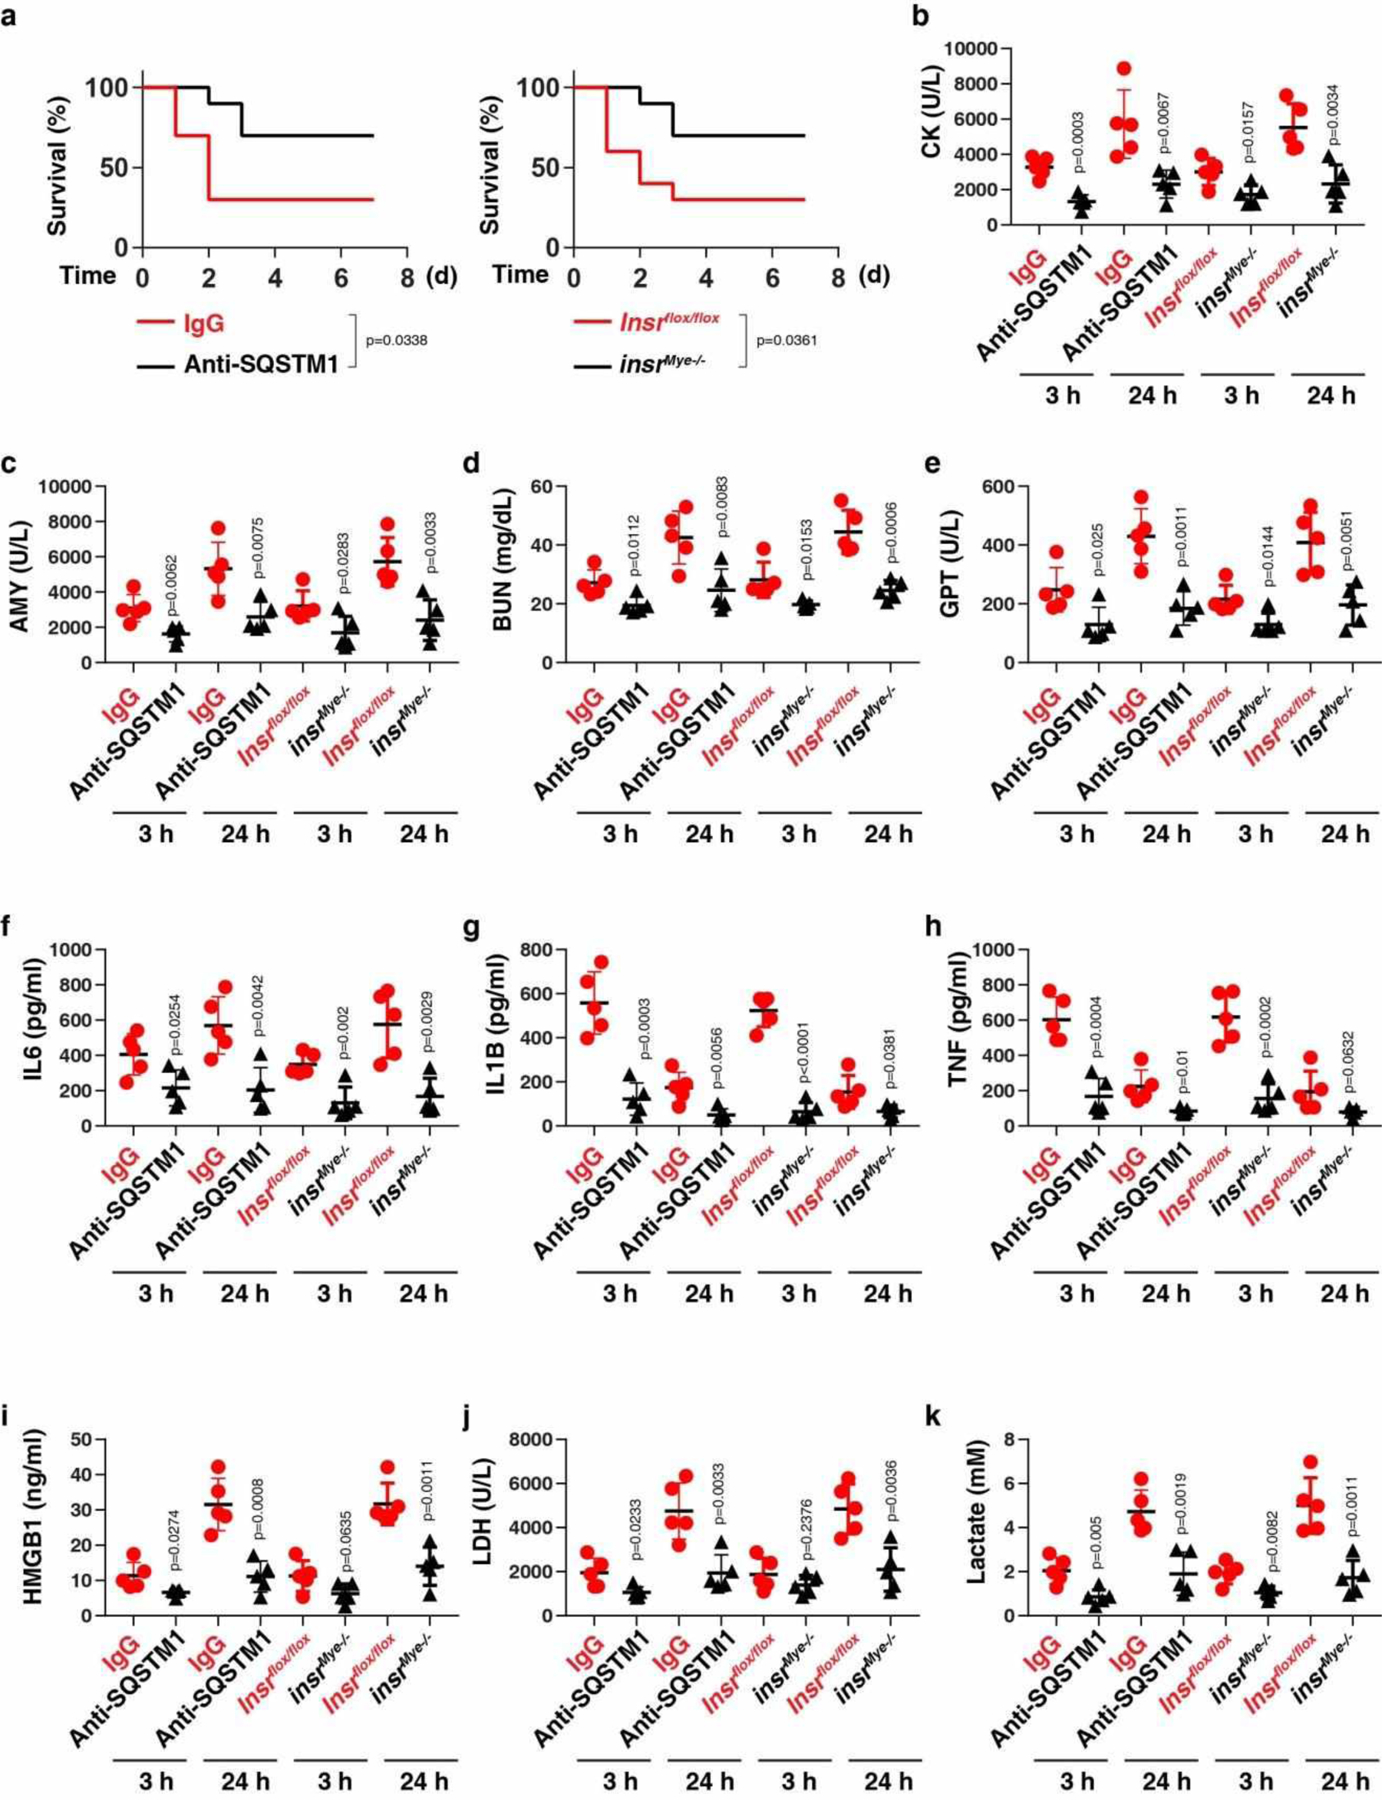
(a) Administration of anti-SQSTM1 monoclonal antibodies (20 mg/kg) or depletion of INSR in myeloid cells in mice prevented LPS (10 mg/kg)-induced animal death (n = 10 mice/group; Log-rank test). (b-k) In parallel, the serum levels of CK (b), AMY (c), BUN (d), GPT/ALT I (e), IL6 (f), IL1B (g), TNF (h), HMGB1 (i), LDH (j), and lactate (k) were assayed (n = 5 mice/group; two-tailed t test, versus control group). Data in (b-k) are presented as mean ± SD. Data in (a-k) are from two independent experiments.
Extended Data Fig. 8. The inhibition of the SQSTM1-INSR pathway protects mice against bacterial sepsis.
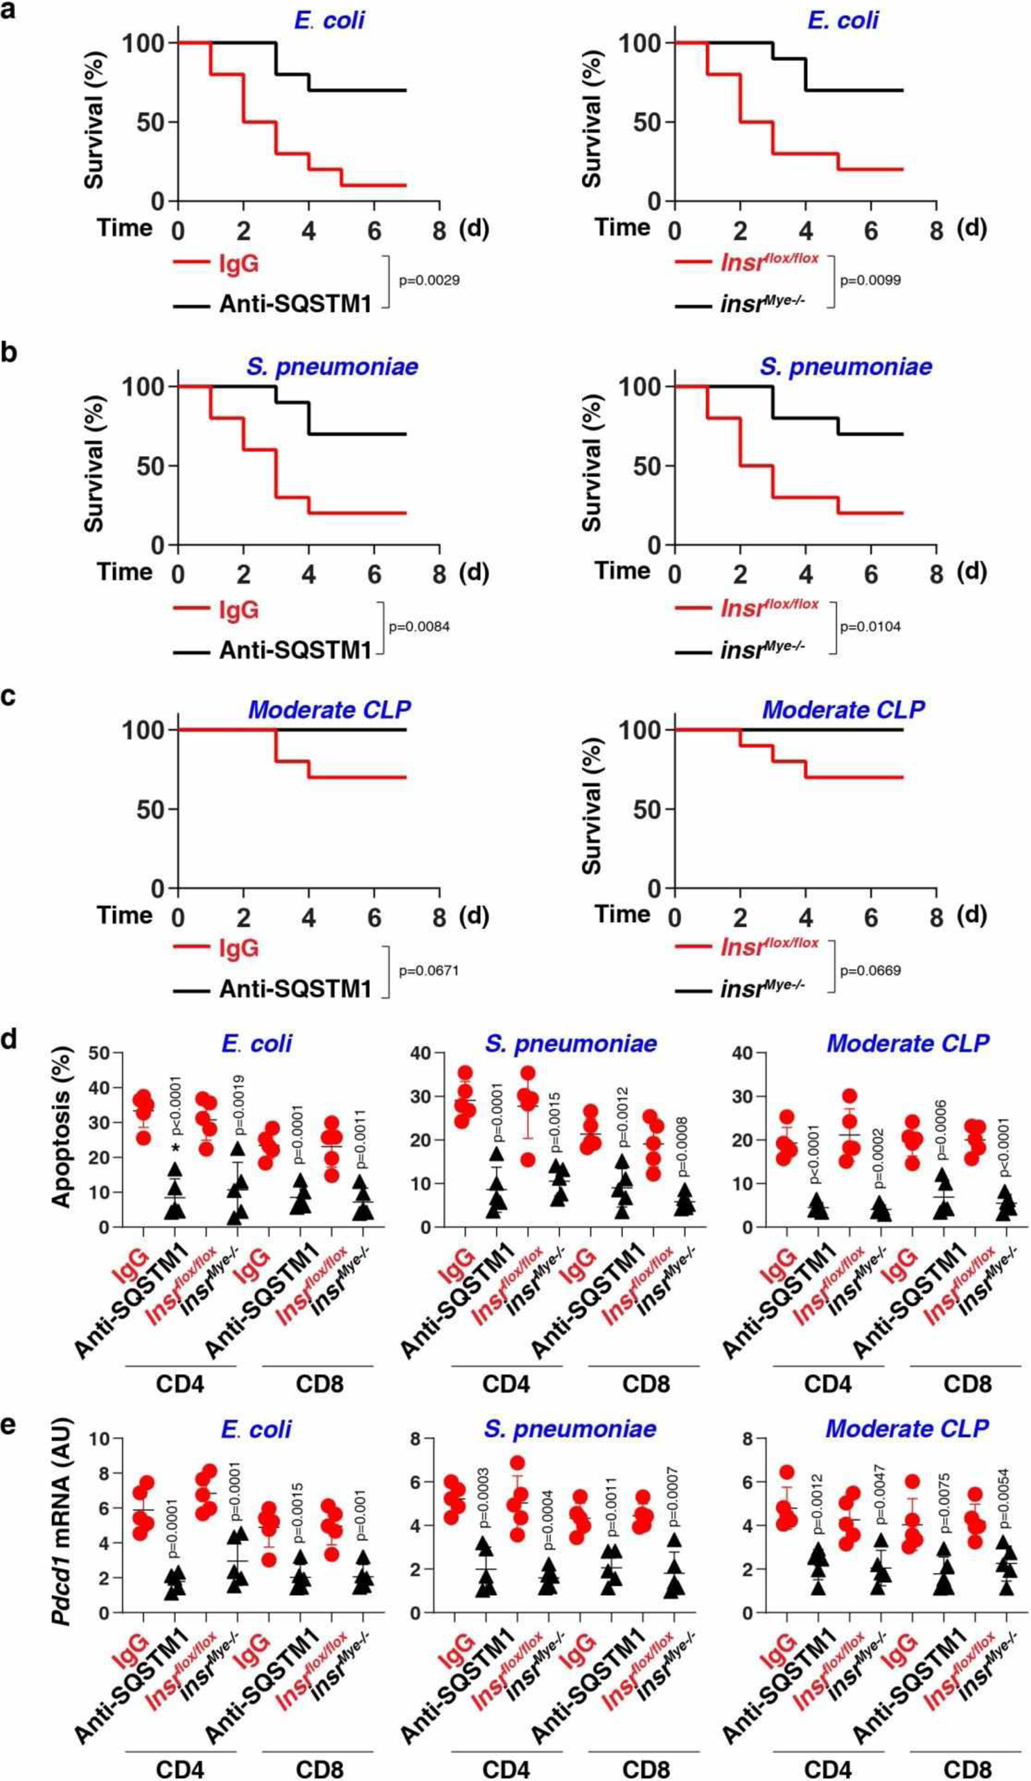
(a-c) Survival of the indicated mice in E. coli (a) or S. pneumoniae (b) infection or (c) clinically relevant moderate CLP-induced sepsis (n = 10 mice/group; Log-rank test). (d, e) In parallel, the levels of apoptosis (d) and Pdcd1 mRNA (e) were assayed at 72 h (n = 5 mice/group; two-tailed t test, versus control group). Data in (d-e) are presented as mean ± SD. Data in (a-e) are from two independent experiments.
Extended Data Fig. 9. The SQSTM1-INSR pathway promotes systemic coagulation in bacterial sepsis.
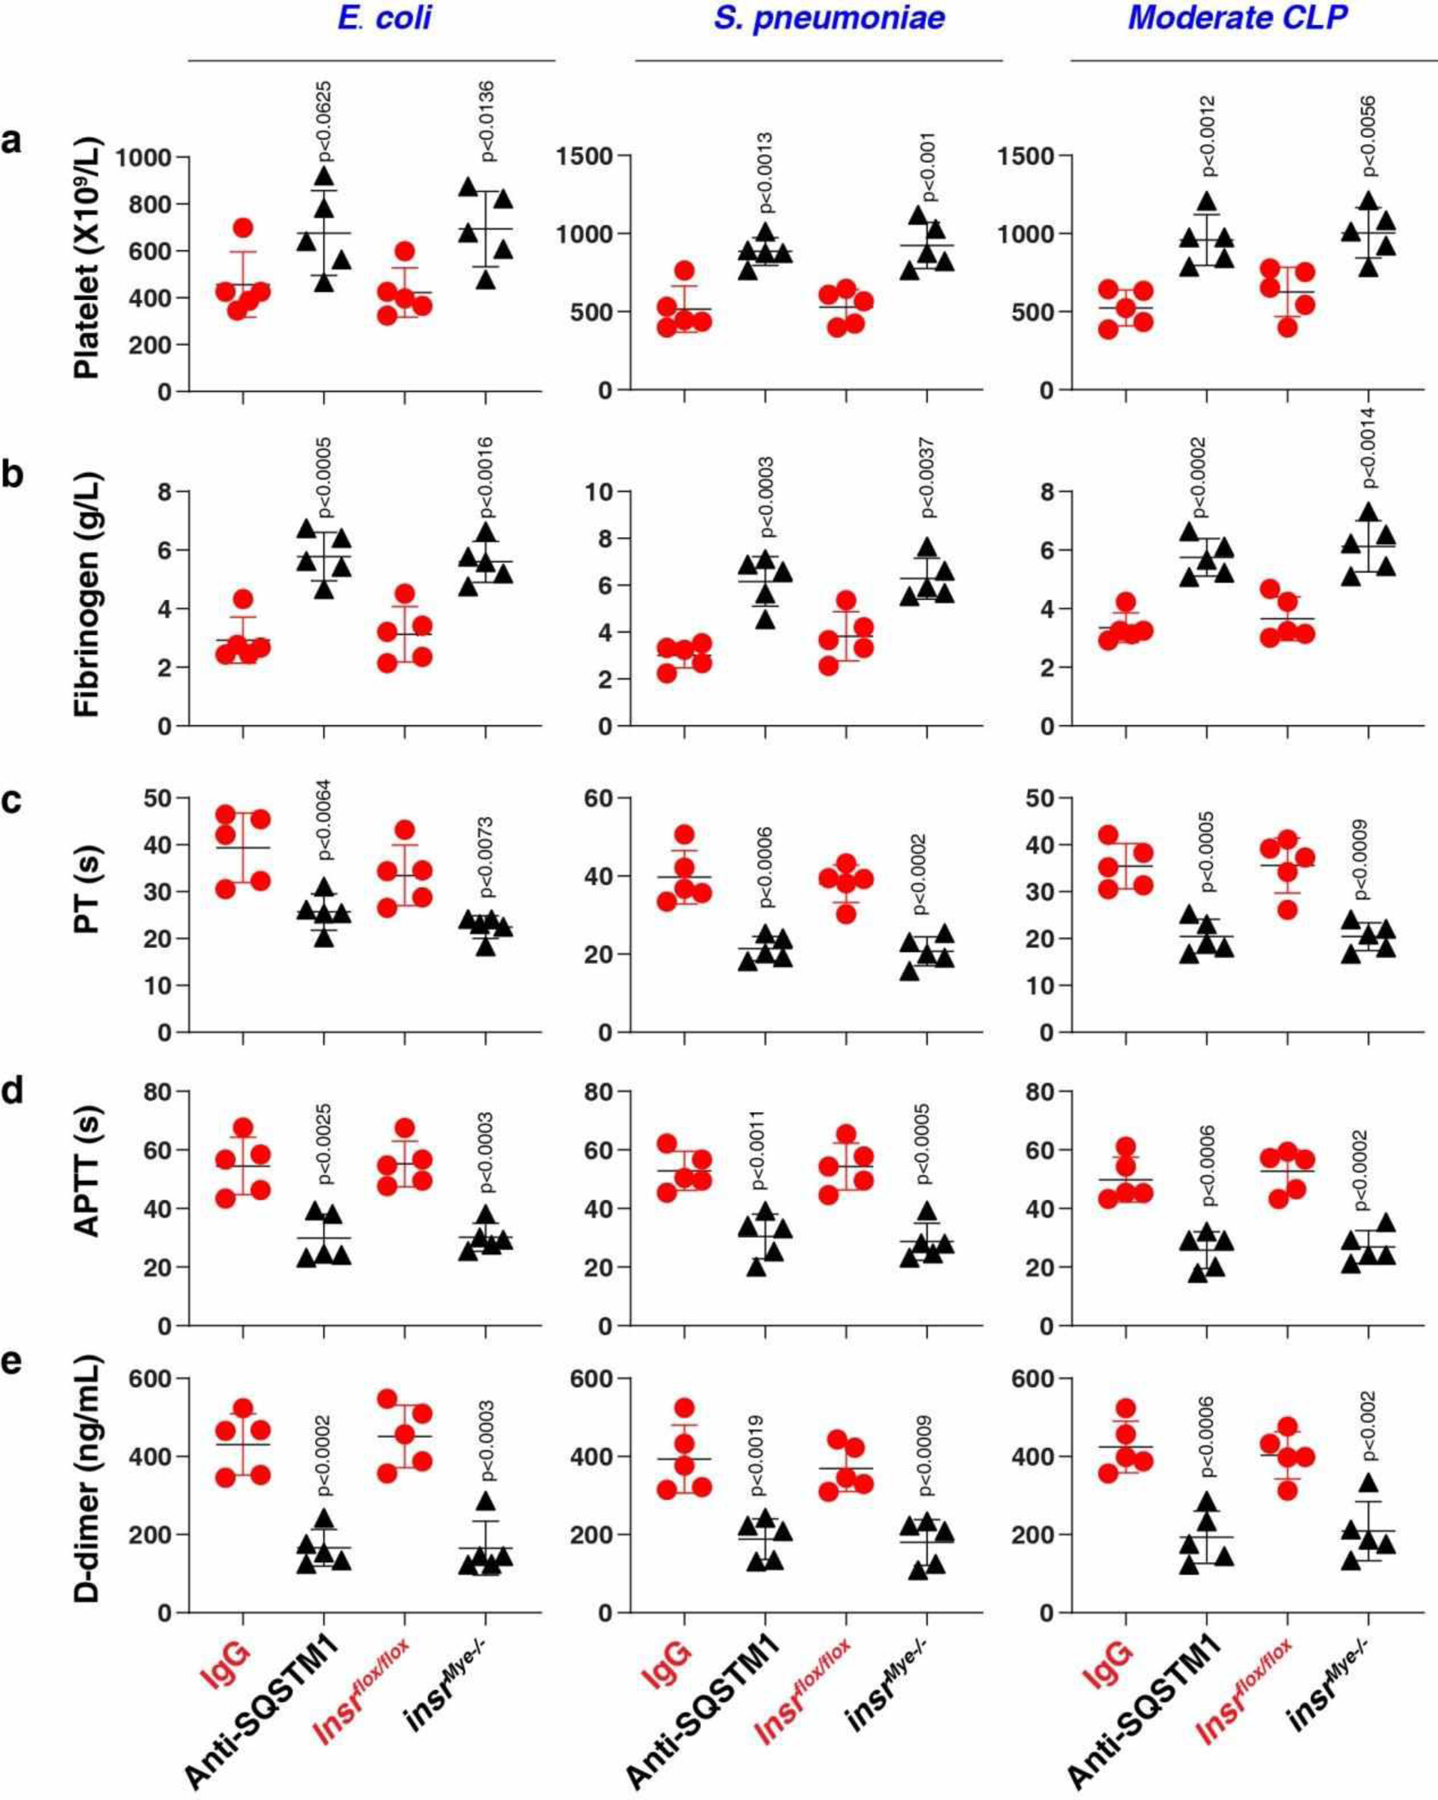
The levels of blood markers of DIC (a-e) were assayed at 72 h in the indicated mice in E. coli or S. pneumoniae infection or clinically relevant moderate CLP-induced sepsis (n = 5 mice/group; two-tailed t test, versus control group). Data in (a-e) are presented as mean ± SD from two independent experiments.
Extended Data Fig. 10. Association of the SQSTM1-INSR axis with the severity of sepsis in patients.
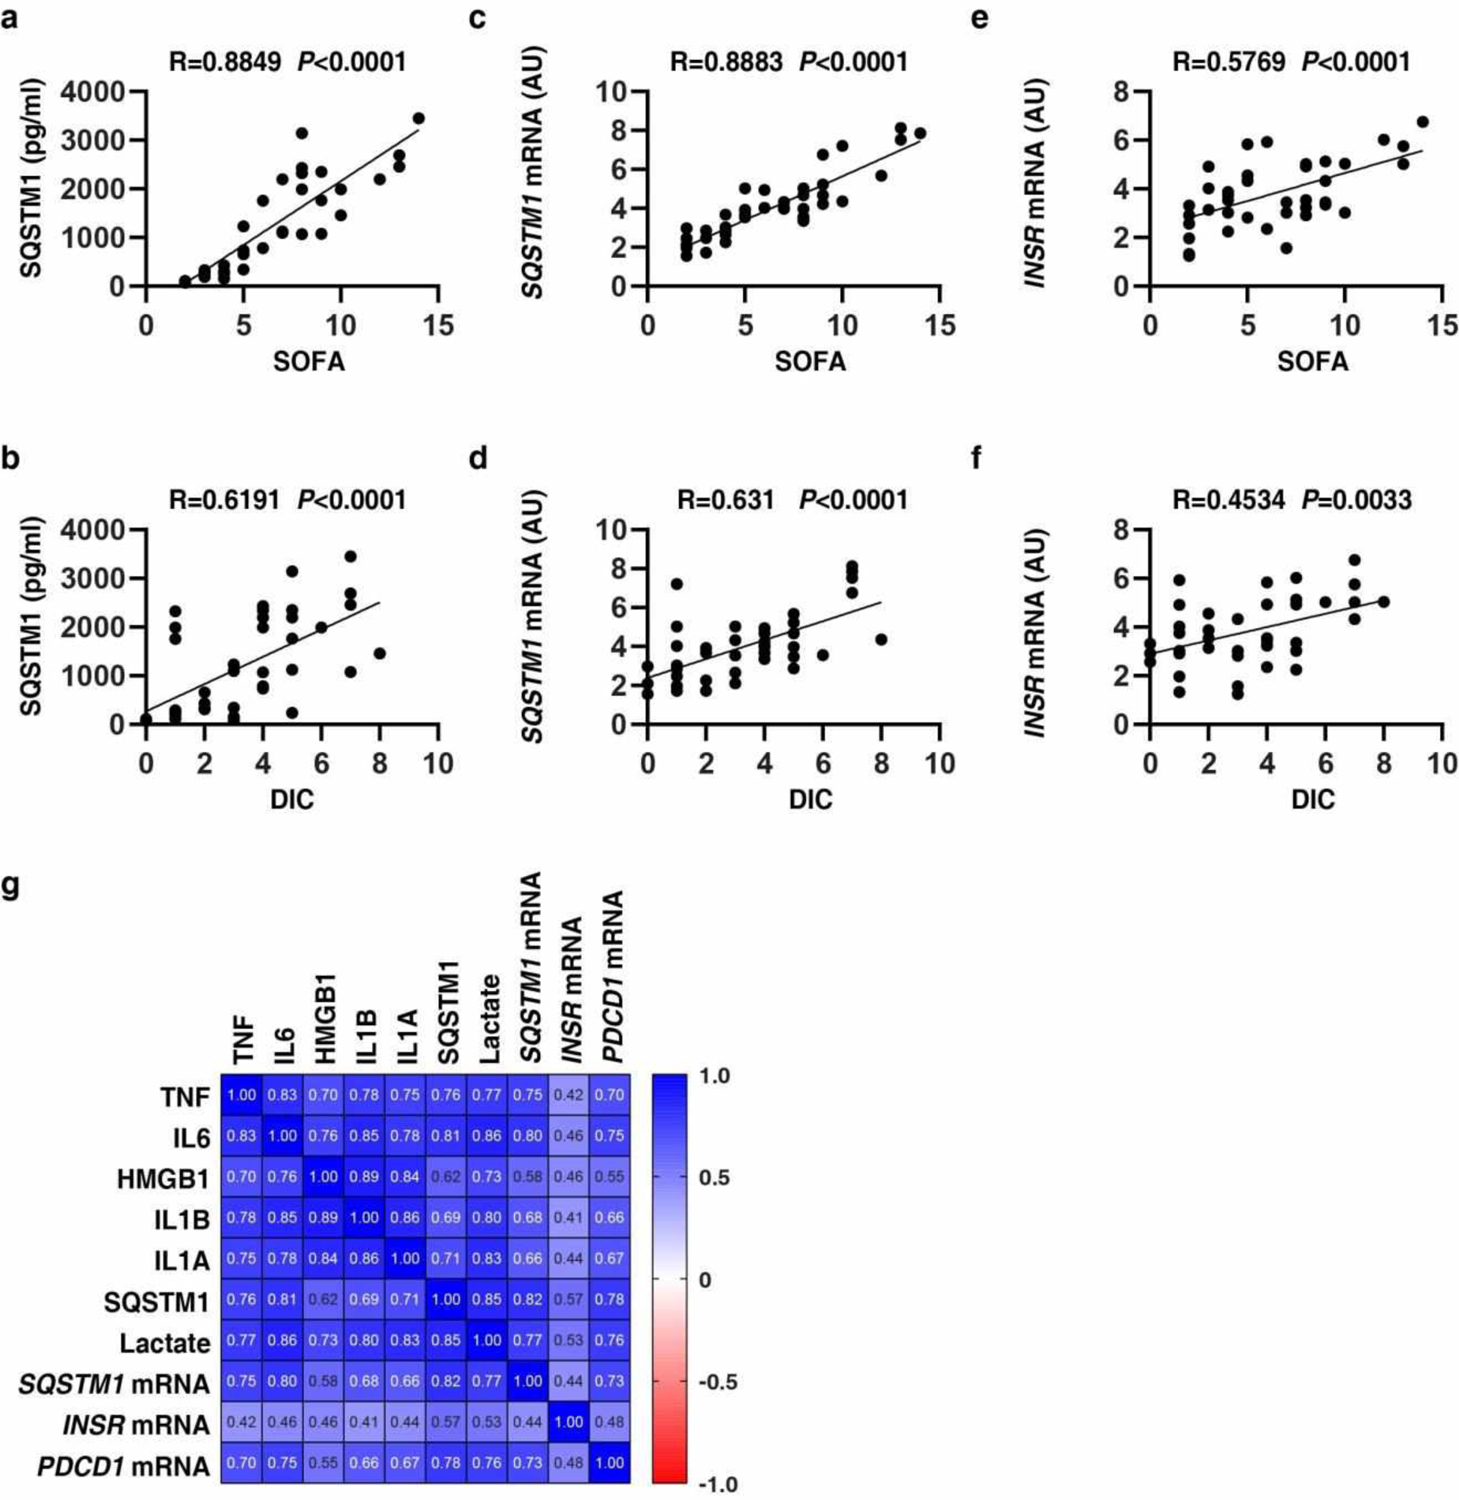
(a-f) The correlation assay between SQSTM1, INSR, SOFA, and DIC score in patients with sepsis and septic shock (n=40 cases). (g) Pearson correlation heatmap of immune mediators.
Supplementary Material
Acknowledgments
We thank Dave Primm (Department of Surgery, University of Texas Southwestern Medical Center) for his critical reading of the manuscript. G.K. is supported by the Ligue contre le Cancer (équipe labellisée); Agence National de la Recherche (ANR) - Projets blancs; ANR under the frame of E-Rare-2, the ERA-Net for Research on Rare Diseases; Association pour la recherche sur le cancer (ARC); Cancéropôle Ile-de-France; Chancelerie des universités de Paris (Legs Poix), Fondation pour la Recherche Médicale (FRM); a donation by Elior; European Research Area Network on Cardiovascular Diseases (ERA-CVD, MINOTAUR); Gustave Roussy Odyssea, the European Union Horizon 2020 Project Oncobiome; Fondation Carrefour; High-end Foreign Expert Program in China (GDW20171100085 and GDW20181100051), Institut National du Cancer (INCa); Inserm (HTE); Institut Universitaire de France; LeDucq Foundation; the LabEx Immuno-Oncology; the RHU Torino Lumière; the Seerave Foundation; the SIRIC Stratified Oncology Cell DNA Repair and Tumor Immune Elimination (SOCRATE); and the SIRIC Cancer Research and Personalized Medicine (CARPEM). J.L. is supported by grants from the National Natural Science Foundation of China (31671435, 81400132, and 81772508). J.J. is supported by grants from the National Natural Science Foundation of China (81530063). L.Z. is supported by the Excellent Youth Grant of State Key Laboratory of Trauma, Burns, and Combined Injury of China (SKLYQ201901).
Footnotes
Competing interests
No potential conflicts of interest were disclosed.
Data availability
The authors declare that all data supporting the findings of this study are available within the article and its supplementary information, or available from the corresponding author upon reasonable request.
Code availability
This study did not generate any unique code.
References
- 1.Singer M, et al. The Third International Consensus Definitions for Sepsis and Septic Shock (Sepsis-3). JAMA 315, 801–810 (2016). [DOI] [PMC free article] [PubMed] [Google Scholar]
- 2.Hotchkiss RS, et al. Sepsis and septic shock. Nat Rev Dis Primers 2, 16045 (2016). [DOI] [PMC free article] [PubMed] [Google Scholar]
- 3.Deretic V, Saitoh T & Akira S Autophagy in infection, inflammation and immunity. Nat Rev Immunol 13, 722–737 (2013). [DOI] [PMC free article] [PubMed] [Google Scholar]
- 4.Levine B, Mizushima N & Virgin HW Autophagy in immunity and inflammation. Nature 469, 323–335 (2011). [DOI] [PMC free article] [PubMed] [Google Scholar]
- 5.Klionsky DJ & Emr SD Autophagy as a regulated pathway of cellular degradation. Science 290, 1717–1721 (2000). [DOI] [PMC free article] [PubMed] [Google Scholar]
- 6.Levine B & Kroemer G Biological Functions of Autophagy Genes: A Disease Perspective. Cell 176, 11–42 (2019). [DOI] [PMC free article] [PubMed] [Google Scholar]
- 7.Xie Y, et al. Posttranslational modification of autophagy-related proteins in macroautophagy. Autophagy 11, 28–45 (2015). [DOI] [PMC free article] [PubMed] [Google Scholar]
- 8.Dikic I & Elazar Z Mechanism and medical implications of mammalian autophagy. Nat Rev Mol Cell Biol 19, 349–364 (2018). [DOI] [PubMed] [Google Scholar]
- 9.Cho SJ, et al. Plasma ATG5 is increased in Alzheimer’s disease. Sci Rep 9, 4741 (2019). [DOI] [PMC free article] [PubMed] [Google Scholar]
- 10.Castellazzi M, et al. Correlation between auto/mitophagic processes and magnetic resonance imaging activity in multiple sclerosis patients. J Neuroinflammation 16, 131 (2019). [DOI] [PMC free article] [PubMed] [Google Scholar]
- 11.Naguib M & Rashed LA Serum level of the autophagy biomarker Beclin-1 in patients with diabetic kidney disease. Diabetes Res Clin Pract 143, 56–61 (2018). [DOI] [PubMed] [Google Scholar]
- 12.Wang X, et al. Defective lysosomal clearance of autophagosomes and its clinical implications in nonalcoholic steatohepatitis. FASEB J 32, 37–51 (2018). [DOI] [PubMed] [Google Scholar]
- 13.Kim JY & Ozato K The sequestosome 1/p62 attenuates cytokine gene expression in activated macrophages by inhibiting IFN regulatory factor 8 and TNF receptor-associated factor 6/NF-kappaB activity. J Immunol 182, 2131–2140 (2009). [DOI] [PMC free article] [PubMed] [Google Scholar]
- 14.Ponpuak M, et al. Delivery of cytosolic components by autophagic adaptor protein p62 endows autophagosomes with unique antimicrobial properties. Immunity 32, 329–341 (2010). [DOI] [PMC free article] [PubMed] [Google Scholar]
- 15.Zheng YT, et al. The adaptor protein p62/SQSTM1 targets invading bacteria to the autophagy pathway. J Immunol 183, 5909–5916 (2009). [DOI] [PubMed] [Google Scholar]
- 16.Fujita K, Maeda D, Xiao Q & Srinivasula SM Nrf2-mediated induction of p62 controls Toll-like receptor-4-driven aggresome-like induced structure formation and autophagic degradation. Proc Natl Acad Sci U S A 108, 1427–1432 (2011). [DOI] [PMC free article] [PubMed] [Google Scholar]
- 17.Lee HM, et al. Autophagy negatively regulates keratinocyte inflammatory responses via scaffolding protein p62/SQSTM1. J Immunol 186, 1248–1258 (2011). [DOI] [PubMed] [Google Scholar]
- 18.Duran A, et al. The signaling adaptor p62 is an important NF-kappaB mediator in tumorigenesis. Cancer Cell 13, 343–354 (2008). [DOI] [PubMed] [Google Scholar]
- 19.Wooten MW, et al. The p62 scaffold regulates nerve growth factor-induced NF-kappaB activation by influencing TRAF6 polyubiquitination. J Biol Chem 280, 35625–35629 (2005). [DOI] [PubMed] [Google Scholar]
- 20.Wang H, et al. HMG-1 as a late mediator of endotoxin lethality in mice. Science 285, 248–251 (1999). [DOI] [PubMed] [Google Scholar]
- 21.Kang R, et al. HMGB1 in health and disease. Mol Aspects Med 40, 1–116 (2014). [DOI] [PMC free article] [PubMed] [Google Scholar]
- 22.Hesse DG, et al. Cytokine appearance in human endotoxemia and primate bacteremia. Surg Gynecol Obstet 166, 147–153 (1988). [PubMed] [Google Scholar]
- 23.Poltorak A, et al. Defective LPS signaling in C3H/HeJ and C57BL/10ScCr mice: mutations in Tlr4 gene. Science 282, 2085–2088 (1998). [DOI] [PubMed] [Google Scholar]
- 24.Kawai T, et al. Lipopolysaccharide stimulates the MyD88-independent pathway and results in activation of IFN-regulatory factor 3 and the expression of a subset of lipopolysaccharide-inducible genes. J Immunol 167, 5887–5894 (2001). [DOI] [PubMed] [Google Scholar]
- 25.Vanlandingham PA & Ceresa BP Rab7 regulates late endocytic trafficking downstream of multivesicular body biogenesis and cargo sequestration. J Biol Chem 284, 12110–12124 (2009). [DOI] [PMC free article] [PubMed] [Google Scholar]
- 26.Dong XP, et al. The type IV mucolipidosis-associated protein TRPML1 is an endolysosomal iron release channel. Nature 455, 992–996 (2008). [DOI] [PMC free article] [PubMed] [Google Scholar]
- 27.Ubersax JA & Ferrell JE Jr. Mechanisms of specificity in protein phosphorylation. Nat Rev Mol Cell Biol 8, 530–541 (2007). [DOI] [PubMed] [Google Scholar]
- 28.Matsumoto G, Wada K, Okuno M, Kurosawa M & Nukina N Serine 403 phosphorylation of p62/SQSTM1 regulates selective autophagic clearance of ubiquitinated proteins. Mol Cell 44, 279–289 (2011). [DOI] [PubMed] [Google Scholar]
- 29.Pilli M, et al. TBK-1 promotes autophagy-mediated antimicrobial defense by controlling autophagosome maturation. Immunity 37, 223–234 (2012). [DOI] [PMC free article] [PubMed] [Google Scholar]
- 30.Perry AK, Chow EK, Goodnough JB, Yeh WC & Cheng G Differential requirement for TANK-binding kinase-1 in type I interferon responses to toll-like receptor activation and viral infection. J Exp Med 199, 1651–1658 (2004). [DOI] [PMC free article] [PubMed] [Google Scholar]
- 31.Heipertz EL, Harper J & Walker WE STING and TRIF Contribute to Mouse Sepsis, Depending on Severity of the Disease Model. Shock 47, 621–631 (2017). [DOI] [PubMed] [Google Scholar]
- 32.Hu Q, et al. STING-mediated intestinal barrier dysfunction contributes to lethal sepsis. EBioMedicine 41, 497–508 (2019). [DOI] [PMC free article] [PubMed] [Google Scholar]
- 33.Zeng L, et al. ALK is a therapeutic target for lethal sepsis. Sci Transl Med 9(2017). [DOI] [PMC free article] [PubMed] [Google Scholar]
- 34.Zhang H, et al. TMEM173 Drives Lethal Coagulation in Sepsis. Cell Host Microbe 27, 556–570 e556 (2020). [DOI] [PMC free article] [PubMed] [Google Scholar]
- 35.Xia P, et al. Sox2 functions as a sequence-specific DNA sensor in neutrophils to initiate innate immunity against microbial infection. Nat Immunol 16, 366–375 (2015). [DOI] [PubMed] [Google Scholar]
- 36.Shi J, et al. Inflammatory caspases are innate immune receptors for intracellular LPS. Nature 514, 187–192 (2014). [DOI] [PubMed] [Google Scholar]
- 37.Orning P, et al. Pathogen blockade of TAK1 triggers caspase-8-dependent cleavage of gasdermin D and cell death. Science 362, 1064–1069 (2018). [DOI] [PMC free article] [PubMed] [Google Scholar]
- 38.Sarhan J, et al. Caspase-8 induces cleavage of gasdermin D to elicit pyroptosis during Yersinia infection. Proc Natl Acad Sci U S A 115, E10888–E10897 (2018). [DOI] [PMC free article] [PubMed] [Google Scholar]
- 39.Freemerman AJ, et al. Metabolic reprogramming of macrophages: glucose transporter 1 (GLUT1)-mediated glucose metabolism drives a proinflammatory phenotype. J Biol Chem 289, 7884–7896 (2014). [DOI] [PMC free article] [PubMed] [Google Scholar]
- 40.Lu Q & Lemke G Homeostatic regulation of the immune system by receptor tyrosine kinases of the Tyro 3 family. Science 293, 306–311 (2001). [DOI] [PubMed] [Google Scholar]
- 41.Chaudhuri A Regulation of Macrophage Polarization by RON Receptor Tyrosine Kinase Signaling. Front Immunol 5, 546 (2014). [DOI] [PMC free article] [PubMed] [Google Scholar]
- 42.Liu CP, et al. NF-kappaB pathways are involved in M1 polarization of RAW 264.7 macrophage by polyporus polysaccharide in the tumor microenvironment. PLoS One 12, e0188317 (2017). [DOI] [PMC free article] [PubMed] [Google Scholar]
- 43.Mauro C, et al. NF-kappaB controls energy homeostasis and metabolic adaptation by upregulating mitochondrial respiration. Nat Cell Biol 13, 1272–1279 (2011). [DOI] [PMC free article] [PubMed] [Google Scholar]
- 44.Spec A, et al. T cells from patients with Candida sepsis display a suppressive immunophenotype. Crit Care 20, 15 (2016). [DOI] [PMC free article] [PubMed] [Google Scholar]
- 45.Moscat J, Karin M & Diaz-Meco MT p62 in Cancer: Signaling Adaptor Beyond Autophagy. Cell 167, 606–609 (2016). [DOI] [PMC free article] [PubMed] [Google Scholar]
- 46.Sanchez-Martin P, Saito T & Komatsu M p62/SQSTM1: ‘Jack of all trades’ in health and cancer. FEBS J 286, 8–23 (2019). [DOI] [PMC free article] [PubMed] [Google Scholar]
- 47.Barber GN STING: infection, inflammation and cancer. Nat Rev Immunol 15, 760–770 (2015). [DOI] [PMC free article] [PubMed] [Google Scholar]
- 48.Gaidt MM, et al. The DNA Inflammasome in Human Myeloid Cells Is Initiated by a STING-Cell Death Program Upstream of NLRP3. Cell 171, 1110–1124 e1118 (2017). [DOI] [PMC free article] [PubMed] [Google Scholar]
- 49.Li N, et al. STING-IRF3 contributes to lipopolysaccharide-induced cardiac dysfunction, inflammation, apoptosis and pyroptosis by activating NLRP3. Redox Biol 24, 101215 (2019). [DOI] [PMC free article] [PubMed] [Google Scholar]
- 50.Han S, et al. Macrophage insulin receptor deficiency increases ER stress-induced apoptosis and necrotic core formation in advanced atherosclerotic lesions. Cell Metab 3, 257–266 (2006). [DOI] [PubMed] [Google Scholar]
- 51.Mauer J, et al. Myeloid cell-restricted insulin receptor deficiency protects against obesity-induced inflammation and systemic insulin resistance. PLoS Genet 6, e1000938 (2010). [DOI] [PMC free article] [PubMed] [Google Scholar]
- 52.Kang R, et al. Lipid Peroxidation Drives Gasdermin D-Mediated Pyroptosis in Lethal Polymicrobial Sepsis. Cell Host Microbe 24, 97–108 e104 (2018). [DOI] [PMC free article] [PubMed] [Google Scholar]
- 53.Peng T, et al. Disruption of phospholipase Cgamma1 signalling attenuates cardiac tumor necrosis factor-alpha expression and improves myocardial function during endotoxemia. Cardiovasc Res 78, 90–97 (2008). [DOI] [PubMed] [Google Scholar]
- 54.Weischenfeldt J & Porse B Bone Marrow-Derived Macrophages (BMM): Isolation and Applications. CSH Protoc 2008, pdb prot5080 (2008). [DOI] [PubMed] [Google Scholar]
- 55.Kang R, et al. A novel PINK1- and PARK2-dependent protective neuroimmune pathway in lethal sepsis. Autophagy 12, 2374–2385 (2016). [DOI] [PMC free article] [PubMed] [Google Scholar]
- 56.Deng W, et al. The Circadian Clock Controls Immune Checkpoint Pathway in Sepsis. Cell Rep 24, 366–378 (2018). [DOI] [PMC free article] [PubMed] [Google Scholar]
- 57.Yang L, et al. PKM2 regulates the Warburg effect and promotes HMGB1 release in sepsis. Nat Commun 5, 4436 (2014). [DOI] [PMC free article] [PubMed] [Google Scholar]
- 58.Chen R, et al. cAMP metabolism controls caspase-11 inflammasome activation and pyroptosis in sepsis. Sci Adv 5, eaav5562 (2019). [DOI] [PMC free article] [PubMed] [Google Scholar]
- 59.Hagar JA, Powell DA, Aachoui Y, Ernst RK & Miao EA Cytoplasmic LPS activates caspase-11: implications in TLR4-independent endotoxic shock. Science 341, 1250–1253 (2013). [DOI] [PMC free article] [PubMed] [Google Scholar]
- 60.Kayagaki N, et al. Noncanonical inflammasome activation by intracellular LPS independent of TLR4. Science 341, 1246–1249 (2013). [DOI] [PubMed] [Google Scholar]
- 61.Taylor FB Jr., et al. Towards definition, clinical and laboratory criteria, and a scoring system for disseminated intravascular coagulation. Thromb Haemost 86, 1327–1330 (2001). [PubMed] [Google Scholar]
- 62.Zhu S, et al. HSPA5 Regulates Ferroptotic Cell Death in Cancer Cells. Cancer Res 77, 2064–2077 (2017). [DOI] [PMC free article] [PubMed] [Google Scholar]
- 63.Song X, et al. AMPK-Mediated BECN1 Phosphorylation Promotes Ferroptosis by Directly Blocking System Xc(-) Activity. Curr Biol 28, 2388–2399 e2385 (2018). [DOI] [PMC free article] [PubMed] [Google Scholar]
- 64.Tang D, et al. Endogenous HMGB1 regulates autophagy. J Cell Biol 190, 881–892 (2010). [DOI] [PMC free article] [PubMed] [Google Scholar]
- 65.Tang D, et al. High-mobility group box 1 is essential for mitochondrial quality control. Cell Metab 13, 701–711 (2011). [DOI] [PMC free article] [PubMed] [Google Scholar]
- 66.Tan JMJ, et al. An ATG16L1-dependent pathway promotes plasma membrane repair and limits Listeria monocytogenes cell-to-cell spread. Nat Microbiol 3, 1472–1485 (2018). [DOI] [PubMed] [Google Scholar]
Associated Data
This section collects any data citations, data availability statements, or supplementary materials included in this article.


