Abstract
Infective endocarditis (IE) can present with variable clinical and imaging findings and is associated with high morbidity and mortality. Substantial improvement of CT technology, most notably improved temporal and spatial resolution, has resulted in increased use of this modality in the evaluation of IE. The aim of this article is to review the potential role of cardiac CT in evaluating IE.
Supplemental material is available for this article.
© RSNA, 2021
Summary
Cardiac CT has a complementary role to echocardiography in the workup of infective endocarditis and is a valuable tool for patients who have contraindications to transesophageal echocardiography and in those who are strongly suspected of having infective endocarditis but have suboptimal echocardiography results because of calcifications or prosthetic valves.
Essentials
■ There has been an increased use of cardiac CT in the assessment of infective endocarditis (IE) and associated local complications and in the preoperative assessment of coronary arteries and the thoracic aorta.
■ Electrocardiographically synchronized cardiac CT examination with thin-section reconstruction is at least equivalent to transesophageal echocardiography (TEE) in depicting abscesses, as well as pseudoaneurysms, and combining the two modalities allows for further improved sensitivity in diagnosis.
■ TEE is superior to cardiac CT in depicting small vegetations (<10 mm), valvular leaflet perforations, and perivalvular leaks, although cardiac CT can be a useful adjunct in demonstrating these findings when TEE is nondiagnostic or contraindicated.
■ Awareness of typical imaging findings, appropriate protocols, and the relative limitations of cardiac CT will facilitate improved use of this modality in suspected IE.
Introduction
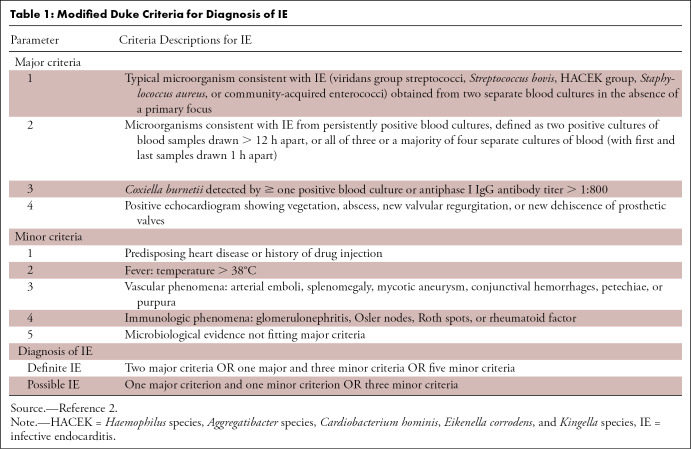
Infective endocarditis (IE) is infection of the endocardium. It commonly affects the valve and chordae tendineae, as well as surfaces of prosthetic valves and implanted cardiac devices (1). Diagnosis of IE is usually based on modified Duke criteria (Table 1) (2). Transthoracic echocardiography is the first-line modality used to assess for IE. Transesophageal echocardiography (TEE) has superior temporal and spatial resolution and is usually used in the evaluation of IE (3). The improved temporal and spatial resolution of electrocardiographically (ECG) synchronized cardiac CT has resulted in increasing use of CT in the setting of IE (4–14). The aim of this article was to review the potential role of cardiac CT in evaluating IE.
Table 1:
Modified Duke Criteria for Diagnosis of IE
Role of Cardiac CT
Cardiac CT has a complementary role to echocardiography in the workup of IE and does not replace echocardiography. However, cardiac CT is valuable in patients who have contraindications to TEE and in patients who are strongly suspected of having IE but have suboptimal echocardiography results because of calcifications or prosthetic valves. Cardiac CT has been incorporated into the 2015 European Society of Cardiology modified diagnostic criteria for IE (3).
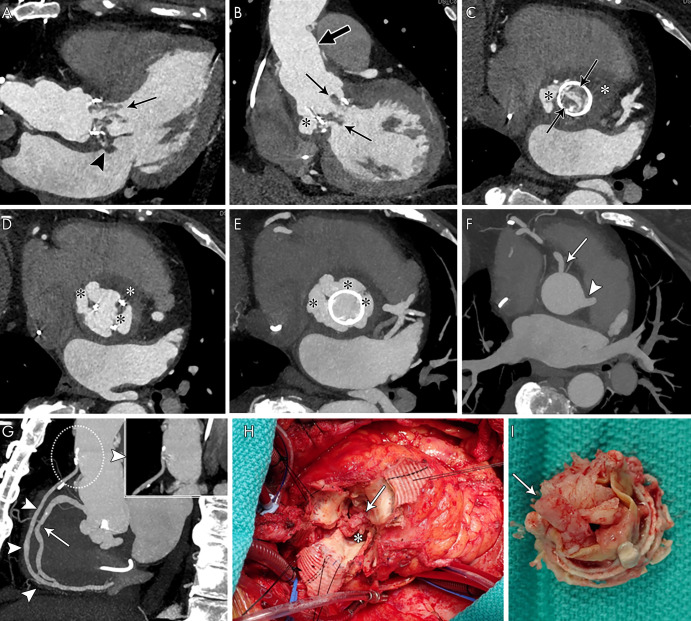
Coronary CT angiography is appropriate for assessment of coronary artery disease before noncardiac surgery in patients with intermediate pretest probability (15) and has a high diagnostic accuracy in excluding clinically significant coronary stenosis in patients undergoing valve surgery (16). Therefore, coronary CT angiography is a practical diagnostic step to assess perivalvular extension, coronary arterial anatomy, and coronary artery disease simultaneously prior to cardiac surgery for IE (Fig 1).
Figure 1:
Coronary CT angiography was requested for preoperative evaluation of a perivalvular extension and native coronary arteries and aortocoronary graft in a 67-year-old woman. A, Three-chamber, B, oblique coronal, and, C, D, aortic valve and root short-axis contrast-enhanced CT images show aortic bioprosthesis valve leaflet thickening with nodular and linear hypoattenuation extending into the left ventricular outflow tract (vegetations, arrows) and aortic root pseudoaneurysm (black *) with a low attenuation area suggesting abscess (white *). There is abnormal nodular hypoattenuation with focal contrast material outpouching from the septal aspect of the left atrium near the mitral annulus, likely an extension of the adjacent aortic root abscess (arrowhead, A). Supracoronary graft is noted (thick arrow, B). E, F, Aortic root short-axis maximum intensity projection shows the aortic root pseudoaneurysm (black *) and intact right coronary artery (solid arrow) and left main coronary artery (arrowheads). G, Oblique sagittal maximum intensity projection image shows a widely patent aortocoronary graft from proximal native ascending aorta to distal (arrowheads, dashed circle with magnified thin-section image shows patent graft origin and proximal course) and midright coronary artery stenosis (25%–50% narrowing, arrow). H, I, Intraoperative images show bioprosthetic aortic valve vegetations (arrows) and aortic root pseudoaneurysm and abscess (*).
Cardiac CT Protocol
ECG-synchronized cardiac CT imaging with acquired sections sufficiently thin (commonly 0.60–0.75 mm) to provide an isotropic data set is required for motion-free assessment of the cardiac structures and three-dimensional multiplanar reformatting of images (17). Whereas coronary CT angiography images are often acquired prospectively triggered, during diastole only, multiphase imaging (through retrospectively ECG-gated or wide window ECG-triggered image acquisition) is preferred for evaluation of IE (4–11). The isotropic CT data allow reconstruction in any desired orientation. Acquiring images at different points in the heart cycle adds a fourth dimension (4D)—time. Cine images can be displayed using the 4D data set (0%–100% reconstruction at 5%–10% intervals) in any reconstructed view by combining the 10–20 cardiac phases for qualitative assessment of valve leaflet motion and planimetry (Movies 1 and 2 [supplement]). Cardiac orientations that are analogous to standard echocardiographic short-axis and long-axis views can be reconstructed and allow one-on-one correlation of both techniques.
Movie 1:
Cine images of a 4D CT of the aortic valve in an 83-year-old male patient show bioprosthetic valve leaflet thickening with mobile nodular leaflet hypoattenuation (vegetations), a large soft-tissue low-attenuation area surrounding the aortic root consistent with periaortic abscess, and LVOT pseudoaneurysm.
Movie 2:
Cine images of a 4D CT of the aortic valve of a 58-year-old male patient show bioprosthetic valve leaflet thickening, aortic root pseudoaneurysm, and prosthetic valve dehiscence.
Cardiac CT examination preparations and acquisition techniques are similar to those of coronary CT angiography. However, contrast agent injection should be tailored to the expected cardiac sites involved (eg, for suspected tricuspid endocarditis, contrast enhancement of the right atrium and ventricle is indicated) (17,18). In our practice, premedication with chronotropic agents or vasodilators are not often used in patients with IE. Radiation dose with retrospectively ECG-gated acquisition can be high, which is a more pressing concern in younger patients. Methods to decrease the radiation exposure include the use of low tube voltage scanning, iterative reconstruction, and ECG-controlled tube current modulation (19). However, the latter may limit assessment of cardiac valve motion or vegetations during the phase of reduced tube current (20).
The scanning range of a cardiac CT scan typically extends from the carina to the cardiac apex. CT angiography of the entire chest is often subsequently performed for complete assessment of the thoracic aorta and chest, including the entire leads and generator in the event of suspected pacemaker or implantable cardioverter defibrillator IE. Faure et al (21) reported a dedicated three-phase acquisition protocol providing unenhanced imaging of the valve region, dynamic wide window prospective ECG-triggered CT angiography of the heart, and late phase imaging of the entire thorax with a mean dose of 8.3 mSv.
Cardiac CT Findings in IE
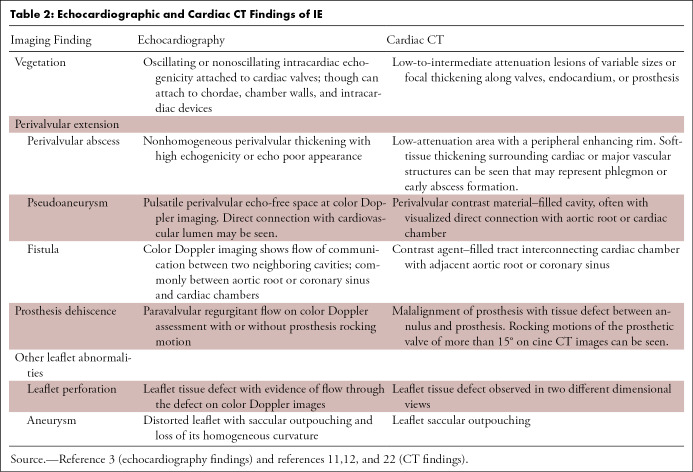
In patients with clinical and laboratory findings suggestive of IE, supportive CT findings include vegetation, prosthetic valve dehiscence, and perivalvular extension including abscess, pseudoaneurysm, and fistula (Table 2) (11,12,22).
Table 2:
Echocardiographic and Cardiac CT Findings of IE
Vegetations
A vegetation is an infected soft-tissue lesion attached to an endocardial surface or to an intracardiac prosthesis. At echocardiography, vegetations appear as an oscillating or nonoscillating echogenicity usually attached to cardiac valves. Vegetations can be involved in other locations such as the chordae, chamber walls, or intracardiac devices (3).
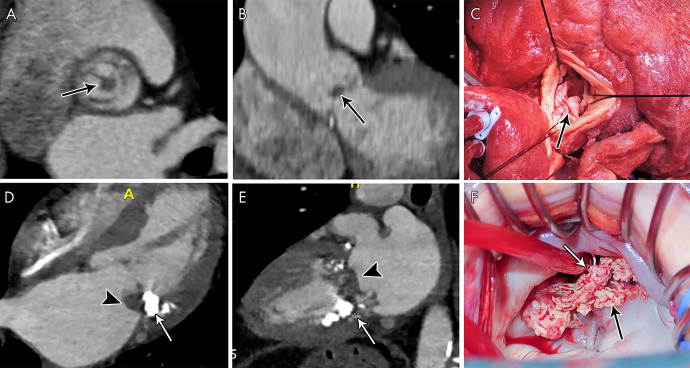
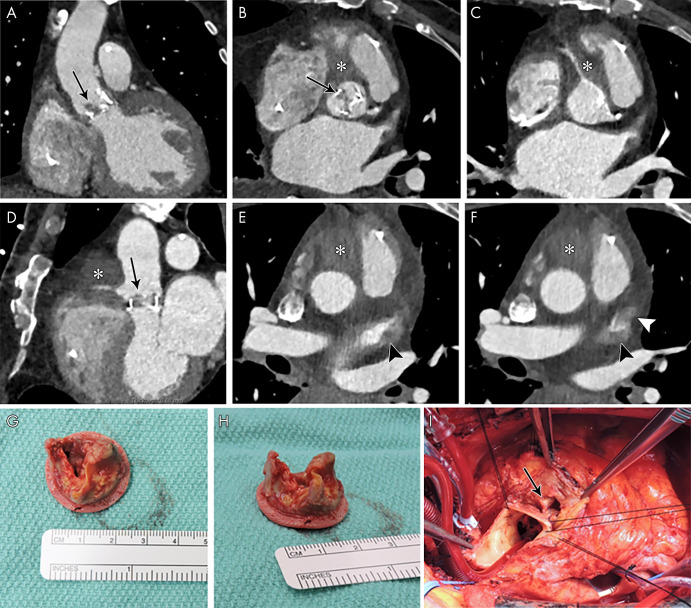
At CT, vegetations appear as low-to-intermediate attenuation lesions of variable sizes or as focal thickening along the valve, endocardium, or prosthesis (Figs 1–6) (11,12,22). The migration of vegetations can result in embolic events. Large (>10 mm) and mobile vegetations are associated with a higher risk of embolization (23,24).
Figure 6:
A, Short-axis and, B, C, oblique long-axis contrast-enhanced CT images in a 71-year-old woman show transcatheter aortic valve replacement (TAVR) with a partially obstructing eccentric low-attenuation area compatible with vegetation (*); an adjacent heterogeneous ill-defined low-attenuation area that is partially filled with contrast material (arrows), likely representing abscess and/or pseudoaneurysm; and a contrast material–filled fistula (arrowheads) communicating with the right ventricular outflow tract (RVOT). D, Transesophageal echocardiography color Doppler image in the same patient shows echogenicity partially obstructing TAVR, reflecting vegetation (black arrow), with evidence of flow in the fistulous tract with the RVOT (white arrow, Movie 3 [supplement]).
Figure 2:
A, Short-axis and, B, oblique coronal contrast-enhanced CT images of the aortic valve in a 59-year-old man with a history of aortic valve replacement who presented with fever and stroke, concerning for infective endocarditis (IE). Images show a nodular attenuation (arrows, approximately 6 mm) along the prosthetic leaflet, suggesting vegetation. C, Intraoperative image in a 34-year-old man shows native aortic valve vegetations (arrow). D, Four-chamber and, E, two-chamber contrast-enhanced CT images in a 72-year-old woman suspected of having IE show severe mitral annular calcification (arrows) and ill-defined hypoattenuation (arrowheads) predominantly along the posterior mitral valve leaflet and the posterior mitral annulus compatible with vegetations. F, Intraoperative image in a 51-year-old man shows native mitral valve vegetations (arrows).
Movie 3:
Color Doppler echocardiography (TEE) of a 71-year-old female patient with TAVR shows echogenicity partially obstructing the TAVR (vegetation) with evidence of flow in the fistulous tract with the RVOT.
Sensitivity of TEE for depicting vegetations ranges from 85% to 100% (4–12). The presence of prosthetic valves or calcifications can pose a diagnostic challenge for detecting vegetation at TEE (3,7,11,25). Habets et al (7) reported that adding retrospective ECG-gated CT to transthoracic echocardiography or TEE led to a substantial increase in the sensitivity of vegetation detection (from 63% to 100%) in prosthetic valve endocarditis (PVE). Fagman et al (6) reported a moderate correlation between CT and TEE for vegetation detection in PVE. Feuchtner et al (4) reported 96% sensitivity and 97% specificity values for detecting vegetations with 4D CT compared with surgical findings in 29 patients with IE affecting a variety of cardiac valves. Koo et al (10) reported 91% sensitivity of 4D CT for detecting vegetations in 49 patients (12 with PVE). Gahide et al (5) compared 4D CT with intraoperative findings for aortic valve IE in 19 patients and reported 71% sensitivity and 100% specificity values for CT in identifying aortic valve vegetations (100% sensitivity for vegetations > 1 cm).
In a retrospective review of 137 patients who underwent cardiac CT (mostly 4D CT) before surgery, CT demonstrated 70% sensitivity for depicting vegetations (9). In another retrospective review of 75 patients who underwent cardiac CT and TEE, TEE demonstrated a higher detection rate for vegetations than CT (97% vs 72.0%), and small vegetations (<10 mm) were underdiagnosed at CT (53%) compared with TEE (94%) (13). In another study, a single-phase CT scan demonstrated low sensitivity (16%) for depicting vegetations and higher specificity than TEE (96% vs 69%) (12). The lower sensitivity in this cohort was likely related to the use of single-phase imaging and 3-mm section thickness compared with other studies that used thinner sections (0.6–0.7 mm) (4–6). Finally, a systematic review of eight studies assessing the comparative diagnostic accuracy of cardiac CT and TEE in depicting valvular and perivalvular complications of IE reported a higher sensitivity for TEE than for CT vegetation detection (94% vs 64%; P < .001) (14).
The differential diagnosis of valvular mass with no evidence of infection includes thrombus, fibroelastoma, and nonbacterial thrombotic endocarditis (Fig 7) (26,27). Fibroelastoma often appears as a small (<10 mm) hypoattenuated lesion attached to the cardiac valve, sometimes with a visible thin stalk (26). TEE is the modality of choice to depict fibroelastomas because of their small size and high mobility (28); MRI is not commonly required. When MRI is performed, suggestive features of a fibroelastoma include a small, highly mobile mass on a valve leaflet or endocardial surface (with or without a visible small pedicle) of hypointense signal intensity and surrounding turbulent flow on cine images (eg, steady-state free precession sequence), isointense signal intensity on T1-weighted images, and hyperintense signal intensity on T2-weighted images (29–31). Late gadolinium enhancement has been reported, but in our experience, smaller mobile lesions would restrain the value of this feature (31).
Figure 7:
A, B, Contrast-enhanced CT images in an asymptomatic 60-year-old woman show a small (3 × 4 mm) nodular hypoattenuation (arrows) with a thin stalk (arrowhead) attached to the aortic valve cusp. C, D, Four-chamber and two-chamber contrast-enhanced CT images in a 49-year-old woman with no signs of infection show a small (approximately 6 mm) nodular hypoattenuation (arrows) along the mitral valve atrial aspect. Differential diagnosis for these imaging findings includes fibroelastoma and myxoma. Thrombus and vegetation were less favored in this patient with no signs of infection or risk of thrombus formation. Both lesions were resected, and pathologic examination showed fibroelastomas.
Vegetations are usually present in the clinical context of suspected IE and cause valvular leaflet destruction and/or incompetence. Fibroelastomas are rarely associated with a valve dysfunction and are often asymptomatic, although they can be associated with systemic embolization from attached thrombi or fragmentation (28). Nonbacterial thrombotic endocarditis (marantic endocarditis) can appear as small (<10 mm) irregular densities, commonly associated with the left-sided cardiac valves and associated with an underlying malignancy or with autoimmune disease (Libman-Sacks endocarditis). Nonbacterial thrombotic endocarditis can be associated with systemic arterial embolic phenomena mimicking left-sided IE symptoms (27).
Perivalvular Extension
Perivalvular extension of IE (abscess, pseudoaneurysm, and fistula) affects 29% of native valve IE and 55% of PVE, often requires surgical management, and is associated with increased morbidity and mortality (32).
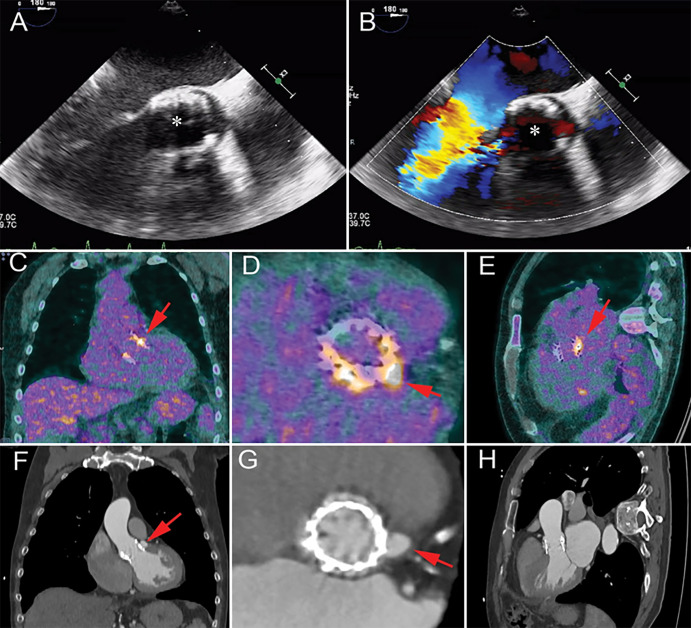
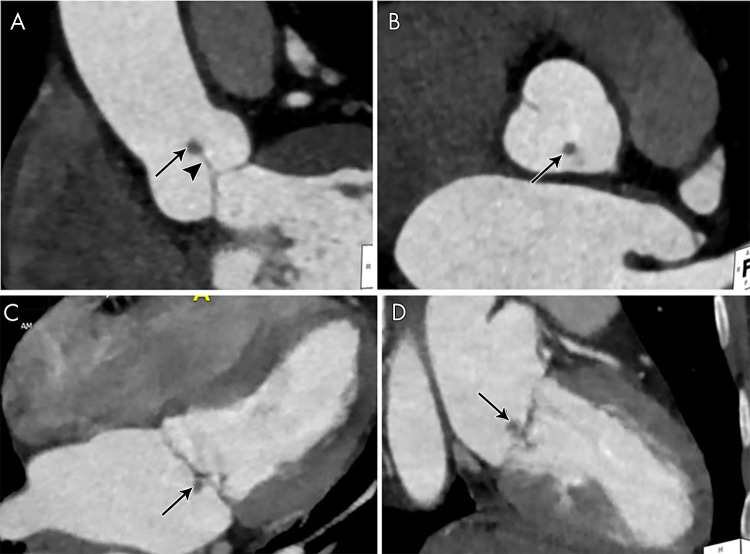
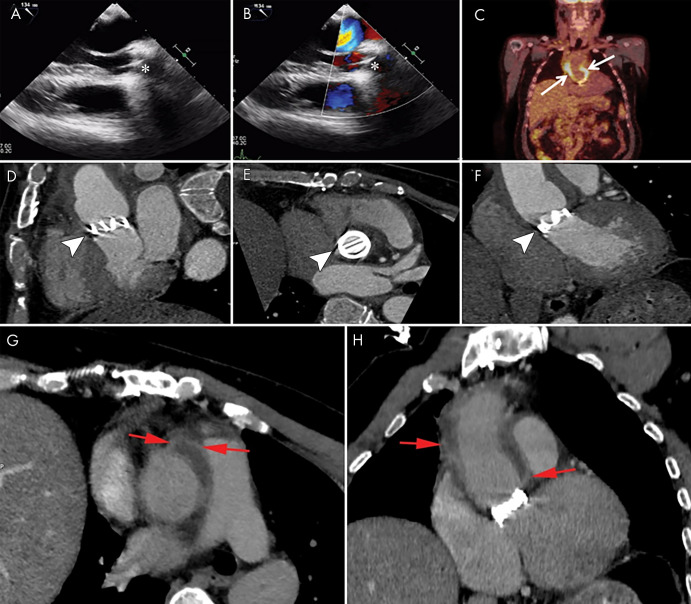
In IE, an abscess is a perivalvular cavity with necrosis and purulent material. At echocardiography, abscesses typically appear as nonhomogeneous perivalvular thickening with high echogenicity or echo poor appearance (3). At CT, abscesses are characterized by a low-attenuation central necrotic component with a peripheral enhancing rim. Phlegmon or early abscess formation can appear as soft-tissue thickening (Figs 1, 3, 4, 8) (11,12,22).
Figure 3:
A, B, Short-axis and, C, oblique coronal contrast-enhanced CT images of the aortic valve in an 83-year-old man show bioprosthetic valve leaflet thickening with mobile nodular leaflet hypoattenuation (arrows, Movie 1 [supplement]). There is a large soft-tissue low-attenuation area surrounding the aortic root consistent with a periaortic abscess (*) with left ventricular outflow tract (LVOT) pseudoaneurysm (arrowheads). D, E, Three-chamber and, F, sagittal oblique contrast-enhanced CT images in a 46-year-old man show a nodular attenuation along the valve leaflet with linear attenuation extending into the LVOT (arrowheads), and contrast material–filled pseudoaneurysm (*) arising from the LVOT and extending adjacent to the thickened intervalvular fibrosa and the anterior mitral valve leaflet base (arrows).
Figure 4:
A, Oblique coronal, B, C, short-axis, and, D, oblique sagittal contrast-enhanced CT images through aortic valve and root, and, E, F, axial contrast-enhanced CT images in a 72-year-old man show bioprosthesis leaflet thickening and calcifications with nodular attenuation reflecting vegetation (arrows), ill-defined low-attenuation area (*) anterior to the aortic root and ascending aorta that partially encases the right coronary artery compatible with abscess and phlegmon, and filling defects in the left atrial appendage (arrowheads), suggestive of thrombi (confirmed with transesophageal echocardiography). G, H, Valve vegetations are shown on the excised aortic valve bioprosthesis. I, Intraoperative image shows aortic root abscess cavity (arrow).
Figure 8:
Images show a 48-year-old man with a history of Bentall surgery with placement of a mechanical valve 3 years prior to presentation with fever and positive blood cultures for Staphylococcus aureus. A, B, Transesophageal echocardiography images show a normal appearance of the mechanical valve (*) with no signs of endocarditis. C, Fluorine 18 fluorodeoxyglucose (18F-FDG) PET/CT image shows intense 18F-FDG uptake around the aortic prosthesis (arrows). D–F, Contrast-enhanced CT images show the mechanical valve (arrowheads) and, G, H, fluid collection with enhancing rim surrounding the aortic graft compatible with abscess (red arrows).
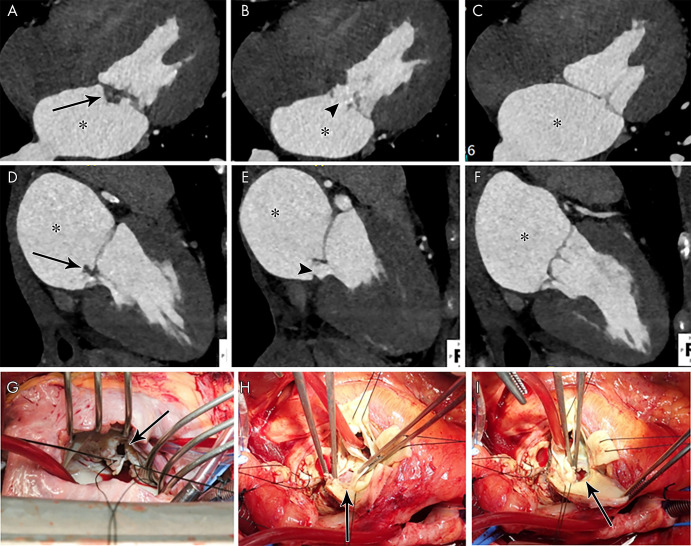
A pseudoaneurysm appears as a pulsatile perivalvular anechoic space with evidence of flow and direct communication with the cardiovascular lumen at color Doppler imaging (Fig 9) (3). At CT, a pseudoaneurysm appears as a perivalvular contrast material–filled cavity, usually with a visible direct connection with the aortic root or cardiac chambers (Figs 1, 3, 6, 9, 10) (11,12,22).
Figure 9:
A–D, From top to bottom, short-axis and oblique coronal, as well as, E, F, sagittal contrast-enhanced CT images of the aortic valve and root in a 39-year-old man show a large near-circumferential aortic root contrast agent–filled pseudoaneurysm (*) that communicates freely with the left ventricular outflow tract (LVOT) with malalignment of the bioprosthesis (arrowheads) predominantly along the posterior aspect of the valve, suggesting prosthesis dehiscence. G–I, Transesophageal echocardiography (TEE) images in the same patient show an echo poor area surrounding the posterior aspect of the prosthetic aortic valve (arrows) and communicating with the LVOT with evidence of disinsertion of the prosthetic aortic valve (arrowheads), reflecting dehiscence. Prosthetic valve leaflet thickening is noted (arrowheads). J–L, TEE color Doppler images show flow in the perivalvular echo poor area consistent with pseudoaneurysm (arrows) with perivalvular leak and severe aortic regurgitation (arrowheads, Movies 4 and 5 [supplement]).
Figure 10:
Images show a 62-year-old man with a history of transcatheter aortic valve replacement (TAVR) 6 months prior to presentation with fever and blood cultures positive for Streptococcus pneumonia. A, B, Transesophageal echocardiography images show a TAVR (*) with no signs of endocarditis. C–E, Coronal, valve short-axis, and three-chamber images from fluorine 18 fluorodeoxyglucose (18F-FDG) PET/CT performed 3 days after echocardiography show focal 18F-FDG uptake near the region of the left coronary cusp (arrows). F–H, Contrast-enhanced CT angiography images obtained after 6 weeks (patient was treated with antibiotics) show a pseudoaneurysm (arrows) at the site of aortic annulus in the same 18F-FDG uptake region.
Movie 4:
Two-dimensional echocardigraphy (TEE) of the aortic valve in a 39-year-old male patient shows prosthetic valve leaflet thickening and an echo poor area surrounding the posterior aspect of the prosthetic aortic valve that communicates with the LVOT with evidence of disinsertion of the prosthetic aortic valve, reflecting dehiscence.
Movie 5:
Color Doppler echocardiography (TEE) of the same patient in Movie 4 shows flow in the perivalvular echo poor area consistent with pseudoaneurysm with perivalvular leak and severe aortic regurgitation.
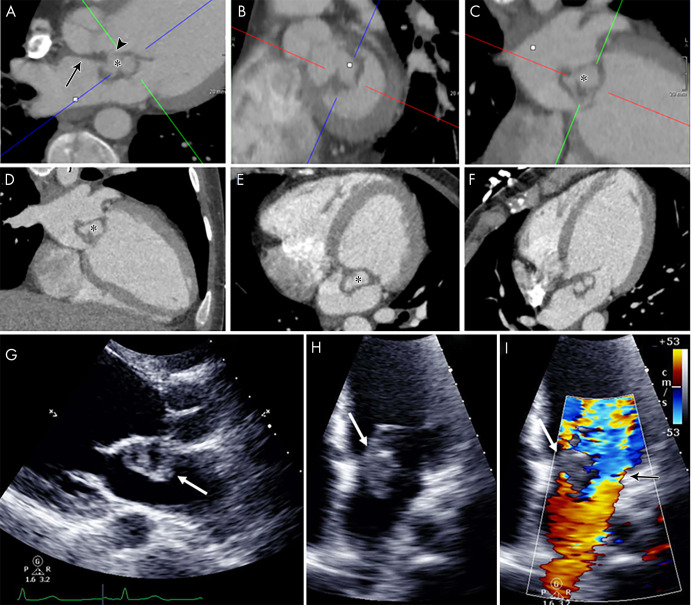
Distinguishing an abscess from a pseudoaneurysm is not always possible at imaging, particularly when echocardiography is used. Both entities may coexist, and both reflect a localized extension of IE that usually requires surgical treatment (33). The sensitivity of TEE for the detection of an abscess ranges from 80% to 90% (32,34,35). Sims et al (9) reported that CT had a sensitivity of 91% for the detection of abscess or pseudoaneurysm in 137 preoperative CT examinations (mostly 4D CT). Gahide et al (5) reported 100% sensitivity and 87.5% specificity of 4D CT for depicting pseudoaneurysm in patients with aortic valve IE, with perfect agreement with surgical findings for extension into the intervalvular fibrous body (Figs 3, 5). Oliveira et al (14) reported a higher sensitivity with CT than with TEE for abscess or pseudoaneurysm detection (78% vs 69%; P = .052), with sensitivity increased to 87% when the findings were restricted to multiphase CT studies with statistically significant difference compared with TEE (P = .04). Therefore, it is reasonable to consider CT for the evaluation of perivalvular extension given that ECG-gated CT angiography has a diagnostic value similar to that of TEE for the overall evaluation of IE and an accuracy that is equal or superior to that of TEE for the assessment of perivalvular extension of disease (4–6).
Figure 5:
A–F, Contrast-enhanced CT images in a 21-year-old man show mitral valve leaflet thickening extending into the intervalvular fibrosa (arrow, A), anterior mitral valve leaflet elongation, and a contrast material–filled cavity (*) along the atrial side of the anterior leaflet outlined by bilobed low attenuation. The appearance is compatible with valve vegetation with abscess and/or pseudoaneurysm, which appears to communicate with the left ventricular outflow tract (arrowhead, A), giving a windsock appearance. The left ventricle appears dilated. G–I, Echocardiographic images in the same patient show heterogeneous echogenicity attached to the atrial side of the thickened anterior mitral leaflet with central echo poor areas (white arrows) and severe mitral regurgitation (black arrow on color Doppler image, I).
Fluorine 18 fluorodeoxyglucose (FDG) PET/CT may also play a role in the assessment of PVE because abnormal FDG uptake around the prosthetic valve (Fig 10) has been found to increase the sensitivity of the modified Duke criteria at admission from 70% to 97% (36).
A fistula is a communication between two neighboring cavities through an abnormal perforating tract. In IE, a fistula is usually a sequela of an abscess or pseudoaneurysm. Color Doppler imaging shows a tract communicating between two neighboring cavities (3). At CT, a fistula appears as a contrast agent–filled tract interconnecting two neighboring cavities (Fig 6). In a study of 76 patients with IE, 1.7% of patients had aortocavitary fistulas; this prevalence increased to 5.8% in those with PVE. Almost all of the fistulas were detected at TEE. TEE is more effective than CT in accurately depicting intracardiac fistula. Kim et al (13) reported a case of a false-positive CT finding suggesting the presence of a fistula defect, with negative findings observed at TEE and intraoperative inspection. The presence of an aortocavitary fistula is associated with poor clinical outcome (37). Therefore, detection of perivalvular abscess formation and aortocardiac fistulas may aid in directing timing and feasibility of surgical intervention.
Dehiscence
Destruction of the valve ring leads to valve dehiscence and perivalvular leak. Dehiscence manifests with paravalvular regurgitant flow at color Doppler imaging with or without rocking motion of the prosthesis (3). At CT, prosthesis malalignment with a tissue defect between the annulus and prosthesis is seen (Fig 9 [Movie 2 [supplement]) (12). Rocking motions of the prosthetic valve of more than 15° on cine CT images may also be observed (11). TEE is more sensitive than CT for diagnosing perivalvular leaks (6,11). Oliveira et al (14) reported a higher sensitivity for TEE than for CT in depicting paravalvular leakage, although the difference was not statistically significant (69% vs 44%; P = .27). Another study showed that compared with TEE, preoperative single-phase CT has similar specificity (97% vs 99%) and lower sensitivity (46% vs 15%) for detecting dehiscence (12).
Other Leaflet Abnormalities
Leaflet perforation is a common complication of IE and can be associated with severe valve regurgitation. Leaflet defect can be detected at echocardiography with flow through the defect at color Doppler imaging (3). At CT, a leaflet defect and lack of continuity of the valvular leaflet may be seen (Fig 11) (11,22). Hryniewiecki et al (11) reported lower sensitivity (43% vs 75%) and higher specificity (89% vs 79%) of retrospective ECG-gated cardiac CT compared with TEE for detecting leaflet perforation in a mix of 71 valves. In another study of 29 patients with confirmed IE who underwent surgery, all four patients with leaflet perforation were missed with CT (4). Oliveira et al (14) reported a higher sensitivity for TEE than for CT in detecting leaflet perforation (81% vs 41%; P = .02).
Figure 11:
A–C, Four-chamber and, D–F, two-chamber contrast-enhanced CT images in a 39-year-old woman show focal ill-defined attenuation along the inferior aspect of the anterior mitral valve leaflet (vegetation, arrows) associated with leaflet perforation (arrowheads) and left atrial dilatation (*). G, Intraoperative image in a 32-year-old woman with infective endocarditis shows mitral valve leaflet perforation (arrow). H, I, Intraoperative images in a 49-year-old man with infective endocarditis show aortic valve leaflet perforation (arrows).
Valve leaflet aneurysm can be seen with IE. On images, the valvular leaflet appears distorted with a saccular outpouching and loss of its homogeneous curvature (Fig 5) (3,22). Kim et al (13) reported 100% agreement for detecting valve aneurysm between CT and TEE in five patients with IE.
Extracardiac Findings
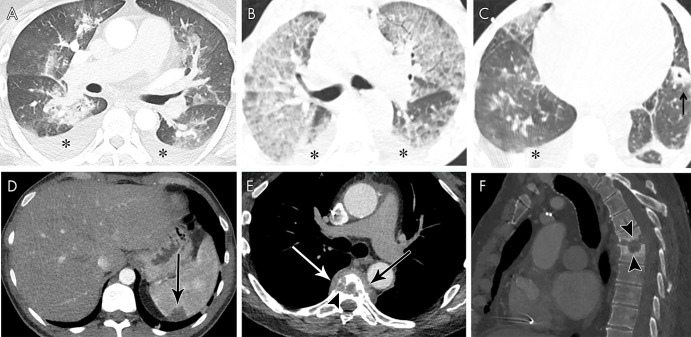
Imaging plays a role in detecting extracardiac findings of IE. Embolic events and metastatic infection occur in 20%–50% of patients with IE and may involve any organ but commonly affect the spleen and central nervous system (38). The presence of an embolic event is included in the minor criteria for the diagnosis of IE (2). A detailed discussion of IE extracardiac manifestations is beyond the scope of this review. Figure 12 shows examples of IE extracardiac findings at cardiac CT. Pulmonary septic emboli are related to right-sided endocarditis and appear as peripheral cavitary nodules. Pulmonary edema may develop if the left-sided heart valves are involved in the development of heart failure. Splenic emboli and infarction are frequently seen with IE and appear as peripheral hypoattenuation on contrast-enhanced CT images (39).
Figure 12:
A, Axial contrast-enhanced CT image in a 46-year-old man with mitral and aortic valve infective endocarditis (IE) shows pleural effusions (*) and peribronchial ground-glass and consolidative opacities, suggesting pulmonary edema. B, C, Axial non–contrast-enhanced CT images in a 55-year-old man with multivalvular IE show pleural effusions (*) and upper-zone predominant ground-glass opacities with septal thickening, suggesting pulmonary edema. Left lower lobe cavitating nodule (arrow) represents a septic embolus. D, Axial contrast-enhanced CT image in a 38-year-old man with aortic valve IE shows a splenic peripheral low-attenuation area of infarct (arrow). E, F, Axial (soft-tissue window, E) and sagittal (bone window, F) contrast-enhanced CT images in a 66-year-old man with bioprosthetic aortic valve IE show midthoracic vertebral end-plate destruction and sclerosis (arrowheads) with paravertebral heterogeneous attenuation (arrows) consistent with spondylodiscitis.
Conclusion
There has been an increased use of CT in the assessment of IE and associated local complications, as well as preoperative assessment of coronary arteries and the thoracic aorta. ECG-synchronized cardiac CT examination with thin-section reconstruction is at least equivalent to TEE in detecting abscesses as well as pseudoaneurysms, and combining the two modalities allows for further improved sensitivity in diagnosis. TEE is superior to CT in detecting small vegetations (<10 mm), valvular leaflet perforations, and perivalvular leaks, although CT can be a useful adjunct in demonstrating these findings when TEE is nondiagnostic or contraindicated. Awareness of typical imaging findings, appropriate protocols, and the relative limitations of CT will facilitate improved implementation of this useful modality in suspected IE.
Disclosures of Conflicts of Interest: M.B.S. disclosed no relevant relationships. T.K.M.W. Activities related to the present article: disclosed no relevant relationships. Activities not related to the present article: institution received grant from National Heart Foundation of New Zealand (overseas clinical and research fellowship grant). Other relationships: disclosed no relevant relationships. P.C. disclosed no relevant relationships. A.R.W. disclosed no relevant relationships. R.P.J.B. disclosed no relevant relationships. S.U. disclosed no relevant relationships. G.B.P. disclosed no relevant relationships. M.A.B. disclosed no relevant relationships.
Abbreviations:
- ECG
- electrocardiography
- FDG
- fluorine 18 fluorodeoxyglucose
- 4D
- four-dimensional
- IE
- infective endocarditis
- PVE
- prosthetic valve endocarditis
- TEE
- transesophageal echocardiography
References
- 1.Moreillon P, Que YA. Infective endocarditis. Lancet 2004;363(9403):139–149. [DOI] [PubMed] [Google Scholar]
- 2.Li JS, Sexton DJ, Mick N, et al. Proposed modifications to the Duke criteria for the diagnosis of infective endocarditis. Clin Infect Dis 2000;30(4):633–638. [DOI] [PubMed] [Google Scholar]
- 3.Habib G, Lancellotti P, Antunes MJ, et al. 2015 ESC Guidelines for the management of infective endocarditis: The Task Force for the Management of Infective Endocarditis of the European Society of Cardiology (ESC). Endorsed by: European Association for Cardio-Thoracic Surgery (EACTS), the European Association of Nuclear Medicine (EANM). Eur Heart J 2015;36(44):3075–3128. [DOI] [PubMed] [Google Scholar]
- 4.Feuchtner GM, Stolzmann P, Dichtl W, et al. Multislice computed tomography in infective endocarditis: comparison with transesophageal echocardiography and intraoperative findings. J Am Coll Cardiol 2009;53(5):436–444. [DOI] [PubMed] [Google Scholar]
- 5.Gahide G, Bommart S, Demaria R, et al. Preoperative evaluation in aortic endocarditis: findings on cardiac CT. AJR Am J Roentgenol 2010;194(3):574–578. [DOI] [PubMed] [Google Scholar]
- 6.Fagman E, Perrotta S, Bech-Hanssen O, et al. ECG-gated computed tomography: a new role for patients with suspected aortic prosthetic valve endocarditis. Eur Radiol 2012;22(11):2407–2414. [DOI] [PubMed] [Google Scholar]
- 7.Habets J, Tanis W, van Herwerden LA, et al. Cardiac computed tomography angiography results in diagnostic and therapeutic change in prosthetic heart valve endocarditis. Int J Cardiovasc Imaging 2014;30(2):377–387. [DOI] [PubMed] [Google Scholar]
- 8.Fagman E, Flinck A, Snygg-Martin U, Olaison L, Bech-Hanssen O, Svensson G. Surgical decision-making in aortic prosthetic valve endocarditis: the influence of electrocardiogram-gated computed tomography. Eur J Cardiothorac Surg 2016;50(6):1165–1171. [DOI] [PubMed] [Google Scholar]
- 9.Sims JR, Anavekar NS, Chandrasekaran K, et al. Utility of cardiac computed tomography scanning in the diagnosis and pre-operative evaluation of patients with infective endocarditis. Int J Cardiovasc Imaging 2018;34(7):1155–1163. [DOI] [PubMed] [Google Scholar]
- 10.Koo HJ, Yang DH, Kang JW, et al. Demonstration of infective endocarditis by cardiac CT and transoesophageal echocardiography: comparison with intra-operative findings. Eur Heart J Cardiovasc Imaging 2018;19(2):199–207. [DOI] [PubMed] [Google Scholar]
- 11.Hryniewiecki T, Zatorska K, Abramczuk E, et al. The usefulness of cardiac CT in the diagnosis of perivalvular complications in patients with infective endocarditis. Eur Radiol 2019;29(8):4368–4376. [DOI] [PMC free article] [PubMed] [Google Scholar]
- 12.Koneru S, Huang SS, Oldan J, et al. Role of preoperative cardiac CT in the evaluation of infective endocarditis: comparison with transesophageal echocardiography and surgical findings. Cardiovasc Diagn Ther 2018;8(4):439–449. [DOI] [PMC free article] [PubMed] [Google Scholar]
- 13.Kim IC, Chang S, Hong GR, et al. Comparison of Cardiac Computed Tomography With Transesophageal Echocardiography for Identifying Vegetation and Intracardiac Complications in Patients With Infective Endocarditis in the Era of 3-Dimensional Images. Circ Cardiovasc Imaging 2018;11(3):e006986. [DOI] [PubMed] [Google Scholar]
- 14.Oliveira M, Guittet L, Hamon M, Hamon M. Comparative Value of Cardiac CT and Transesophageal Echocardiography in Infective Endocarditis: A Systematic Review and Meta-Analysis. Radiol Cardiothorac Imaging 2020;2(3):e190189. [DOI] [PMC free article] [PubMed] [Google Scholar]
- 15.Taylor AJ, Cerqueira M, Hodgson JM, et al. ACCF/SCCT/ACR/AHA/ASE/ASNC/NASCI/SCAI/SCMR 2010 appropriate use criteria for cardiac computed tomography. A report of the American College of Cardiology Foundation Appropriate Use Criteria Task Force, the Society of Cardiovascular Computed Tomography, the American College of Radiology, the American Heart Association, the American Society of Echocardiography, the American Society of Nuclear Cardiology, the North American Society for Cardiovascular Imaging, the Society for Cardiovascular Angiography and Interventions, and the Society for Cardiovascular Magnetic Resonance. J Am Coll Cardiol 2010;56(22):1864–1894. [DOI] [PubMed] [Google Scholar]
- 16.Meijboom WB, Mollet NR, Van Mieghem CA, et al. Pre-operative computed tomography coronary angiography to detect significant coronary artery disease in patients referred for cardiac valve surgery. J Am Coll Cardiol 2006;48(8):1658–1665. [DOI] [PubMed] [Google Scholar]
- 17.Bennett CJ, Maleszewski JJ, Araoz PA. CT and MR imaging of the aortic valve: radiologic-pathologic correlation. RadioGraphics 2012;32(5):1399–1420. [DOI] [PubMed] [Google Scholar]
- 18.Abbara S, Blanke P, Maroules CD, et al. SCCT guidelines for the performance and acquisition of coronary computed tomographic angiography: A report of the society of Cardiovascular Computed Tomography Guidelines Committee: Endorsed by the North American Society for Cardiovascular Imaging (NASCI). J Cardiovasc Comput Tomogr 2016;10(6):435–449. [DOI] [PubMed] [Google Scholar]
- 19.Hermann F, Martinoff S, Meyer T, et al. Reduction of radiation dose estimates in cardiac 64-slice CT angiography in patients after coronary artery bypass graft surgery. Invest Radiol 2008;43(4):253–260. [DOI] [PubMed] [Google Scholar]
- 20.Chen JJ, Manning MA, Frazier AA, Jeudy J, White CS. CT angiography of the cardiac valves: normal, diseased, and postoperative appearances. RadioGraphics 2009;29(5):1393–1412. [DOI] [PubMed] [Google Scholar]
- 21.Faure ME, Swart LE, Dijkshoorn ML, et al. Advanced CT acquisition protocol with a third-generation dual-source CT scanner and iterative reconstruction technique for comprehensive prosthetic heart valve assessment. Eur Radiol 2018;28(5):2159–2168. [DOI] [PMC free article] [PubMed] [Google Scholar]
- 22.Grob A, Thuny F, Villacampa C, et al. Cardiac multidetector computed tomography in infective endocarditis: a pictorial essay. Insights Imaging 2014;5(5):559–570. [DOI] [PMC free article] [PubMed] [Google Scholar]
- 23.Vilacosta I, Graupner C, San Román JA, et al. Risk of embolization after institution of antibiotic therapy for infective endocarditis. J Am Coll Cardiol 2002;39(9):1489–1495. [DOI] [PubMed] [Google Scholar]
- 24.Prendergast BD, Tornos P. Surgery for infective endocarditis: who and when? Circulation 2010;121(9):1141–1152. [DOI] [PubMed] [Google Scholar]
- 25.Ouchi K, Ebihara T, Niitani M, et al. Diagnosis of infective endocarditis with cardiac CT in an adult. Radiol Case Rep 2019;14(5):544–547. [DOI] [PMC free article] [PubMed] [Google Scholar]
- 26.Kassop D, Donovan MS, Cheezum MK, et al. Cardiac Masses on Cardiac CT: A Review. Curr Cardiovasc Imaging Rep 2014;7(8):9281. [DOI] [PMC free article] [PubMed] [Google Scholar]
- 27.Asopa S, Patel A, Khan OA, Sharma R, Ohri SK. Non-bacterial thrombotic endocarditis. Eur J Cardiothorac Surg 2007;32(5):696–701. [DOI] [PubMed] [Google Scholar]
- 28.Sun JP, Asher CR, Yang XS, et al. Clinical and echocardiographic characteristics of papillary fibroelastomas: a retrospective and prospective study in 162 patients. Circulation 2001;103(22):2687–2693. [DOI] [PubMed] [Google Scholar]
- 29.Kondruweit M, Schmid M, Strecker T. Papillary fibroelastoma of the mitral valve: appearance in 64-slice spiral computed tomography, magnetic resonance imaging, and echocardiography. Eur Heart J 2008;29(6):831. [DOI] [PubMed] [Google Scholar]
- 30.Lembcke A, Meyer R, Kivelitz D, et al. Images in cardiovascular medicine. Papillary fibroelastoma of the aortic valve: appearance in 64-slice spiral computed tomography, magnetic resonance imaging, and echocardiography. Circulation 2007;115(1):e3–e6. [DOI] [PubMed] [Google Scholar]
- 31.Kelle S, Chiribiri A, Meyer R, Fleck E, Nagel E. Images in cardiovascular medicine. Papillary fibroelastoma of the tricuspid valve seen on magnetic resonance imaging. Circulation 2008;117(11):e190–e191. [DOI] [PubMed] [Google Scholar]
- 32.Graupner C, Vilacosta I, SanRomán J, et al. Periannular extension of infective endocarditis. J Am Coll Cardiol 2002;39(7):1204–1211. [DOI] [PubMed] [Google Scholar]
- 33.Entrikin DW, Gupta P, Kon ND, Carr JJ. Imaging of infective endocarditis with cardiac CT angiography. J Cardiovasc Comput Tomogr 2012;6(6):399–405. [DOI] [PubMed] [Google Scholar]
- 34.Karalis DG, Bansal RC, Hauck AJ, et al. Transesophageal echocardiographic recognition of subaortic complications in aortic valve endocarditis. Clinical and surgical implications. Circulation 1992;86(2):353–362. [DOI] [PubMed] [Google Scholar]
- 35.San Román JA, Vilacosta I, Sarriá C, et al. Clinical course, microbiologic profile, and diagnosis of periannular complications in prosthetic valve endocarditis. Am J Cardiol 1999;83(7):1075–1079. [DOI] [PubMed] [Google Scholar]
- 36.Saby L, Laas O, Habib G, et al. Positron emission tomography/computed tomography for diagnosis of prosthetic valve endocarditis: increased valvular 18F-fluorodeoxyglucose uptake as a novel major criterion. J Am Coll Cardiol 2013;61(23):2374–2382. [DOI] [PubMed] [Google Scholar]
- 37.Anguera I, Miro JM, Vilacosta I, et al. Aorto-cavitary fistulous tract formation in infective endocarditis: clinical and echocardiographic features of 76 cases and risk factors for mortality. Eur Heart J 2005;26(3):288–297. [DOI] [PubMed] [Google Scholar]
- 38.Di Salvo G, Habib G, Pergola V, et al. Echocardiography predicts embolic events in infective endocarditis. J Am Coll Cardiol 2001;37(4):1069–1076. [DOI] [PubMed] [Google Scholar]
- 39.Colen TW, Gunn M, Cook E, Dubinsky T. Radiologic manifestations of extra-cardiac complications of infective endocarditis. Eur Radiol 2008;18(11):2433–2445. [DOI] [PubMed] [Google Scholar]


![A, Short-axis and, B, C, oblique long-axis contrast-enhanced CT images in a 71-year-old woman show transcatheter aortic valve replacement (TAVR) with a partially obstructing eccentric low-attenuation area compatible with vegetation (*); an adjacent heterogeneous ill-defined low-attenuation area that is partially filled with contrast material (arrows), likely representing abscess and/or pseudoaneurysm; and a contrast material–filled fistula (arrowheads) communicating with the right ventricular outflow tract (RVOT). D, Transesophageal echocardiography color Doppler image in the same patient shows echogenicity partially obstructing TAVR, reflecting vegetation (black arrow), with evidence of flow in the fistulous tract with the RVOT (white arrow, Movie 3 [supplement]).](https://cdn.ncbi.nlm.nih.gov/pmc/blobs/6407/7977690/74b6b8f76c2d/ryct.2021200378.fig6.jpg)
![A, B, Short-axis and, C, oblique coronal contrast-enhanced CT images of the aortic valve in an 83-year-old man show bioprosthetic valve leaflet thickening with mobile nodular leaflet hypoattenuation (arrows, Movie 1 [supplement]). There is a large soft-tissue low-attenuation area surrounding the aortic root consistent with a periaortic abscess (*) with left ventricular outflow tract (LVOT) pseudoaneurysm (arrowheads). D, E, Three-chamber and, F, sagittal oblique contrast-enhanced CT images in a 46-year-old man show a nodular attenuation along the valve leaflet with linear attenuation extending into the LVOT (arrowheads), and contrast material–filled pseudoaneurysm (*) arising from the LVOT and extending adjacent to the thickened intervalvular fibrosa and the anterior mitral valve leaflet base (arrows).](https://cdn.ncbi.nlm.nih.gov/pmc/blobs/6407/7977690/64d59aae492f/ryct.2021200378.fig3.jpg)
![A–D, From top to bottom, short-axis and oblique coronal, as well as, E, F, sagittal contrast-enhanced CT images of the aortic valve and root in a 39-year-old man show a large near-circumferential aortic root contrast agent–filled pseudoaneurysm (*) that communicates freely with the left ventricular outflow tract (LVOT) with malalignment of the bioprosthesis (arrowheads) predominantly along the posterior aspect of the valve, suggesting prosthesis dehiscence. G–I, Transesophageal echocardiography (TEE) images in the same patient show an echo poor area surrounding the posterior aspect of the prosthetic aortic valve (arrows) and communicating with the LVOT with evidence of disinsertion of the prosthetic aortic valve (arrowheads), reflecting dehiscence. Prosthetic valve leaflet thickening is noted (arrowheads). J–L, TEE color Doppler images show flow in the perivalvular echo poor area consistent with pseudoaneurysm (arrows) with perivalvular leak and severe aortic regurgitation (arrowheads, Movies 4 and 5 [supplement]).](https://cdn.ncbi.nlm.nih.gov/pmc/blobs/6407/7977690/e6ad83d390c3/ryct.2021200378.fig9.jpg)
