Abstract
Purpose
To explore the usefulness of myocardial late iodine enhancement (LIE) and extracellular volume (ECV) quantification by using dual-energy cardiac CT.
Materials and Methods
In this single-center retrospective study, a total of 40 patients were evaluated with LIE CT by using a dual-layer spectral detector CT system. Among these, 21 also underwent cardiac MRI. Paired image sets were created by using standard imaging at 120 kVp, virtual monochromatic imaging (VMI) at 50 keV, and iodine density imaging. The contrast-to-noise ratio and image quality were then compared. Two observers assessed the presence of LIE and calculated the interobserver agreements. Agreement between CT and cardiac MRI when detecting late-enhancing lesions and calculating the ECV was also assessed.
Results
The contrast-to-noise ratio was significantly higher by using VMI than by using standard 120-kVp imaging, and the mean visual image quality score was significantly higher by using VMI than by using either standard or iodine density imaging. For interobserver agreement of visual detection of LIE, the agreement for VMI was excellent and the κ value (κ, 0.87) was higher than that for the standard 120-kVp (κ, 0.70) and iodine density (κ, 0.83) imaging. For detecting late-enhancing lesions, agreement with cardiac MRI was excellent by using VMI (κ, 0.90) and iodine density imaging (κ, 0.87) but was only good by using standard 120-kVp imaging (κ, 0.66). Quantitative comparisons of the ECV calculations by using CT and cardiac MRI showed excellent correlation (r2 = 0.94).
Conclusion
Dual-energy cardiac CT can assess myocardial LIE and quantify ECV, with results comparable to those obtained by using cardiac MRI.
© RSNA, 2019
See also the commentary by Litt in this issue.
Summary
Dual-energy cardiac CT with a dual-layer spectral detector gives data about myocardial late iodine enhancement and extracellular volume quantification, comparable to the findings obtained by using cardiac MRI.
Key Points
■ Compared with standard 120-kVp imaging, contrast-to-noise ratio was significantly higher by using virtual monochromatic imaging (VMI), and mean visual image quality score was significantly higher by using VMI than by using either standard or iodine density imaging.
■ Interobserver agreement for visual detection of late iodine enhancement was excellent by using MRI and iodine density imaging, and good by using standard imaging.
■ For detection of late-enhancing lesions, agreement with cardiac MRI was excellent by using VMI and iodine density imaging, and good by using standard imaging.
■ Quantitative comparisons of spectral detector CT–derived extracellular volume (ECV) and cardiac MRI–derived ECV showed excellent correlation (r2 = 0.94).
Introduction
Cardiac MRI with late gadolinium enhancement (LGE) has been well validated for the evaluation of focal myocardial fibrosis, edema, and the deposition of foreign extracellular materials in the diagnosis of myocardial infarction and nonischemic cardiomyopathy (1,2). Recently, quantification of the myocardial extracellular volume (ECV) fraction by using cardiac MRI has become a more accepted and reliable parameter for the assessment of various cardiac diseases (3). ECV calculations using cardiac MRI reflect the equilibrium of gadolinium-based contrast material between the myocardium and blood and is derived from pre- and postcontrast material–enhanced T1 mapping (4).
An alternative to LGE cardiac MRI, late iodine enhancement (LIE) cardiac CT is generally effective because the pharmacokinetics of iodinated contrast materials are similar to those of gadolinium-containing contrast materials (5). However, a limitation of LIE CT is the relatively low contrast resolution compared to LGE cardiac MRI. In previous studies of patients with chronic myocardial infarction with the use of LGE cardiac MRI as a reference standard, LIE CT identified ischemic scars with high specificity (88%–98%) but insufficient sensitivity (52%–77%) (6–8).
Dual-energy CT allows for the fact that different materials have different x-ray absorptions at high and low energies, and its use can facilitate greater discrimination than does conventional single-energy CT. Two dual-energy postprocessing techniques, virtual monochromatic imaging (VMI) and iodine density imaging, have the broadest applicability in clinical practice. VMI can effectively correct beam-hardening artifacts from the chest wall because such artifacts largely arise from the polychromatic character of x-rays used in clinical CT scanners (9). In addition, by taking advantage of the greater iodine contrast on images at lower electron voltage (in kiloelectron volts) settings (10–12), the contrast resolution of LIE CT can be improved. However, this strategy has not been fully established, probably because of the increased noise at lower kiloelectron volt settings and the consequent decrease in subjective image quality.
Recently, a dual-layer spectral detector CT (SDCT) system has become available (13–15). This system uses a detector-based dual-energy technique to measure high- and low-energy projection data in the two detector layers simultaneously at the same spatial and angular locations. This approach allows the use of VMI in the projection domain without requiring temporal and angular interpolation, and may theoretically correct beam hardening and cancel anticorrelated noise in photoelectric and Compton scatter images (16). Additionally, the system uses dedicated model-based iterative reconstruction techniques, which further reduce image noise (17). Therefore, we hypothesized that VMI at lower kiloelectron volt settings with the use of an SDCT system could improve image quality of LIE CT. The ability to quantify the myocardial ECV by using iodine density imaging with dual-energy equilibrium phase cardiac SDCT also has the potential to be a useful tool for noninvasive assessment and characterization of myocardial tissue.
The aim of this study was to explore the usefulness of myocardial LIE CT and ECV quantification by using dual-energy cardiac CT with an SDCT system.
Materials and Methods
Study Population
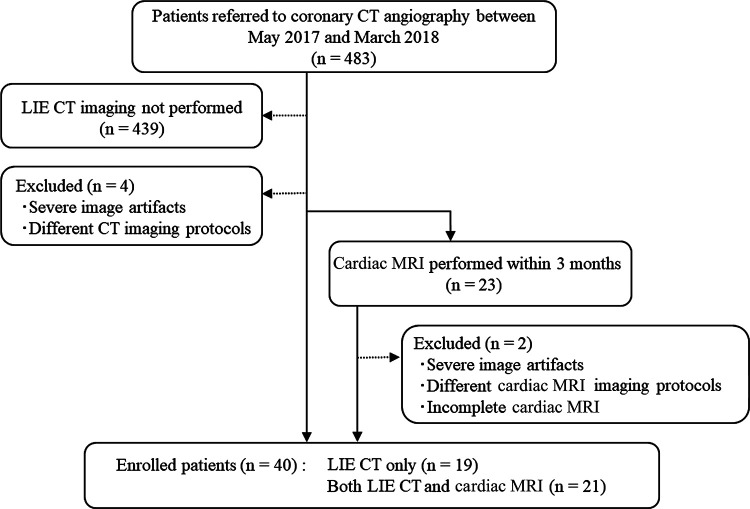
This was a retrospective study of the clinical records of patients known to have or suspected of having cardiac disease who underwent LIE CT at our institution between May 2017 and March 2018. Coronary CT angiography was performed for patients suspected of having or confirmed to have coronary artery disease for clinical reasons, based on the guidance of the American College of Cardiology (18). In our institution, LIE CT (equilibrium phase image acquisition) was added if physicians wanted information about myocardial impairment in cases of myocardial infarction and coexisting cardiomyopathy (19). In total, 40 patients were referred for LIE CT for at least one of the following indications: chronic myocardial infarction, hypertrophic or dilated cardiomyopathy, cardiac amyloidosis, and new-onset myocardial dysfunction. Based on the results of coronary CT angiography and LIE CT, cardiac MRI was performed when physicians required more information about the disease condition to make clinical decisions for patient treatment. Among these 40 patients, 21 also underwent cardiac MRI (median interval, 7 days; range, 1–26 days) with no changes in medication or clinical events occurring between the two examinations (Fig 1). The patient characteristics are summarized in Table 1. The study protocol was approved by our institutional review board, which waived the requirement for written informed consent.
Figure 1:
Flowchart shows study population enrollment. LIE = late iodine enhancement.
Table 1:
Patient Characteristics
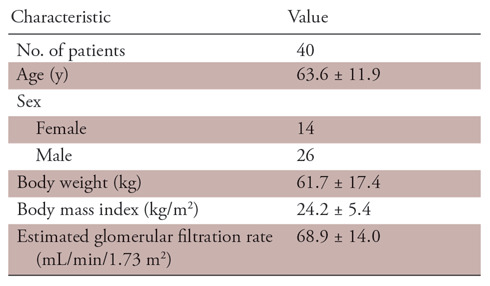
Note.—Unless otherwise specified, data are means ± standard deviation.
Cardiac CT Image Acquisition
All patients were scanned with a dual-layer SDCT scanner (iQon Spectral CT; Philips Healthcare, Best, the Netherlands). Individuals presenting with a baseline heart rate of more than 65 beats per minute received the oral β-blocker metoprolol tartrate (20 mg Lopressor; Novartis Pharma, Tokyo, Japan) 60 minutes before the scan. First, standard coronary CT angiography was performed with a 20-second intravenous infusion of 1.5 mL/kg (or 550 mgI/kg) of iopamidol (Iopamiron 370; Bayer Healthcare, Osaka, Japan).Then, after 7 minutes, LIE CT was performed by using prospective electrocardiography-triggered axial scans. The parameters for LIE CT were as follows: detector collimation, 64 × 0.625 mm; tube rotation time, 270 msec; tube voltage, 120 kVp; tube current, 228.6 mA ± 57.5 (standard deviation) (range, 100–370 mA); and volume CT dose index, 22.2 mGy ± 5.5 (range, 4.9–34.5 mGy). The acquisition parameters for LIE CT are summarized in Table 2.
Table 2:
Parameters for Late Iodine Enhancement CT
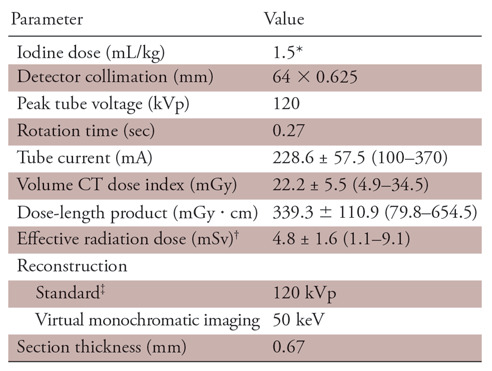
Note.—Data were obtained with prospective electrocardiogram gating. Unless otherwise specified, data are means ± standard deviation, with ranges in parentheses.
*550 mgI/kg.
†A conversion factor of 0.014 mSv ⋅ mGy−1cm−1 was used.
‡iDose4 (Philips Healthcare) at level 3 was used.
Axial source LIE CT images were reconstructed with section thicknesses and intervals of 0.67 mm and 0.33 mm, respectively, by using a medium cardiac kernel. Standard 120-kVp CT images were reconstructed by using a hybrid-type iterative reconstruction algorithm (iDose4; Philips Healthcare) at iDose level 3. The spectral-based image data were then postprocessed with a dedicated workstation (Spectral Diagnostic Suite; Philips Healthcare) to generate virtual monochromatic images (spectral level 3) and iodine density images. Each original data set of 0.67-mm axial images was processed for multiplanar reformation in the short-axis plane with a section thickness of 8.0 mm and a section interval of 4.0 mm. To create a myocardial CT–derived ECV map, iodine density images were analyzed with a postprocessing workstation (Ziostation 2; Ziosoft, Tokyo, Japan). The iodine density–derived CT ECV was calculated as follows: CT ECV (%) = (1 − hematocrit) × (iodine density in myocardium)/(iodine density in the left ventricle) × 100.
Cardiac MR Image Acquisition
LGE imaging along the short axis (section thickness, 8 mm) was performed with a middiastolic inversion-prepared, two-dimensional, gradient-echo sequence and was started at 8 minutes after injection of 0.2 mmol/kg of the gadolinium-based contrast medium gadobutrol (Gadovist; Bayer Yakuhin, Osaka, Japan). Pre- and postcontrast (15 minutes) T1 mapping were performed in a single midventricular short-axis section (section thickness, 8 mm) by using the shortened modified Look-Locker inversion recovery sequence. The T1 maps and the T1 mapping–derived cardiac MRI ECV maps were generated by using a postprocessing workstation (Ziostation 2). Cardiac MRI ECV values were calculated according to the following formula: cardiac MRI ECV = (1 − hematocrit) × (ΔR1 in myocardium)/(ΔR1 in the left ventricle) × 100.
Preliminary Study of Optimal VMI Kiloelectron Volt Level for LIE CT
We first performed preliminary image quality analysis by using eight individuals who were not included in the final study population to determine the optimal VMI kiloelectron volt level for the subsequent quality analysis of LIE CT images. Virtual monochromatic images were reconstructed at 40–80 keV with 10-keV intervals (the other parameters are described previously). For objective image quality analysis, regions of interest were drawn manually on the septum of the midleft ventricle and the left ventricular blood pool. The mean CT attenuation values (in Hounsfield units) of the septum (hereafter, HUseptum) and blood pool (hereafter, HUblood) were recorded. The image noise was defined as the standard deviation of the HUblood. The contrast-to-noise ratio (CNR) was calculated as CNR = (HUblood−HUseptum)/image noise. Each region of interest was placed by a radiologist (Y.N.) with 7 years of experience in cardiac CT and measurements were performed twice to ensure consistency, with the averaged values being used for analysis. For subjective image analysis, each virtual monochromatic image set was evaluated independently by two cardiovascular radiologists (Y.N. and M.K.). The CT data sets were presented in random order by using the fixed window levels and widths (100 HU and 200 HU), and the readers were blinded to the acquisition parameters. Four-point subjective scales (worst, 1; best, 4) were used and scores were assigned as follows: image noise (1, marked grainy and speckled appearance; 2 , moderate speckled appearance; 3, mild grainy and speckled appearance; and 4, minimal to no grainy and speckled appearance), image contrast and overall image quality (1, unacceptable; 2, acceptable; 3, good; and 4, excellent), and image texture (1, major artificial appearance and unclear visibility; 2 , moderate artificial appearance and reduced visibility; 3, mild artificial appearance and acceptable visibility; and 4, natural appearance and good visibility).
Based on the results of the preliminary study (see the Results section), the virtual monochromatic images at 50 keV provided the best balance of improved image quality with a high subjective image quality score and was chosen as the optimal energy level for the subsequent quality analysis of LIE CT images.
Quantitative Image Quality Analysis
All measurements were performed by a cardiovascular radiologist (T.N.) with 12 years of experience in cardiac CT and no prior knowledge of the patient’s clinical information. Regions of interest were manually drawn on the septum of the midleft ventricle and the left ventricular blood pool. Each myocardial region of interest was drawn as large as possible to include the septum region from the epicardium to the endocardium. In step 1, the following measurements were recorded: (a) the mean CT attenuation and iodine density values of the septum and left ventricle; (b) the contrast, calculated as the difference between the mean attenuation values in the left ventricle and septum; (c) the image noise, as the standard deviation of the attenuation value in a single circular region of interest (approximately 100 mm2) placed in the ventricular blood pool; and (d) the contrast-to-noise ratio, calculated as contrast enhancement divided by image noise. These parameters were compared between the standard 120-kVp images and the virtual monochromatic images acquired at 50 keV.
In step 2, quantitative lesion analysis was performed by the same cardiovascular radiologist. Among the 21 patients who underwent both cardiac CT and cardiac MRI, 16 had LGE-positive cardiac MR images that were compared with the LIE CT images. The radiologist then interpreted CT images by using standard imaging and VMI side by side with the reference LGE cardiac MR images, which were used to obtain region-of-interest measurement locations. For up to three late-hyperenhancing lesions per patient, circular regions of interest were placed on each lesion and the adjacent normal myocardium was ascertained by using LGE cardiac MRI to obtain the CT numbers of LIE. Myocardial LIE contrast was calculated as the difference between the mean attenuation of the LIE lesions and the adjacent normal myocardium on both the standard 120-kVp images and the virtual monochromatic images acquired at 50 keV.
Qualitative Image Quality Analysis
All standard 120-kVp images, virtual monochromatic images at 50 keV, and iodine density images were reviewed and interpreted with a picture archiving and communication system (View R, version 1.24.05; Yokogawa Electric, Tokyo, Japan), with each image series intermixed. Two cardiovascular radiologists (M.K. and S.O.) with 7 years and 10 years of experience in cardiac CT assessment, respectively, were blinded to the reconstruction settings and asked to grade the images for noise, beam-hardening artifacts, image contrast, and overall image quality. Four-point subjective scales were used to assess each measure. For image noise and beam-hardening artifacts, the scale was as follows: 1, present and unacceptable; 2, present and interfering with the depiction of the myocardium; 3, present but not interfering with the depiction; and 4, minimal or absent. For image contrast and overall image quality, the scale was as follows: 1, unacceptable; 2, acceptable; 3, good; and 4, excellent. In cases of interobserver disagreement, final decisions were reached with consensus. The window levels and widths were fixed during the qualitative assessments (100 HU and 200 HU for standard 120-kVp images and virtual monochromatic images at 50 keV, and 2 mg/dL and 3 mg/dL for iodine density images, respectively).
Interobserver Agreement for LIE CT Detection
Two cardiovascular radiologists (M.K. and S.O.), who were blinded to the reconstruction settings, independently evaluated the presence of myocardial LIE in each of 16 left ventricular segments (excluding the apex) based on the American Heart Association 17-segment model. Interobserver agreement was then assessed for detecting myocardial LIE on a per-segment basis.
Agreement between LIE CT and LGE Cardiac MRI for Detecting Late Enhancement
In patients who underwent both cardiac CT and cardiac MRI, a cardiovascular radiologist (D.U.), who was blinded to the reconstruction settings, evaluated the presence of myocardial late enhancement lesions in each of the 16-segment models, as above, at LIE CT (standard 120-kVp images, virtual monochromatic images at 50 keV, and iodine density image set) and on LGE cardiac MR images. Agreement between LIE CT of the standard 120-kVp images, virtual monochromatic images at 50 keV, iodine density images, and LGE cardiac MRI for the detection of late-enhancing lesions was assessed on a per-segment basis.
Comparison of CT-derived ECV and Cardiac MRI-derived ECV for Quantification of Myocardial ECV
CT-derived ECV and cardiac MRI-derived ECV were also compared by a cardiovascular radiologist (Y.N.) without reference to the LIE CT and LGE cardiac MR images. In the maps for each method, a myocardial region of interest was manually drawn on the septum of the midleft ventricle and correlations were assessed between the ECV calculated by using cardiac CT and cardiac MRI.
Statistical Analysis
All numeric values are reported as means ± standard deviation, unless otherwise stated. In the preliminary study, one-way analysis of variance was used for multiple comparisons of quantitative values. If a significant difference was observed, then pairwise comparisons were performed with the Dunnett test, with the values obtained from the 120-kVp images serving as the control. The visual scores were compared by using the Kruskal-Wallis test. If a significant difference was found, then pairwise comparisons were performed with the Steel test, with the values obtained from the 120-kVp images serving as the control.
In the subsequent image analysis, the quantitative image parameters obtained with standard 120-kVp imaging and VMI at 50 keV were compared, and differences in mean values between the two reconstructions were identified by using the two-tailed independent t test and Mann-Whitney U-test, as appropriate. Friedman test and the Wilcoxon signed-rank test with the Holm correction were used to compare the qualitative scores of image quality for the standard 120-kVp images, virtual monochromatic images at 50 keV, and iodine density images. A P value of less than .05 was considered to indicate a statistically significant difference.
Interobserver agreements regarding the detection of myocardial LIE were evaluated with Cohen κ statistic with the following interpretation of κ values: greater than 0.80, excellent agreement; 0.61–0.80, good agreement; 0.41–0.60, moderate agreement; 0.21–0.40, fair agreement; and less than 0.20, poor agreement. Correlation and agreement between the ECV calculated by using cardiac CT and cardiac MRI were evaluated with Pearson correlation analysis and Bland-Altman analysis on a per-patient and per-segment basis.
The statistical analyses were performed by using BellCurve for Excel (version 2.15; SSRI, Tokyo, Japan) and MedCalc Software (version 11.2; MedCalc, Mariakerke, Belgium).
Results
Preliminary Study of Optimal VMI Kiloelectron Volt Level for LIE CT
The results of the preliminary assessment of image quality are shown in Table 3. In the objective analysis, the mean attenuation values of the septum and blood pool and the image noise of VMI increased as the energy level decreased. Contrast-to-noise ratio also gradually increased as the monoenergetic level decreased. Compared with standard 120-kVp images, the contrast-to-noise ratio was significantly higher on the virtual monochromatic images at 40 keV and 50 keV. In the subjective analysis, the image contrast of virtual monochromatic images at 40 keV was rated significantly higher than with the standard 120-kVp images (P <.01), whereas the image noise and image texture of virtual monochromatic images at 40 keV was significantly lower (P =.02 and P <.01, respectively). The highest score for overall image quality was assigned for virtual monochromatic images at 50 keV, which was significantly higher than that of the standard 120-kVp images (P <.01). There was substantial interobserver agreement.
Table 3:
Preliminary Study of Optimal VMI Kiloelectron Volt Level for Late Iodine Enhancement CT
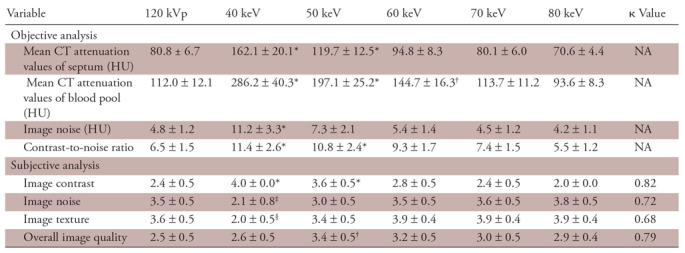
Note.—Unless otherwise specified, data are means ± standard deviation. κ values represent the interobserver reproducibility in grading the images. Pairwise comparisons were performed by using the Dunnett test for the objective analysis and the Steel test for the subjective analysis, with the values obtained from the 120-kVp images serving as the control. NA = not applicable, VMI = virtual monochromatic imaging.
*VMI > 120 kVp (P < .01).
†VMI > 120 kVp (P < .05).
‡VMI < 120 kVp (P < .05).
§VMI < 120 kVp (P < .01).
Quantitative Image Quality Analysis
The results of the quantitative assessment of image quality are shown in Table 4. The mean CT attenuation values of the septum and left ventricle, as well as the image noise, were significantly higher on the virtual monochromatic images at 50 keV than on the standard 120-kVp images (P <.01). Moreover, the contrast-to-noise ratio and the LIE-myocardium contrast were significantly higher on the virtual monochromatic images at 50 keV than on the standard 120-kVp images (P <.01 for both).
Table 4:
Quantitative Assessment of Image Quality
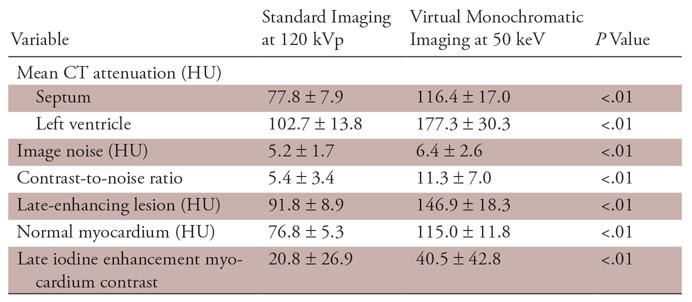
Note.—Unless otherwise specified, data are means ± standard deviation. The two-tailed independent t test and Mann-Whitney U test were used.
Qualitative Image Quality Analysis
The results of qualitative image quality analysis are shown in Table 5. The mean visual score for image noise and beam-hardening artifacts were significantly lower on the iodine density images, but there were no significant differences between the standard 120-kVp images and the virtual monochromatic images at 50 keV. By contrast, the mean visual score for image contrast and overall image quality were significantly higher on the virtual monochromatic images at 50 keV and the iodine density images, compared with the standard 120-kVp images. Representative examples are shown in Figure 2.
Table 5:
Qualitative Assessment of Image Quality

Note.—Unless otherwise specified, data are means ± standard deviation. κ values represent the interobserver reproducibility in grading the images. Pairwise comparisons were performed with the Wilcoxon signed-rank test and Holm correction.
*Indicates 120-kVp vs 50-keV imaging.
†Indicates 120-kVp vs iodine density imaging.
‡Indicates 50-keV vs iodine density imaging.
Figure 2a:
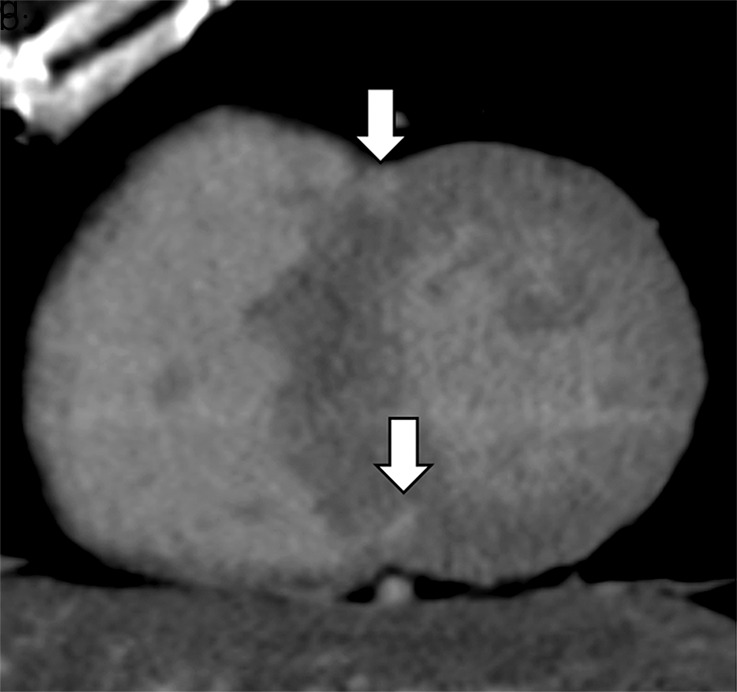
Images show comparison of (a–c) late iodine enhancement (LIE) CT images and (d) late gadolinium enhancement (LGE) cardiac MR image in a 63-year-old woman with hypertrophic cardiomyopathy. (a) Standard 120-kVp image, (b) virtual monochromatic image at 50 keV, and (c) iodine density image acquired by using dual-energy LIE CT. (d) LGE cardiac MR image shows LGE confined to anterior and posterior right ventricular insertion points. Late-enhancing lesions were more clearly visualized on virtual monochromatic image at 50 keV and iodine density image than on standard 120-kVp image.
Figure 2b:
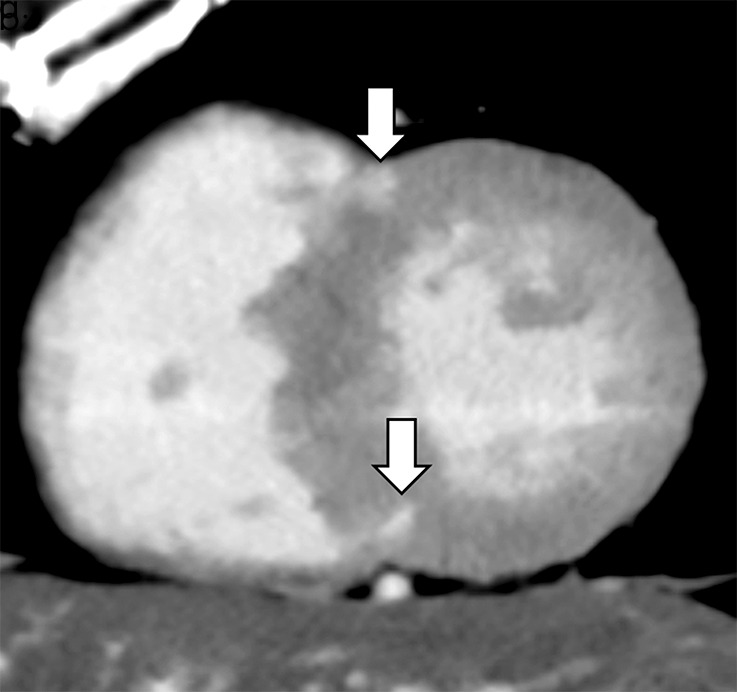
Images show comparison of (a–c) late iodine enhancement (LIE) CT images and (d) late gadolinium enhancement (LGE) cardiac MR image in a 63-year-old woman with hypertrophic cardiomyopathy. (a) Standard 120-kVp image, (b) virtual monochromatic image at 50 keV, and (c) iodine density image acquired by using dual-energy LIE CT. (d) LGE cardiac MR image shows LGE confined to anterior and posterior right ventricular insertion points. Late-enhancing lesions were more clearly visualized on virtual monochromatic image at 50 keV and iodine density image than on standard 120-kVp image.
Figure 2c:
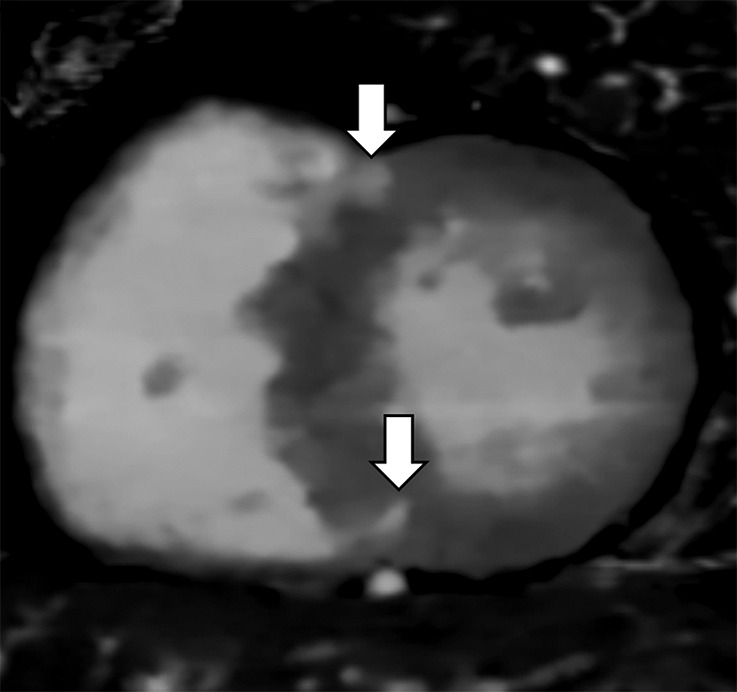
Images show comparison of (a–c) late iodine enhancement (LIE) CT images and (d) late gadolinium enhancement (LGE) cardiac MR image in a 63-year-old woman with hypertrophic cardiomyopathy. (a) Standard 120-kVp image, (b) virtual monochromatic image at 50 keV, and (c) iodine density image acquired by using dual-energy LIE CT. (d) LGE cardiac MR image shows LGE confined to anterior and posterior right ventricular insertion points. Late-enhancing lesions were more clearly visualized on virtual monochromatic image at 50 keV and iodine density image than on standard 120-kVp image.
Figure 2d:
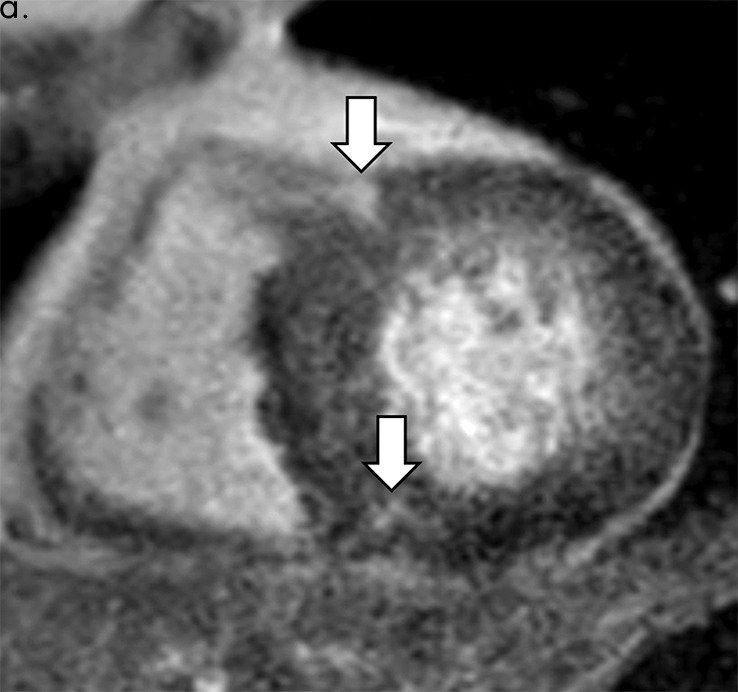
Images show comparison of (a–c) late iodine enhancement (LIE) CT images and (d) late gadolinium enhancement (LGE) cardiac MR image in a 63-year-old woman with hypertrophic cardiomyopathy. (a) Standard 120-kVp image, (b) virtual monochromatic image at 50 keV, and (c) iodine density image acquired by using dual-energy LIE CT. (d) LGE cardiac MR image shows LGE confined to anterior and posterior right ventricular insertion points. Late-enhancing lesions were more clearly visualized on virtual monochromatic image at 50 keV and iodine density image than on standard 120-kVp image.
Interobserver Agreement for Detection of LIE CT on a per-Segment Basis
There was excellent interobserver agreement for visual detection of myocardial LIE segments on both the virtual monochromatic images at 50 keV (κ, 0.87; 95% confidence interval [CI]: 0.81, 0.92) and the iodine density images (κ, 0.83; 95% CI: 0.78, 0.89), and there was good agreement with the standard 120-kVp images (κ, 0.70; 95% CI: 0.61, 0.79) (Table 6).
Table 6:
Interobserver Agreement for Detection of Late Iodine Enhancement CT on a per-Segment Basis

Agreement between LIE CT and LGE Cardiac MRI for Detection of Late-enhancing Lesions on a per-Segment Basis
Excellent agreement was shown for detecting late-enhancing myocardial segments between LGE cardiac MRI and both the virtual monochromatic images at 50 keV (κ, 0.90; 95% CI: 0.84, 0.95) and the iodine density images (κ, 0.87; 95% CI: 0.81, 0.93), and there was good agreement with the standard 120-kVp images (κ, 0.66; 95% CI: 0.56, 0.76) (Table 7).
Table 7:
Agreement between Late Iodine Enhancement CT and Late Gadolinium Enhancement Cardiac MRI for Detecting Late-enhancing Lesions on a per-Segment Basis

Comparison of CT-derived ECV and Cardiac MRI–derived ECV for Quantification of Myocardial ECV
Among the 21 patients who underwent both cardiac CT and cardiac MRI, quantitative comparisons of the iodine density–derived CT ECV and the cardiac MRI ECV showed excellent correlation (r2 = 0.94; P <.01). The Bland-Altman plots showed only small bias (0.1%), with 95% limits of agreement of −5.7% to 5.7% (Figs 3, 4).
Figure 3a:
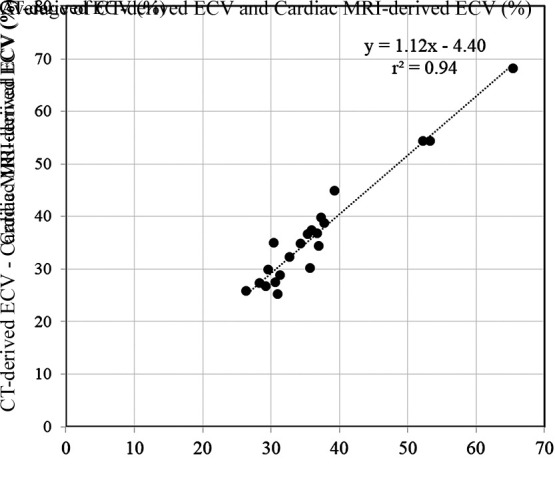
Scatterplots show results of (a) correlation and (b) Bland-Altman analyses for comparisons between CT-derived extracellular volume (ECV) and cardiac MRI–derived ECV. There was excellent correlation (r2 = 0.94; P < .01) and small bias (0.1% with 95% limits of agreement of −5.7% and 5.7%) between CT-derived ECV and cardiac MRI–derived ECV.
Figure 4a:
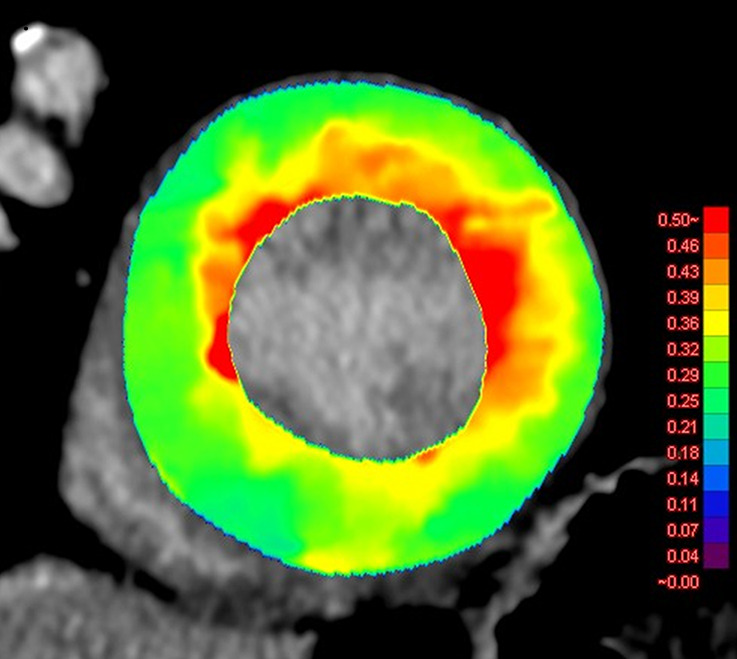
Images show comparison of (a) CT-derived extracellular volume (ECV) and (b) cardiac MRI-derived ECV in a 56-year-old woman with hypertrophic cardiomyopathy. Both CT-derived ECV and cardiac MRI–derived ECV images show significantly elevated myocardial ECV predominantly in subendocardium. CT-derived ECV and cardiac MRI–derived ECV quantifications were comparable.
Figure 3b:
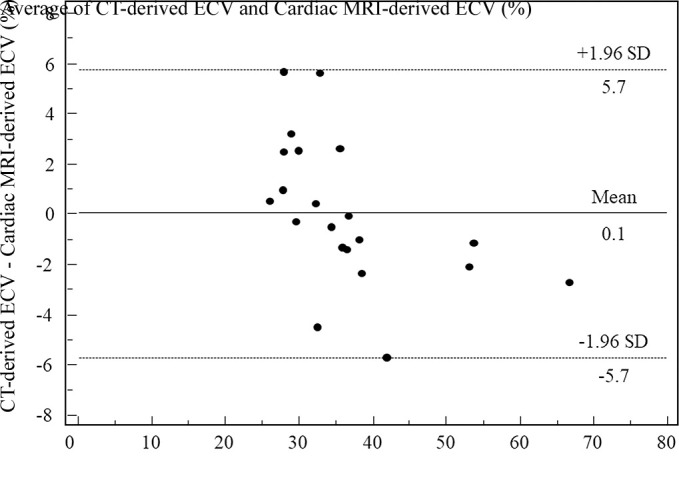
Scatterplots show results of (a) correlation and (b) Bland-Altman analyses for comparisons between CT-derived extracellular volume (ECV) and cardiac MRI–derived ECV. There was excellent correlation (r2 = 0.94; P < .01) and small bias (0.1% with 95% limits of agreement of −5.7% and 5.7%) between CT-derived ECV and cardiac MRI–derived ECV.
Figure 4b:
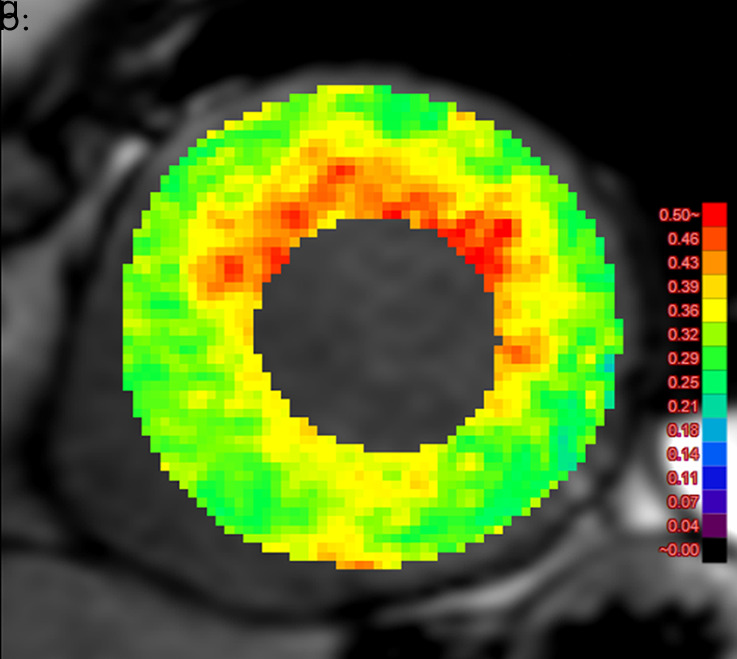
Images show comparison of (a) CT-derived extracellular volume (ECV) and (b) cardiac MRI-derived ECV in a 56-year-old woman with hypertrophic cardiomyopathy. Both CT-derived ECV and cardiac MRI–derived ECV images show significantly elevated myocardial ECV predominantly in subendocardium. CT-derived ECV and cardiac MRI–derived ECV quantifications were comparable.
Discussion
Our results indicated that VMI at 50 keV by using a dual-layer SDCT could yield improved qualitative and quantitative image quality of LIE CT, compared with standard images at 120 kVp. The LIE-myocardium contrast was significantly higher on the virtual monochromatic images at 50 keV than on the standard 120-kVp images, and interobserver agreement for visual detection of myocardial LIE segments was excellent. Equally, there was excellent agreement between VMI and LGE cardiac MRI for detecting late-enhancing myocardial segments, and there was excellent correlation between the iodine density–derived CT ECV and the cardiac MRI ECV results, with only a small bias observed. Thus, dual-energy cardiac CT provided comparable information to cardiac MRI about myocardial tissue characterization.
The results of the preliminary study demonstrated that virtual monochromatic images at 50 keV provided the best balance of improved image quality with high subjective image quality score and was chosen as the optimal kiloelectron volt level for LIE CT. The image quality characteristic of the dual-layer SDCT system, which used a detector-based dual-energy technique in this study, is consistent with recent investigations (20–22), but in contrast to the results of studies on tube-based dual-energy CT systems (23–26). Sellerer et al (27) directly compared the image quality between different dual-energy CT systems and found that the dual-layer SDCT provided constant noise levels over the full range of energies, whereas tube-based dual-energy CT systems showed substantial increased noise for lower energy levels, especially at 40 keV to 55 keV. The noise behavior of the dual-layer SDCT, which is distinct from tube-based dual-energy CT, can be explained with the detector-based dual-energy CT solution. In tube-based dual-energy CT systems, dual-energy data are postprocessed only in the image domain (dual-source, split-beam, and dual-spin techniques), or angular and temporal interpolation is required before postprocessing in the projection domain (fast kilovoltage-peak switching technique). This theoretically leads to deterioration of spatial and temporal resolution, and amplification of the so-called anticorrelated noise, especially at low energies (28). In contrast, detector-based dual-energy CT enables postprocessing in the projection domain without angular and temporal interpolation due to perfectly registered dual-energy data, which allows the implementation of an anticorrelated noise reduction algorithm to facilitate the exploitation and cancellation of the anticorrelated noise in the process of VMI reconstruction or spectral image reconstruction. Our preliminary objective image quality analysis showed that the contrast-to-noise ratio of virtual monochromatic images was maximized at 40 keV. However, subjective analysis revealed that the image texture of virtual monochromatic images at 40 keV had the lowest score, and the highest score for overall image quality was assigned for virtual monochromatic images at 50 keV. This finding can be explained by alterations to the noise power spectrum. Sakabe et al (22) investigated the image quality characteristics of virtual monochromatic images at dual-layer spectral CT and reported the noise power spectrum of a 40-keV image had more low-frequency components and was different from that of the standard 120-kVp image. They also mentioned the potential risk of altering the granularity and texture of images, which may affect the diagnostic performance. This trend regarding the optimal kiloelectron volt level observed in this study are consistent with recent studies using dual-layer spectral CT (29,30).
Myocardial LGE and ECV evaluation by using cardiac MRI have been validated for the diagnosis of ischemic and nonischemic cardiomyopathy, therapeutic monitoring, and prognosis stratification (31). However, cardiac MRI is associated with several challenges, including longer acquisition times, limited imaging sections, and a lack of applicability to patients requiring mechanical device support. Gadolinium-enhanced cardiac MRI is also contraindicated for patients undergoing dialysis and it is difficult for patients who are critically ill to tolerate acquisitions involving multiple and long breath holds. In comparison to cardiac MRI, cardiac CT is widely used because of its accessibility, fast acquisition times, suitability for coronary artery imaging, and suitability for use in patients with mechanical devices or who are undergoing dialysis. Therefore, LIE CT and CT-derived ECV analysis with dual-energy cardiac CT could be a useful noninvasive tool for the assessment of myocardial disease.
There are two methods of myocardial CT–derived ECV measurement: the subtraction-derived method and the iodine density–derived method. The subtraction-derived CT ECV method can be used with standard single-energy CT. This previously validated method (32–35) requires the capture of pre- and postcontrast (equilibrium phase) images to calculate the extracellular spread of contrast material by using an increment of CT attenuation. Unfortunately, this method is thought to be of limited use because the myocardium and blood might not be easily differentiated on precontrast CT images, and the possibility of misregistration between the pre- and postcontrast CT images can reduce accuracy. By contrast, the iodine density–derived CT ECV method uses iodine density images generated with dual-energy CT acquisition. In this method, these images show the spread of iodine in a voxel at a state of equilibrium, and the ECV measurement is performed without precontrast images, thereby preventing the issue of misregistration.
Ohta et al (36) compared myocardial CT–derived ECV quantification between the subtraction-derived method and the iodine density–derived method by using dual-energy CT with a fast kilovoltage-peak switching technique. They found a strong correlation (r = 0.896; P <.01) and small bias (−0.06%) in myocardial CT–derived ECV quantification between the two methods and confirmed that interobserver concordances were high (0.92 and 0.91, respectively). However, they did not compare CT-derived ECV with cardiac MRI–derived ECV.
Lee et al (37) evaluated the feasibility of CT-derived ECV measurement by using dual-energy cardiac CT with a second generation dual-source CT scanner compared with cardiac MRI to determine myocardial ECV in nonischemic cardiomyopathy. In that study, interobserver agreement for the myocardial ECV values in a per-segment analysis were 0.80–0.95 for dual-energy CT–derived ECV and 0.81–0.95 for cardiac MRI–derived ECV. Bland-Altman analysis of agreement between the dual-energy CT and the cardiac MRI in a per-segment analysis showed only small bias of −0.24% to 0.05%, with 95% limits of agreement of −5.48% to −2.23% as the lower limit and 2.20%–5.32% as the upper limit. They suggested that cardiac CT might be a useful approach for the clinical assessment of cardiac diseases, particularly in patients with contraindications to cardiac MRI, and that the dual-energy technique could provide accurate myocardial ECV measurements. They also indicated that dual-energy CT–derived ECV assessment might have an important role in the future. Based on our results, we agree with these views of Lee et al (37); however, we recognize that more research is required before recommending large-scale application.
Some recent studies investigated the utility of LIE CT by using dual-energy CT. For example, Chang et al (38) investigated the utility of VMI by using a second-generation dual-source CT scanner for the assessment of myocardial LIE in patients with cardiomyopathy. They reported that dual-energy CT based on VMI at 70 keV effectively reduced beam-hardening artifacts and improved image quality at LIE CT when compared with standard imaging at 120 kVp. However, they did not use lower kiloelectron volt settings for their images as we did (eg, 50 keV). This was probably because of the increased noise at lower kiloelectron volt levels with this type of dual-energy CT system, and because the inherent decrease in contrast-to-noise ratio degrades subtle LIE lesion detectability and subjective image quality. However, when using a dual-layer SDCT that uses accurate beam-hardening correction and noise cancellation, we demonstrated that VMI at 50 keV could improve the image quality of LIE CT while retaining excellent agreement with LGE cardiac MRI. More recently, Ohta et al (39) assessed the diagnostic performance of VMI with the use of projection data–based dual-energy CT in the detection of myocardial scar in patients with heart failure, with cardiac MRI as the standard of reference, and reported VMI at 40 keV enabled accurate detection and localization of myocardial scars. Further technologic innovations may expand the clinical applications of VMI at lower kiloelectron volt settings (eg, 40–50 keV).
This retrospective study had some limitations. First, because we only assessed our initial clinical experience of LIE CT and CT-derived ECV by using a dual-layer SDCT in a single center, the numbers of patients and lesions were limited; thus, selection bias may have occurred. Hence, future large-scale studies are needed to validate our results. Second, our results were obtained with a detector-based dual-energy system from a single CT vendor, so further evaluation should be carried out with tube-based dual-energy CT systems (eg, dual-source or fast kilovoltage-peak switching systems). Third, we assessed the visual detectability of late-enhancing lesions by using cardiac CT and cardiac MRI, but due to insufficient patient numbers, we did not evaluate the classification patterns (eg, subendocardial, epicardial, transmural, or mesocardial). Given that recognizing late enhancement patterns is important for the diagnosis of cardiac disease, further studies are needed to assess the influences of dual-energy LIE CT on the late enhancement pattern classification and diagnosis. Fourth, relatively high radiation exposure was required to obtain the dual-energy LIE CT data (mean effective radiation dose of 4.8 mSv). Further reduction of radiation exposure would be desirable, but we need to ensure that this can be performed without degrading image quality. Fifth, evaluation parameters may cause bias because the reconstruction of standard 120-kVp images, virtual monochromatic images, and iodine density images can be differentiated based on image texture. Sixth, we did not assess the findings at CT and cardiac MRI with pathologic correlation. Finally, all patients and cardiac CT examinations in this study originated from a single institution, requiring that multicenter prospective clinical trials must still be performed to validate our data.
In conclusion, dual-energy cardiac CT with a dual-layer spectral detector gives adequate data about myocardial LIE and ECV quantification, comparable to the findings obtained by using cardiac MRI.
From the 2018 RSNA Annual Meeting.
Disclosures of Conflicts of Interest: S.O. disclosed no relevant relationships. T.E. disclosed no relevant relationships. T.N. disclosed no relevant relationships. M.K. disclosed no relevant relationships. D.U. disclosed no relevant relationships. Y.F. disclosed no relevant relationships. Y.N. disclosed no relevant relationships. S.T. disclosed no relevant relationships. M.U. disclosed no relevant relationships. T.Y. disclosed no relevant relationships. K.T. disclosed no relevant relationships. Y.A. disclosed no relevant relationships. Y.Y. disclosed no relevant relationships.
Abbreviations:
- CI
- confidence interval
- ECV
- extracellular volume
- LGE
- late gadolinium enhancement
- LIE
- late iodine enhancement
- SDCT
- spectral detector CT
- VMI
- virtual monochromatic imaging
References
- 1.Mewton N, Liu CY, Croisille P, Bluemke D, Lima JA. Assessment of myocardial fibrosis with cardiovascular magnetic resonance. J Am Coll Cardiol 2011;57(8):891–903. [DOI] [PMC free article] [PubMed] [Google Scholar]
- 2.Vogel-Claussen J, Rochitte CE, Wu KC, et al. Delayed enhancement MR imaging: utility in myocardial assessment. RadioGraphics 2006;26(3):795–810. [DOI] [PubMed] [Google Scholar]
- 3.Messroghli DR, Moon JC, Ferreira VM, et al. Clinical recommendations for cardiovascular magnetic resonance mapping of T1, T2, T2* and extracellular volume: a consensus statement by the Society for Cardiovascular Magnetic Resonance (SCMR) endorsed by the European Association for Cardiovascular Imaging (EACVI). J Cardiovasc Magn Reson 2017;19(1):75 [Published correction appears in J Cardiovasc Magn Reson 2018;20(1):9.] 10.1186/s12968-017-0389-8. [DOI] [PMC free article] [PubMed] [Google Scholar]
- 4.Flett AS, Hayward MP, Ashworth MT, et al. Equilibrium contrast cardiovascular magnetic resonance for the measurement of diffuse myocardial fibrosis: preliminary validation in humans. Circulation 2010;122(2):138–144. [DOI] [PubMed] [Google Scholar]
- 5.Schuleri KH, George RT, Lardo AC. Applications of cardiac multidetector CT beyond coronary angiography. Nat Rev Cardiol 2009;6(11):699–710. [DOI] [PubMed] [Google Scholar]
- 6.Bettencourt N, Ferreira ND, Leite D, et al. CAD detection in patients with intermediate-high pre-test probability: low-dose CT delayed enhancement detects ischemic myocardial scar with moderate accuracy but does not improve performance of a stress-rest CT perfusion protocol. JACC Cardiovasc Imaging 2013;6(10):1062–1071. [DOI] [PubMed] [Google Scholar]
- 7.Bauer RW, Kerl JM, Fischer N, et al. Dual-energy CT for the assessment of chronic myocardial infarction in patients with chronic coronary artery disease: comparison with 3-T MRI. AJR Am J Roentgenol 2010;195(3):639–646. [DOI] [PubMed] [Google Scholar]
- 8.Wichmann JL, Bauer RW, Doss M, et al. Diagnostic accuracy of late iodine-enhancement dual-energy computed tomography for the detection of chronic myocardial infarction compared with late gadolinium-enhancement 3-T magnetic resonance imaging. Invest Radiol 2013;48(12):851–856. [DOI] [PubMed] [Google Scholar]
- 9.So A, Hsieh J, Imai Y, et al. Prospectively ECG-triggered rapid kV-switching dual-energy CT for quantitative imaging of myocardial perfusion. JACC Cardiovasc Imaging 2012;5(8):829–836. [DOI] [PubMed] [Google Scholar]
- 10.Albrecht MH, Scholtz JE, Hüsers K, et al. Advanced image-based virtual monoenergetic dual-energy CT angiography of the abdomen: optimization of kiloelectron volt settings to improve image contrast. Eur Radiol 2016;26(6):1863–1870. [DOI] [PubMed] [Google Scholar]
- 11.Albrecht MH, Scholtz JE, Kraft J, et al. Assessment of an advanced monoenergetic reconstruction technique in dual-energy computed tomography of head and neck cancer. Eur Radiol 2015;25(8):2493–2501. [DOI] [PubMed] [Google Scholar]
- 12.Lv P, Lin XZ, Chen K, Gao J. Spectral CT in patients with small HCC: investigation of image quality and diagnostic accuracy. Eur Radiol 2012;22(10):2117–2124. [DOI] [PubMed] [Google Scholar]
- 13.van Hamersvelt RW, Schilham AMR, Engelke K, et al. Accuracy of bone mineral density quantification using dual-layer spectral detector CT: a phantom study. Eur Radiol 2017;27(10):4351–4359. [DOI] [PMC free article] [PubMed] [Google Scholar]
- 14.Hickethier T, Baeßler B, Kroeger JR, et al. Monoenergetic reconstructions for imaging of coronary artery stents using spectral detector CT: in-vitro experience and comparison to conventional images. J Cardiovasc Comput Tomogr 2017;11(1):33–39. [DOI] [PubMed] [Google Scholar]
- 15.Doerner J, Hauger M, Hickethier T, et al. Image quality evaluation of dual-layer spectral detector CT of the chest and comparison with conventional CT imaging. Eur J Radiol 2017;93:52–58. [DOI] [PubMed] [Google Scholar]
- 16.Kalender WA, Klotz E, Kostaridou L. An algorithm for noise suppression in dual energy CT material density images. IEEE Trans Med Imaging 1988;7(3):218–224. [DOI] [PubMed] [Google Scholar]
- 17.Chang W, Lee JM, Lee K, et al. Assessment of a model-based, iterative reconstruction algorithm (MBIR) regarding image quality and dose reduction in liver computed tomography. Invest Radiol 2013;48(8):598–606. [DOI] [PubMed] [Google Scholar]
- 18.Taylor AJ, Cerqueira M, Hodgson JM, et al. ACCF/SCCT/ACR/AHA/ASE/ASNC/NASCI/SCAI/SCMR 2010 appropriate use criteria for cardiac computed tomography. a report of the American College of Cardiology Foundation Appropriate Use Criteria Task Force, the Society of Cardiovascular Computed Tomography, the American College of Radiology, the American Heart Association, the American Society of Echocardiography, the American Society of Nuclear Cardiology, the North American Society for Cardiovascular Imaging, the Society for Cardiovascular Angiography and Interventions, and the Society for Cardiovascular Magnetic Resonance. J Cardiovasc Comput Tomogr 2010;4(6):407.e1–407.e33. [DOI] [PubMed] [Google Scholar]
- 19.Rodriguez-Granillo GA. Delayed enhancement cardiac computed tomography for the assessment of myocardial infarction: from bench to bedside. Cardiovasc Diagn Ther 2017;7(2):159–170. [DOI] [PMC free article] [PubMed] [Google Scholar]
- 20.Nagayama Y, Nakaura T, Oda S, et al. Dual-layer DECT for multiphasic hepatic CT with 50 percent iodine load: a matched-pair comparison with a 120 kVp protocol. Eur Radiol 2018;28(4):1719–1730. [DOI] [PubMed] [Google Scholar]
- 21.Nagayama Y, Iyama A, Oda S, et al. Dual-layer dual-energy computed tomography for the assessment of hypovascular hepatic metastases: impact of closing k-edge on image quality and lesion detectability. Eur Radiol Published online October 30, 2018. [DOI] [PubMed] [Google Scholar]
- 22.Sakabe D, Funama Y, Taguchi K, et al. Image quality characteristics for virtual monoenergetic images using dual-layer spectral detector CT: comparison with conventional tube-voltage images. Phys Med 2018;49:5–10. [DOI] [PubMed] [Google Scholar]
- 23.Marin D, Ramirez-Giraldo JC, Gupta S, et al. Effect of a noise-optimized second-generation monoenergetic algorithm on image noise and conspicuity of hypervascular liver tumors: an in vitro and in vivo study. AJR Am J Roentgenol 2016;206(6):1222–1232. [DOI] [PubMed] [Google Scholar]
- 24.De Cecco CN, Caruso D, Schoepf UJ, et al. A noise-optimized virtual monoenergetic reconstruction algorithm improves the diagnostic accuracy of late hepatic arterial phase dual-energy CT for the detection of hypervascular liver lesions. Eur Radiol 2018;28(8):3393–3404. [DOI] [PubMed] [Google Scholar]
- 25.Yamada Y, Jinzaki M, Tanami Y, Abe T, Kuribayashi S. Virtual monochromatic spectral imaging for the evaluation of hypovascular hepatic metastases: the optimal monochromatic level with fast kilovoltage switching dual-energy computed tomography. Invest Radiol 2012;47(5):292–298. [DOI] [PubMed] [Google Scholar]
- 26.Matsumoto K, Jinzaki M, Tanami Y, Ueno A, Yamada M, Kuribayashi S. Virtual monochromatic spectral imaging with fast kilovoltage switching: improved image quality as compared with that obtained with conventional 120-kVp CT. Radiology 2011;259(1):257–262. [DOI] [PubMed] [Google Scholar]
- 27.Sellerer T, Noël PB, Patino M, et al. Dual-energy CT: a phantom comparison of different platforms for abdominal imaging. Eur Radiol 2018;28(7):2745–2755. [DOI] [PubMed] [Google Scholar]
- 28.Kalisz K, Rassouli N, Dhanantwari A, Jordan D, Rajiah P. Noise characteristics of virtual monoenergetic images from a novel detector-based spectral CT scanner. Eur J Radiol 2018;98:118–125. [DOI] [PubMed] [Google Scholar]
- 29.Chalian H, Kalisz K, Rassouli N, Dhanantwari A, Rajiah P. Utility of virtual monoenergetic images derived from a dual-layer detector-based spectral CT in the assessment of aortic anatomy and pathology: a retrospective case control study. Clin Imaging 2018;52:292–301. [DOI] [PubMed] [Google Scholar]
- 30.Tsang DS, Merchant TE, Merchant SE, Smith H, Yagil Y, Hua CH. Quantifying potential reduction in contrast dose with monoenergetic images synthesized from dual-layer detector spectral CT. Br J Radiol 2017;90(1078):20170290. [DOI] [PMC free article] [PubMed] [Google Scholar]
- 31.von Knobelsdorff-Brenkenhoff F, Schulz-Menger J. Role of cardiovascular magnetic resonance in the guidelines of the European Society of Cardiology. J Cardiovasc Magn Reson 2016;18(1):6. [DOI] [PMC free article] [PubMed] [Google Scholar]
- 32.Nacif MS, Kawel N, Lee JJ, et al. Interstitial myocardial fibrosis assessed as extracellular volume fraction with low-radiation-dose cardiac CT. Radiology 2012;264(3):876–883. [DOI] [PMC free article] [PubMed] [Google Scholar]
- 33.Jablonowski R, Wilson MW, Do L, Hetts SW, Saeed M. Multidetector CT measurement of myocardial extracellular volume in acute patchy and contiguous infarction: validation with microscopic measurement. Radiology 2015;274(2):370–378. [DOI] [PubMed] [Google Scholar]
- 34.Bandula S, White SK, Flett AS, et al. Measurement of myocardial extracellular volume fraction by using equilibrium contrast-enhanced CT: validation against histologic findings. Radiology 2013;269(2):396–403. [DOI] [PubMed] [Google Scholar]
- 35.Treibel TA, Bandula S, Fontana M, et al. Extracellular volume quantification by dynamic equilibrium cardiac computed tomography in cardiac amyloidosis. J Cardiovasc Comput Tomogr 2015;9(6):585–592. [DOI] [PMC free article] [PubMed] [Google Scholar]
- 36.Ohta Y, Kitao S, Watanabe T, et al. Measurement of myocardial extracellular volume fraction from iodine density images using single-source, dual-energy computed tomography: a feasibility study. J Comput Assist Tomogr 2017;41(5):750–756. [DOI] [PubMed] [Google Scholar]
- 37.Lee HJ, Im DJ, Youn JC, et al. Myocardial extracellular volume fraction with dual-energy equilibrium contrast-enhanced cardiac CT in nonischemic cardiomyopathy: a prospective comparison with cardiac MR imaging. Radiology 2016;280(1):49–57. [DOI] [PubMed] [Google Scholar]
- 38.Chang S, Han K, Youn JC, et al. Utility of dual-energy CT-based monochromatic imaging in the assessment of myocardial delayed enhancement in patients with cardiomyopathy. Radiology 2018;287(2):442–451. [DOI] [PubMed] [Google Scholar]
- 39.Ohta Y, Kitao S, Yunaga H, et al. Myocardial delayed enhancement CT for the evaluation of heart failure: comparison to MRI. Radiology 2018;288(3):682–691. [DOI] [PubMed] [Google Scholar]


