

Abstract
Purpose
To develop radiomics-based CT scores for assessing lung disease severity and exacerbation risk in adult patients with cystic fibrosis (CF).
Materials and Methods
This two-center retrospective observational study was approved by an institutional ethics committee, and the need for patient consent was waived. A total of 215 outpatients with CF referred for unenhanced follow-up chest CT were evaluated in two different centers between January 2013 and December 2016. After lung segmentation, chest CT scans from center 1 (training cohort, 162 patients [median age, 29 years; interquartile range {IQR}, 24–36 years; 84 men]) were used to build CT scores from 38 extracted CT features, using five different machine learning techniques trained to predict a clinical prognostic score, the Nkam score. The correlations between the developed CT scores, two different clinical prognostic scores (Liou and CF-ABLE), forced expiratory volume in 1 second (FEV1), and risk of respiratory exacerbations were evaluated in the test cohort (center 2, 53 patients [median age, 27 years; IQR, 22–35 years; 34 men]) using the Spearman rank coefficient.
Results
In the test cohort, all radiomics-based CT scores showed moderate to strong correlation with the Nkam score (R = 0.57 to 0.63, P < .001) and Liou scores (R = −0.55 to −0.65, P < .001), whereas the correlation with CF-ABLE score was weaker (R = 0.28 to 0.38, P = .005 to .048). The developed CT scores showed strong correlation with predicted FEV1 (R = −0.62 to −0.66, P < .001) and weak to moderate correlation with the number of pulmonary exacerbations to occur in the 12 months after the CT examination (R = 0.38 to 0.55, P < .001 to P = .006).
Conclusion
Radiomics can be used to build automated CT scores that correlate to clinical severity and exacerbation risk in adult patients with CF.
Supplemental material is available for this article.
See also the commentary by Elicker and Sohn in this issue.
© RSNA, 2020
Summary
Moderate to strong correlations between machine learning radiomics-based models and clinical prognosis scores (Nkam, Liou, and CF-ABLE) were found in a cohort of patients with cystic fibrosis that was independent from the training cohort.
Key Points
■ Using five different machine learning approaches, radiomics-based scores correlated with Nkam, with correlations ranging from R = 0.57 to 0.63 (P < .001).
■ The developed CT scores showed weak to moderate correlation with the number of pulmonary exacerbations to occur in the coming 12 months (R = 0.38 to 0.55, P < .001 to P = .006).
■ Radiomics applied to thoracic CT images has a prognostic value in adults with cystic fibrosis.
Introduction
Cystic fibrosis (CF) is a recessive autosomal disease caused by mutations in the CF transmembrane conductance regulator gene that encodes for an epithelial chloride channel involved in ion and fluid transport. CF is the most common inherited disease in White individuals and affects more than 70 000 individuals in Europe and the United States combined (1,2). Disease severity mainly depends on the degree of lung involvement, which can lead to terminal respiratory failure. The abnormalities in mucociliary clearance facilitate bronchial infection and inflammation, leading to bronchial wall thickening and mucoid impactions, eventually progressing to bronchiectasis (3).
Prognosis assessment in patients with CF has long relied exclusively on forced expiratory volume in 1 second (FEV1), but this has proven unreliable, as patients may survive for a long period of time even if they have very low lung function. This discrepancy was the basis for developing prognosis scores integrating not only FEV1 but also other pulmonary and extrapulmonary variables, which help to optimize the timing of transplant referral (4).
Although there are continuous advances in lung MRI (5–7), CT remains the main imaging modality in many adult CF referral centers and provides morphologic information that is complementary to spirometry and clinical evaluation. Morphologic changes observed on CT images have been reported to correlate with survival (8), quality of life (9), and pulmonary exacerbations (10,11).
In the absence of available quantification software, lung disease assessment at CT remains visually based. The numerous visual scores that have been published to date (12) share three limitations: Some are time-consuming, require specific training, and are associated with inter- and intrareader variability (13). These limitations prevent their use in clinical practice or as endpoints in clinical trials.
A popular approach to the development of automated quantification methods is based on extracting and mining high-dimensional imaging features, a process known as radiomics (14). Although radiomics has mainly been used to build diagnostic and prognostic models in oncology (14–16), these features can also be extracted from the whole lung to identify potential biomarkers for diffuse lung diseases. In CF, morphologic changes are known to modify the attenuation distribution on CT scans. Palumbo et al identified three histogram shapes depending on the severity of lung disease in patients with CF (17). We hypothesized that a radiomics approach based on machine learning algorithms could be used to quantify the degree of lung impairment in patients with CF. The purpose of this study was to develop radiomics-based CT scores for assessing lung disease severity in adults with CF.
Materials and Methods
This retrospective cohort study was approved by the Institutional Review Board of Société Pneumologie de Langue Française (CEPRO-2017–023), and the need for patient consent was waived.
Patients and CT Examinations
All outpatients seen at two adult CF referral centers between January 2013 and December 2016 for routine follow-up were eligible if an unenhanced chest CT examination was available. Exclusion criteria were as follows: (a) previous lung transplantation, (b) pulmonary exacerbation requiring intravenous antibiotics within 1 month before or after the CT examination, (c) no FEV1 measurement within 2 months before or after the CT examination, and (d) no follow-up information 12 months after the CT examination. A total of 215 patients were evaluated (118 men) with a median age of 29 years (interquartile range [IQR], 24–36 years; range, 18–68 years). One hundred sixty-two patients (median age, 29 years; IQR, 24–36 years; 84 men) from center 1 composed the training cohort, whereas 53 patients (median age, 27; IQR, 22–35 years; 34 men) from center 2 served as the test cohort. Patient characteristics are shown in Table 1
Table 1:
Study Population

Sixty-four patients from center 1 were previously included in a study aiming to develop an automated attenuation-based CT score in patients with CF (18).
CT Imaging
CT examinations were performed on 16- or 64-row devices from different vendors depending on the referral center (Somatom Sensation 16 and Somatom Definition DS, Siemens Healthcare in center 1; and LightSpeed VCT and Revolution CT, GE Healthcare in center 2). The entire lung was scanned at 100, 120, or 140 kV, depending on the patient’s morphology and local scanning protocols. Tube current modulation was used at both centers. Images were reconstructed with a slice thickness of 0.75 to 1.5 mm, using a standard kernel (bf20, bf31, or standard) and a 512 × 512 matrix. All the examinations were reconstructed using a filtered back projection algorithm at center 1, whereas 48 of the 53 examinations performed at center 2 used iterative reconstruction (adaptive statistical iterative reconstruction, 30%). If patients underwent more than one CT examination during the study period, only the examination performed furthest from any exacerbations was used.
Image Analysis
Lungs were segmented using a commercially available automated software program (Myrian XP-Lung version 1.19.1; Intrasense) without manual editing of the segmentation. For each CT examination, both lung segmentations were exported to Matlab (version 2016a; The Mathworks) for radiomic analysis. A total of 38 radiomic features were analyzed (full list is provided in Table E1 [supplement]). These features included global histogram characteristics (seven features), common textural features (24 features), and fractal dimension (seven features). The global histogram characteristics (first order statistics) included mean lung density, standard deviation, mode, kurtosis, skewness, entropy, and energy (19). These elements provide global information on the distribution of gray-level intensities but do not take into account their spatial interrelationship. The textural features (second order statistics) were derived from those proposed by Haralick (20) and extracted using three-dimensional co-occurrence matrices at two scales (distance = 1, 2 voxels). Texture describes different aspects of contextual information, such as local intensity distribution, the degree of uniformity, or amplitude dispersion. The fractal dimension quantifies self-similarity and shape complexity in a given scale. It was calculated using the box-counting algorithm and seven box sizes.
Features were extracted by taking into account the physical dimension in each axis to be resilient to possible differences of slice thickness and intraslice resolution. Specifically, histogram values were calculated by multiplying the number of occurrences with the voxel size, while texture and fractal dimension calculation was performed after image resizing to isotropic resolution (1 × 1 × 1 mm3). The representation with isotropic voxels also eliminates dependencies to rotational differences. To leave the intensity distribution unaffected, nearest neighbor interpolation was applied during image resizing. Finally, all features were scaled to the range [0, 1] before building the prediction models.
Model Construction
To develop and test the models on independent datasets, the cohort from center 1 was used for training the models, whereas the cohort from center 2 was used for testing. The CT scans from the training cohort were used to build a radiomics-based CT score correlating to the Nkam score, a 3-year prognostic score that has been validated in more than 2000 adults with CF (21).
Five machine learning techniques were used to develop the models: (a) ridge regression (22), (b) least absolute shrinkage and selection operator (LASSO) regression (23), (c) elastic net (ENET) (24), (d) an ensemble of decision trees (25), and (e) support vector machines (SVM) (26). The first three methods all provide a linear model to predict the Nkam score with the following equation:
 |
where x=[x1xN] is the input feature vector, N is the number of features, βi (beta coefficient) is the weight assigned to feature i, and β0(intercept) is a constant term. LASSO and ENET also perform feature selection. The ensemble of decision trees represents a combination of tree-like models of decisions, where the data are divided into groups on the basis of splits of selected features (see Appendix El [supplement] for more information on the method and Fig E1 [supplement]). SVM is a technique that performs nonlinear mapping of the original features to increase discrimination ability. To prevent data overfitting by the model, parameters such as regularization and kernel type were optimized for each of the five machine learning methods using a 10-fold cross validation in the training dataset.
The five radiomics-based CT scores that were obtained from the training cohort were then calculated for the patients of the test cohort (center 2) to evaluate the correlation with clinical prognosis scores and other clinically relevant parameters.
An Intel Core i5–6402P CPU @ 2.80GHz (4 Cores) with 8 GB RAM machine was used for computations.
Clinical Data
The percentage of predicted FEV1 at the time of CT (median interval between CT and FEV1 measurement, 0 days; IQR, 0–0 days; range, 0–31 days) was retrieved, along with the number of pulmonary exacerbations requiring intravenous antibiotics within 12 months before and after CT. Additional data available at the time of the CT examination were collected to calculate three clinical prognostic scores, namely the Nkam, CF-ABLE, and Liou scores (21,27,28). The items for these three scores are described in Appendix E3 (supplement).
The data collected from patients included age, sex, body mass index, pancreatic insufficiency, diabetes mellitus, Staphylococcus aureus colonization, Burkholderia cepacia colonization, hospitalization in the previous 12 months, long-term oxygen therapy, noninvasive ventilation, and oral corticosteroid treatment.
Statistical Analysis
Statistical analysis was performed with Matlab (version 2016a) and R software (version 3.3.3; R Foundation). The χ2 and Mann-Whitney U tests were used to compare patient characteristics in the training and test cohorts. P values below .05 were considered to be statistically significant.
The Spearman rank coefficient (R) was calculated in the test cohort to determine the correlation between the radiomics-based CT scores and the Nkam score. The correlations with two other clinical scores used for CF (CF-ABLE and Liou scores), FEV1, and the number of pulmonary exacerbations requiring intravenous antibiotics within 12 months before and after CT were evaluated by the same approach. Spearman R values were interpreted as follows: less than 0.2 = very weak, 0.2–0.39 = weak, 0.40–0.59 = moderate, 0.60–0.79 = strong, and greater than 0.8 = very strong correlation (29). P values were adjusted using the false discovery rate method (30).
Results
Study Population
Patient characteristics are presented in Table 1. Respiratory impairment ranged from absent to very severe. Patients from the first center (training dataset) had more severe disease than those from center 2 (test dataset) according to percent predicted FEV1 (median, 58% [IQR, 41%–77%] vs 70% [IQR, 53%–82%]; P = .002), CF-ABLE (2.0 [IQR, 0.0–3.5] vs 1.0 [IQR, 0.0–3.5], P = .02), and Liou (0.9 [IQR, 0.7–1.0] vs 1.0 [IQR, 0.9–1.0], P < .001) scores. There was no other difference in clinical variables between the patients from the two centers (Table 1), particularly regarding the Nkam score (P = .12), which includes more clinical parameters than the other clinical prognosis scores (see Appendix E2 [supplement] for score items). Eight patients from the training dataset (5%) and four patients from the test dataset (8%) were treated by modulator or potentiator at the time of the chest CT examination.
In addition to the difference in CT equipment, the mean CT radiation dose was lower in the test center cohort (median volumetric CT dose index [CTDIvol] = 3.9 mGy [IQR, 3.2–5.0 mGy] at center 1 vs 1.2 mGy [IQR, 1.1–3.3 mGy] at center 2, P < .001).
Model Construction
LASSO regression selected six parameters: three histogram characteristics (skewness, mode, and energy), two fractal distances (scale of 5 and 6 voxels), and one textural feature (cluster tendency at a distance of 1 voxel). The same parameters and nine additional were selected by ENET. The intercept (β0) and β coefficients of the models obtained with LASSO regression, ridge regression, and ENET are provided in Table E2 (supplement). The ensemble of decision trees algorithm selected only two parameters, which were skewness and mode (Table E3 [supplement]). There was no correlation between possible confounders (CTDIvol, kilovoltage, and reconstruction mode) and CT scores obtained with the five machine learning techniques (P ≥ .31; Table E4 [supplement]).
Radiomic Score Correlations with Clinical Data in the Test Cohort
The radiomics-based CT scores obtained with the five machine learning techniques showed moderate to strong correlation with the Nkam score in the test cohort (R = 0.57 to 0.63, P < .001) (Table 2). Correlation between the Nkam score and the radiomics-based CT score built with LASSO is illustrated in Figure 1. The mean square error between the Nkam score and the CT scores is presented in Table E5 (supplement).
Table 2:
Correlations between Quantitative Variables and CT Scores Obtained with Machine Learning Algorithms

Figure 1:
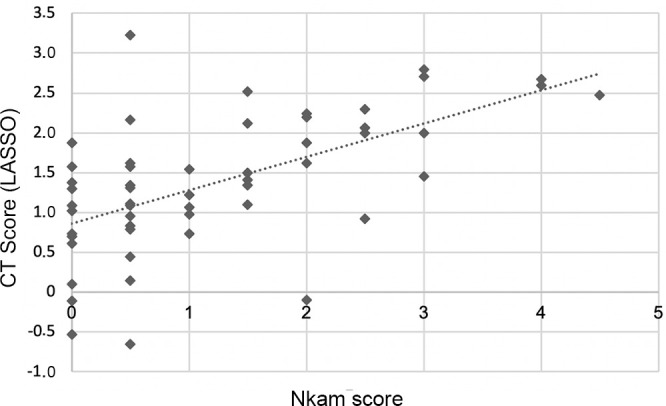
Scatterplot shows the relation between the Nkam score and the radiomics-based CT score built with the least absolute shrinkage and selection operator (LASSO). The Spearman correlation coefficient is 0.59 (P < .001).
CT images from patients with different Nkam scores are shown in Figure 2
Figure 2:

A, The calculated value for the Nkam score was 0.5 in this 20-year-old patient with cystic fibrosis. Using CT images, the radiomics approach predicted a Nkam score value of 0.35 with LASSO and 0.30 with the ensemble of decision trees. B, By comparison, the calculated value for the Nkam score was 3 in this 48-year-old patient with cystic fibrosis. Using CT images, the radiomics approach predicted a Nkam score value of 2.96 with LASSO and 2.11 with the ensemble of decision trees.
Correlations of machine learning scores were also found with other prognosis scores. The correlation with the Liou score (R = −0.55 to −0.65, P < .001) was moderate to strong depending on the machine learning algorithm used, whereas the correlation with the CF-ABLE score was weak (R = 0.28 to 0.38, P = .007 to .048).
In relation to individual clinical variables, all radiomics-based CT scores strongly correlated with predicted FEV1 (R = −0.62 to −0.66, P < .001). All radiomics-based CT scores showed moderate to strong correlation with the number of pulmonary exacerbations that required antibiotics to occur in the 12 months after the CT examination (R = 0.38 to 0.55, P < .001 to P = .006), whereas a significant, although weak, correlation with the number of pulmonary exacerbations that required antibiotics in the previous 12 months was only found with the radiomics-based CT scores build using LASSO (R = 0.29, P = .04) and the ensemble of decision trees (R = 0.39, P = .005). Performance comparison between internal and external testing can be found in Appendix E3 (supplement).
Time Required for Obtaining the Radiomics CT Scores
The total computational cost for each new patient evaluation (including image loading, feature extraction, and score estimation) was less than 1 minute using the above described equipment.
Discussion
In this study, radiomic assessment of adult CF lung CT images allowed for objective image evaluation correlating with previously established CF scoring systems. Correlations between radiomics-based models and clinical prognosis scores were found in a patient cohort independent from the training cohort, as well as correlations with FEV1 and the number of pulmonary exacerbations to occur in the upcoming 12 months. This study shows that radiomics can be used to quantify lung disease in CF, a diffuse bronchial disease that is difficult to evaluate on the basis of visual assessment.
Many radiomic features have been proposed for CT-based medical diagnosis. The most common among them include size and shape descriptors, first- and second-order statistics, fractal dimension, and features derived from wavelet decomposition (16,31–34). All these features were included in our analysis except the wavelet-based features, due to their large hyperparameter space.
A major strength of our study was that the five radiomics models developed in one center remained predictive of disease severity in an external cohort despite different CT equipment and acquisition and reconstruction parameters and use of iterative reconstructions only in the test center. The absence of standardized acquisition protocols was a strength of our study. Indeed, the reproducibility of many textural parameters is influenced by acquisition and reconstruction parameters (31,35,36). Building radiomics-based CT scores from standardized parameters limits their applicability for routine practice. The significant difference in radiation dose between the two centers resulted from differences in acquisition parameters and unavailability of iterative reconstruction at center 1 at that time. Iterative reconstruction can decrease radiation dose by up to 92% in patients with CF (37,38).
Among the five supervised machine learning algorithms that were evaluated, three produced linear models, and two produced nonlinear models. Among the three linear models, only LASSO and ENET include feature selection. Feature selection is useful to produce a sparse model that is easier to interpret and compute (24), especially when numerous features are evaluated. There is no feature selection in ridge regression, but the regularization term shrinks the β coefficient vector toward zero for features that are less relevant. Six and 15 features were respectively selected by LASSO and ENET, compared with 38 features by ridge regression. All the features selected by LASSO regression were also selected by ENET, showing the stability of the regularization term used to build the linear model.
Ensembles of decision trees and SVM produce nonlinear models and were initially developed for classification tasks but can be adapted for regression tasks as well (25,26). Ensembles of decision trees provide a sparse model with a noncontinuous score. In our study, the ensemble of decision trees algorithm built a model based on two features, resulting in a noncontinuous score with only nine possible values to quantify the severity of lung disease. On the other hand, SVM produced a continuous score based on a transformation of all features in the model.
Compared with the other four machine learning techniques evaluated in our study, LASSO had the advantage of producing a sparse model with a continuous score and selecting fewer features than ENET. Sparse models are less computationally expensive, and a continuous score is better suited to a wide spectrum of lung disease severity.
In monitoring patients with CF, CT is used to detect and monitor structural changes in the lung that may precede functional changes (39). To be recognized as surrogate outcomes, certain imaging features should predict clinical endpoints, especially survival (12). However, because of the low annual mortality rate of CF, survival cannot be used to develop a scoring method for this disease. According to the Guideline on the Clinical Development of Medicinal Products for the Treatment of Cystic Fibrosis published by the European Medicines Agency, FEV1 is the only surrogate for mortality that should be considered as a primary endpoint for clinical trials in CF (40). The correlation obtained in our study between the radiomics-based CT scores and FEV1 (R = −0.62 to −0.66, P < .001) was better than that reported in several studies using visual scores (−0.33 to −0.78) (41–44). In addition, compared with visual methods, the radiomics approach has no variability in measurements and does not require spending 10 to 15 minutes per CT examination (43). As outlined by Calder et al (13), the variation in the experience, training, and skill of observers producing visual scores limits their reliability for being used as endpoint in clinical trials. The main advantage of the proposed method is that it is automated and not subjective. Several clinical prognostic scores for CF combine FEV1 with clinical data to improve the prediction of survival (21,27,28). The Nkam score was chosen as the target for the radiomics approach because it has been validated in the largest cohort of patients compared with other scoring systems and is the most recently reported score in the literature. Additionally, the Nkam score takes improvements into account that have been achieved in CF management (21). Moreover, this score, which was developed in a French adult CF population, has been recently validated in a Canadian CF population (45).
As the models were trained to predict the Nkam score, the strong correlations of the machine learning models with this score were expected; however, these were not perfect correlations. We also tested the model score correlations with other clinical scores, and a strong correlation was found with the Liou score, whereas a weaker correlation was observed with CF-ABLE. The five radiomics-based CT scores also correlated with the risk of further pulmonary exacerbations, which is an important clinical endpoint. Although only weak to moderate, this correlation was better than that previously reported by authors using visual scoring (R = 0.28) (11).
This study had several limitations. First, the proposed radiomics-based CT scores provided an overall estimation of structural changes in the lung but cannot separately quantify irreversible bronchiectasis and changes such as bronchial wall thickening or mucous plugging, which are potentially reversible using the newly developed therapies (46). The link between radiomics and morphologic changes has not been evaluated. The selection of mode, which is the most represented attenuation value, is understandable because lung attenuation is modified by CF-induced lung changes, but the selection of features such as energy or fractal distance are more difficult to explain. Finally, we deliberately based our score on inspiratory CT images and did not additionally use expiratory CT images.
In conclusion, our study supports the feasibility of using radiomics for automated quantification of CF lung disease severity on CT scans performed at different institutions. This automated method of severity assessment at CT could prove useful for daily practice and evaluation of responsiveness to newly developed therapies. It further offers new perspectives for the quantification of diffuse bronchiectasis outside the specific field of cystic fibrosis.
APPENDIX
SUPPLEMENTAL FIGURES
Disclosures of Conflicts of Interest: G.C. disclosed no relevant relationships. E.I.Z. disclosed no relevant relationships. S.B. Activities related to the present article: disclosed no relevant relationships. Activities not related to the present article: disclosed money paid to author’s institution from AstraZeneca for research protocol on chest CT to predict response to Benralizumab; disclosed money paid to author from Boehringer Ingelheim, AstraZeneca, and GSK for lectures, including service on speakers bureaus; disclosed money paid to author from Boehringer Ingelheim for travel/accommodations/meeting expenses unrelated to activities listed. Other relationships: disclosed no relevant relationships. P.R.B. Activities related to the present article: disclosed no relevant relationships. Activities not related to the present article: disclosed money paid to author from Vertex and AstraZeneca for board membership; disclosed money paid to author from AstraZeneca, Boehringer Ingelheim, Chiesi, GSK, Insmed, Novartis, Pfizer, Teva, Vertex, and Zambon for consultancy. Other relationships: disclosed no relevant relationships. R.C. disclosed no relevant relationships. S.D. disclosed no relevant relationships. N.P. Activities related to the present article: disclosed no relevant relationships. Activities not related to the present article: disclosed money paid to author from Artredrone and Easyrescue for board membership; disclosed money paid to author from AstraZeneca and Ipsen for consultancy; disclosed money paid to author from TheraPanacea for employment. Other relationships: disclosed no relevant relationships. C.M. Activities related to the present article: disclosed no relevant relationships. Activities not related to the present article: disclosed money paid to author from Zambon for consultancy; disclosed money paid to author from Chiesi, Vertex, Novartis, ALK, Zambon, and Sunpharma for lectures, including service on speakers bureaus. Other relationships: disclosed no relevant relationships. M.P.R. disclosed no relevant relationships.
G.C. and E.I.Z. contributed equally to this work.
This work received financial support from the patient association Vaincre la Mucoviscidose.
Abbreviations:
- CF
- cystic fibrosis
- CTDIvol
- volumetric CT dose index
- ENET
- elastic net
- FEV1
- forced expiratory volume in 1 second
- IQR
- interquartile range
- LASSO
- least absolute shrinkage and selection operator
- SVM
- support vector machine
References
- 1.Stephenson AL, Stanojevic S, Sykes J, Burgel PR. The changing epidemiology and demography of cystic fibrosis. Presse Med 2017;46(6 Pt 2):e87–e95. [DOI] [PubMed] [Google Scholar]
- 2.Cystic Fibrosis Foundation . Patient Registry: Annual Data Report to the Center Directors 2013. Bethesda, Md: Cystic Fibrosis Foundation, 2014. [Google Scholar]
- 3.Wood BP. Cystic fibrosis: 1997. Radiology 1997;204(1):1–10. [DOI] [PubMed] [Google Scholar]
- 4.Bell SC, Mall MA, Gutierrez H, et al. The future of cystic fibrosis care: a global perspective. Lancet Respir Med 2020;8(1):65–124. [DOI] [PMC free article] [PubMed] [Google Scholar]
- 5.Vult von Steyern K, Björkman-Burtscher IM, Geijer M. Radiography, tomosynthesis, CT and MRI in the evaluation of pulmonary cystic fibrosis: an untangling review of the multitude of scoring systems. Insights Imaging 2013;4(6):787–798. [DOI] [PMC free article] [PubMed] [Google Scholar]
- 6.Dournes G, Grodzki D, Macey J, et al. Quiet Submillimeter MR Imaging of the Lung Is Feasible with a PETRA Sequence at 1.5 T. Radiology 2015;276(1):258–265. [DOI] [PubMed] [Google Scholar]
- 7.Ciet P, Serra G, Bertolo S, et al. Assessment of CF lung disease using motion corrected PROPELLER MRI: a comparison with CT. Eur Radiol 2016;26(3):780–787. [DOI] [PubMed] [Google Scholar]
- 8.Loeve M, Hop WCJ, de Bruijne M, et al. Chest computed tomography scores are predictive of survival in patients with cystic fibrosis awaiting lung transplantation. Am J Respir Crit Care Med 2012;185(10):1096–1103. [DOI] [PubMed] [Google Scholar]
- 9.Tepper LA, Caudri D, Utens EMWJ, van der Wiel EC, Quittner AL, Tiddens HAWM. Tracking CF disease progression with CT and respiratory symptoms in a cohort of children aged 6-19 years. Pediatr Pulmonol 2014;49(12):1182–1189. [DOI] [PubMed] [Google Scholar]
- 10.Loeve M, Gerbrands K, Hop WC, Rosenfeld M, Hartmann IC, Tiddens HA. Bronchiectasis and pulmonary exacerbations in children and young adults with cystic fibrosis. Chest 2011;140(1):178–185. [DOI] [PubMed] [Google Scholar]
- 11.Brody AS, Sucharew H, Campbell JD, et al. Computed tomography correlates with pulmonary exacerbations in children with cystic fibrosis. Am J Respir Crit Care Med 2005;172(9):1128–1132. [DOI] [PubMed] [Google Scholar]
- 12.Szczesniak R, Turkovic L, Andrinopoulou ER, Tiddens HAWM. Chest imaging in cystic fibrosis studies: What counts, and can be counted? J Cyst Fibros 2017;16(2):175–185. [DOI] [PMC free article] [PubMed] [Google Scholar]
- 13.Calder AD, Bush A, Brody AS, Owens CM. Scoring of chest CT in children with cystic fibrosis: state of the art. Pediatr Radiol 2014;44(12):1496–1506. [DOI] [PubMed] [Google Scholar]
- 14.Gillies RJ, Kinahan PE, Hricak H. Radiomics: Images Are More than Pictures, They Are Data. Radiology 2016;278(2):563–577. [DOI] [PMC free article] [PubMed] [Google Scholar]
- 15.Huang P, Park S, Yan R, et al. Added Value of Computer-aided CT Image Features for Early Lung Cancer Diagnosis with Small Pulmonary Nodules: A Matched Case-Control Study. Radiology 2018;286(1):286–295. [DOI] [PMC free article] [PubMed] [Google Scholar]
- 16.Limkin EJ, Sun R, Dercle L, et al. Promises and challenges for the implementation of computational medical imaging (radiomics) in oncology. Ann Oncol 2017;28(6):1191–1206. [DOI] [PubMed] [Google Scholar]
- 17.Palumbo AA, Luccichenti G, Belgrano M, et al. Three-dimensional quantitative assessment of lung parenchyma in cystic fibrosis: preliminary results. Radiol Med (Torino) 2007;112(1):21–30. [DOI] [PubMed] [Google Scholar]
- 18.Chassagnon G, Martin C, Burgel PR, et al. An automated computed tomography score for the cystic fibrosis lung. Eur Radiol 2018;28(12):5111–5120. [DOI] [PubMed] [Google Scholar]
- 19.Lubner MG, Smith AD, Sandrasegaran K, Sahani DV, Pickhardt PJ. CT Texture Analysis: Definitions, Applications, Biologic Correlates, and Challenges. RadioGraphics 2017;37(5):1483–1503. [DOI] [PubMed] [Google Scholar]
- 20.Haralick RM. Statistical and structural approaches to texture. Proc IEEE 1979;67(5):786–804. [Google Scholar]
- 21.Nkam L, Lambert J, Latouche A, Bellis G, Burgel PR, Hocine MN. A 3-year prognostic score for adults with cystic fibrosis. J Cyst Fibros 2017;16(6):702–708. [DOI] [PubMed] [Google Scholar]
- 22.Hoerl A, Kennard R. Ridge regression. In: Encycl Stat Sci. New York, NY: Wiley, 1988; 129–136. [Google Scholar]
- 23.Tibshirani R. Regression Shrinkage and Selection via the Lasso. J R Stat Soc Series B Stat Methodol 1996;58(1):267–288. [Google Scholar]
- 24.Zou H, Hastie T. Regularization and variable selection via the elastic net. J R Stat Soc Series B Stat Methodol 2005;67(2):301–320. [Google Scholar]
- 25.Quinlan JR. Induction of decision trees. Mach Learn 1986;1(1):81–106. [Google Scholar]
- 26.Schölkopf B, Smola AJ. Learning with kernels: support vector machines, regularization, optimization, and beyond. Cambridge, Mass: MIT Press, 2002. [Google Scholar]
- 27.Liou TG, Adler FR, Fitzsimmons SC, Cahill BC, Hibbs JR, Marshall BC. Predictive 5-year survivorship model of cystic fibrosis. Am J Epidemiol 2001;153(4):345–352. [DOI] [PMC free article] [PubMed] [Google Scholar]
- 28.McCarthy C, Dimitrov BD, Meurling IJ, Gunaratnam C, McElvaney NG. The CF-ABLE score: a novel clinical prediction rule for prognosis in patients with cystic fibrosis. Chest 2013;143(5):1358–1364. [DOI] [PubMed] [Google Scholar]
- 29.Evans JD. Straightforward statistics for the behavioral sciences. Belmont, Calif: Thomson Brooks/Cole; 1996; xxii, 600. [Google Scholar]
- 30.Benjamini Y, Hochberg Y. Controlling the False Discovery Rate: A Practical and Powerful Approach to Multiple Testing. J R Stat Soc Series B Stat Methodol 1995;57(1):289–300. [Google Scholar]
- 31.Shafiq-Ul-Hassan M, Zhang GG, Latifi K, et al. Intrinsic dependencies of CT radiomic features on voxel size and number of gray levels. Med Phys 2017;44(3):1050–1062. [DOI] [PMC free article] [PubMed] [Google Scholar]
- 32.Coroller TP, Grossmann P, Hou Y, et al. CT-based radiomic signature predicts distant metastasis in lung adenocarcinoma. Radiother Oncol 2015;114(3):345–350. [DOI] [PMC free article] [PubMed] [Google Scholar]
- 33.Schniering J, Brunner M, Distler O, et al. Texture-Based Radiomics Features Discriminate Different Stages of Experimental Interstitial Lung Disease. Ann Rheum Dis 2019;78(Suppl 2):454.30636213 [Google Scholar]
- 34.Ryan SM, Fingerlin TE, Mroz M, et al. Radiomic measures from chest high-resolution computed tomography associated with lung function in sarcoidosis. Eur Respir J 2019;54(2):1900371. [DOI] [PMC free article] [PubMed] [Google Scholar]
- 35.Lu L, Ehmke RC, Schwartz LH, Zhao B. Assessing Agreement between Radiomic Features Computed for Multiple CT Imaging Settings. PLoS One 2016;11(12):e0166550. [DOI] [PMC free article] [PubMed] [Google Scholar]
- 36.Midya A, Chakraborty J, Gönen M, Do RKG, Simpson AL. Influence of CT acquisition and reconstruction parameters on radiomic feature reproducibility. J Med Imaging (Bellingham) 2018;5(1):011020. [DOI] [PMC free article] [PubMed] [Google Scholar]
- 37.Miéville FA, Berteloot L, Grandjean A, et al. Model-based iterative reconstruction in pediatric chest CT: assessment of image quality in a prospective study of children with cystic fibrosis. Pediatr Radiol 2013;43(5):558–567. [DOI] [PubMed] [Google Scholar]
- 38.Loeve M, Lequin MH, de Bruijne M, et al. Cystic fibrosis: are volumetric ultra-low-dose expiratory CT scans sufficient for monitoring related lung disease? Radiology 2009;253(1):223–229. [DOI] [PubMed] [Google Scholar]
- 39.Cademartiri F, Luccichenti G, Palumbo AA, et al. Predictive value of chest CT in patients with cystic fibrosis: a single-center 10-year experience. AJR Am J Roentgenol 2008;190(6):1475–1480. [DOI] [PubMed] [Google Scholar]
- 40.Committee for Medicinal Products for Human Use . Guideline on the clinical development of medicinal products for the treatment of cystic fibrosis. London, England: European Medicines Agency, 2009. http://www.ema.europa.eu/docs/en_GB/document_library/Scientific_guideline/2009/09/WC500003507.pdf. Accessed April 13, 2017. [Google Scholar]
- 41.Shah RM, Sexauer W, Ostrum BJ, Fiel SB, Friedman AC. High-resolution CT in the acute exacerbation of cystic fibrosis: evaluation of acute findings, reversibility of those findings, and clinical correlation. AJR Am J Roentgenol 1997;169(2):375–380. [DOI] [PubMed] [Google Scholar]
- 42.Dorlöchter L, Nes H, Fluge G, Rosendahl K. High resolution CT in cystic fibrosis--the contribution of expiratory scans. Eur J Radiol 2003;47(3):193–198. [DOI] [PubMed] [Google Scholar]
- 43.de Jong PA, Ottink MD, Robben SGF, et al. Pulmonary disease assessment in cystic fibrosis: comparison of CT scoring systems and value of bronchial and arterial dimension measurements. Radiology 2004;231(2):434–439. [DOI] [PubMed] [Google Scholar]
- 44.Brody AS, Klein JS, Molina PL, Quan J, Bean JA, Wilmott RW. High-resolution computed tomography in young patients with cystic fibrosis: distribution of abnormalities and correlation with pulmonary function tests. J Pediatr 2004;145(1):32–38. [DOI] [PubMed] [Google Scholar]
- 45.Coriati A, Sykes J, Nkam L, Hocine MN, Burgel PR, Stephenson AL. Validation of the French 3-year prognostic score using the Canadian Cystic Fibrosis registry. J Cyst Fibros 2019;18(3):396–398. [DOI] [PubMed] [Google Scholar]
- 46.Chassagnon G, Hubert D, Fajac I, Burgel PR, Revel MP; investigators . Long-term computed tomographic changes in cystic fibrosis patients treated with ivacaftor. Eur Respir J 2016;48(1):249–252. [DOI] [PubMed] [Google Scholar]
Associated Data
This section collects any data citations, data availability statements, or supplementary materials included in this article.