Abstract
Purpose
To evaluate the diagnostic performance of a prototype on-site coronary CT angiography–derived fractional flow reserve (CT FFR) algorithm, based on patient-specific lumped parameter models, for the detection of functionally significant stenosis defined by invasive FFR, and to compare the performance to anatomic evaluation of stenosis degree.
Materials and Methods
In this retrospective feasibility study, 77 vessels in 57 patients (42 of 57 [74%]) men; mean age, 58.5 years ± 9.2 [standard deviation]) who underwent clinically indicated coronary CT angiography within 60 days prior to an invasive FFR measurement were analyzed. Invasive FFR less than or equal to 0.80 was used to indicate a functionally significant stenosis. Diagnostic performance of CT FFR was evaluated and compared with evaluation of stenosis degree. Analysis was performed on a per-vessel basis.
Results
Invasive FFR revealed functionally significant stenoses in 37 vessels (48%). CT FFR showed a significantly increased ability to indicate functionally significant stenosis (area under the receiver operating characteristic curve [AUC], 0.87) compared with degree of stenosis at coronary CT angiography (AUC, 0.70; ΔAUC 0.17; P < .01). Using a cutoff of less than or equal to 0.80 for CT FFR and greater than or equal to 50% degree of stenosis at coronary CT angiography to indicate a significant stenosis, sensitivity, specificity, positive predictive value, negative predictive value, and accuracy were 33 of 37 (89.2%), 31 of 40 (77.5%), 33 of 42 (78.6%), 31 of 35 (88.6%), and 64 of 77 (83.1%), respectively, for CT FFR, and 33 of 37 (89.2%), 17 of 40 (42.5%), 33 of 56 (58.9%), 17 of 21 (81.0%), and 50 of 77 (64.9%), respectively, for degree of stenosis at coronary CT angiography.
Conclusion
Diagnostic performance of on-site CT FFR was superior to stenosis evaluation at coronary CT angiography for identification of functionally significant coronary artery stenosis in patients suspected of having or known to have coronary artery disease.
© RSNA, 2019
See also commentary by Schoepf et al.
Summary
Diagnostic performance of on-site coronary CT angiography–derived fractional flow reserve was superior to stenosis evaluation at coronary CT angiography for identification of functionally significant coronary artery stenosis in patients suspected of having or known to have coronary artery disease.
Key Points
■ On-site coronary CT angiography–derived fractional flow reserve (CT FFR) allows for accurate functional analysis of coronary stenosis in a noninvasive manner.
■ Diagnostic performance of on-site CT FFR is superior to stenosis evaluation at coronary CT angiography for identification of functionally significant coronary artery stenosis.
Introduction
Coronary CT angiography is an established noninvasive diagnostic tool for the detection of coronary artery disease (CAD) (1). However, it is limited to anatomic evaluation of degree of stenosis, which does not necessarily imply myocardial ischemia (2,3). This issue is underscored by the findings of a recent meta-analysis that demonstrated the incremental value of functional evaluation of coronary stenosis found at coronary CT angiography (4). Invasive fractional flow reserve (FFR) is considered the current standard of reference for assessment of coronary artery lesion–specific functional significance and is used to guide revascularization treatment (5,6). The recent introduction of coronary CT angiography–derived FFR (CT FFR) allows for functional evaluation of coronary stenosis in a noninvasive manner (7). The most widely used CT FFR algorithm is based on the principles of computational fluid dynamics (CFD) and has been shown to improve diagnostic performance of coronary CT angiography for the evaluation of functionally significant stenosis (4,8–11). However, because of the complexity of the CFD calculations, CT images need to be transferred to an off-site workstation, and results could take several hours to obtain. Alternative algorithms using less computational power have been introduced and allow for on-site evaluation of CT FFR (12–19).
The aim of the current study was to evaluate the diagnostic performance of an on-site CT FFR algorithm based on patient-specific lumped parameter models and to compare the performance to anatomic coronary CT angiographic evaluation of degree of stenosis.
Materials and Methods
Industry Support
The research prototype CT FFR software (FFR-CT, IntelliSpace Portal, version 9.0.1.20490; Philips Healthcare, Cambridge, Mass) used in the current study was freely provided by Philips Healthcare. The sponsors had no role in the design and conduct of the study, in the collection, analysis, and interpretation of the data, or in the preparation.
Study Design and Population
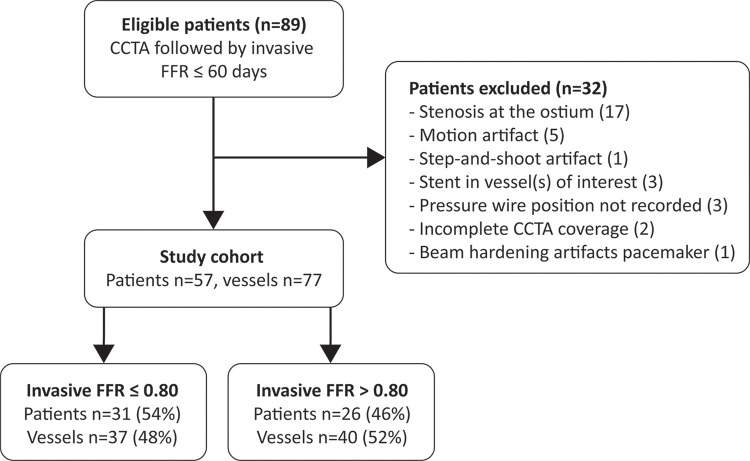
To evaluate the performance of the on-site CT FFR algorithm, we conducted a retrospective, single-center, observational feasibility study. Our local institutional review board approved this study, and the need for informed consent was waived on the basis of the retrospective design of the study. Between 2012 and 2016, 89 consecutive patients suspected of having or known to have CAD who underwent coronary CT angiography followed by invasive FFR within 60 days were retrospectively selected. Patients were excluded when one of the following criteria was met: history of coronary artery bypass graft (n = 0), coronary anomalies or complex congenital heart disease (n = 0), incomplete coronary CT angiography coverage (n = 2), pressure wire position during invasive FFR not recorded (n = 3), noninterpretable segment(s) in coronary artery (eg, motion artifact [n = 5]), beam-hardening artifact due to pacemaker [n = 1], or step-and-shoot artifact [n = 1]), presence of a stenosis at the ostium (n = 17), or stent in vessel(s) of interest (n = 3). The final study cohort consisted of 57 patients (Fig 1).
Figure 1:
Patient flowchart. CCTA = coronary CT angiography, FFR = fractional flow reserve.
Coronary CT Angiography
Image acquisition was performed in accordance with Society of Cardiovascular Computed Tomography (SCCT) guidelines (20). If needed, β-blockers were administered to target a heart rate of 60 beats per minute. CT scans were performed using a 256-section CT scanner (Brilliance iCT; Philips Healthcare). A noncontrast prospective electrocardiographically (ECG) triggered CT scan was performed to evaluate coronary calcium score on a per–coronary artery basis. Subsequently, 0.4 mg of nitroglycerine was sublingually administered to all patients. A 90- to 100-mL bolus of intravenous contrast agent (iopromide, Ultravist 300; Bayer Healthcare Pharmaceuticals, Berlin, Germany) was injected using a flow rate of 6 to 6.7 mL/sec. Coronary CT angiography was performed by using a prospectively ECG-triggered sequential scan (≤60 beats per minute) or retrospectively ECG-gated helical scan (>60 beats per minute). Depending on body mass, tube voltage ranged between 80 and 120 kVp and tube current between 200 and 300 mAs for prospectively triggered scans and 600 mAs for retrospectively gated scans. Images were reconstructed with a section thickness of 0.9 mm and an increment of 0.45 mm using a standard kernel. An observer (R.W.v.H.) with 3 years of experience in cardiovascular imaging, blinded to the invasive FFR and CT FFR results, assessed the degree of maximal stenosis for the vessels of interest using SCCT guidelines: 0% (no stenosis), 1%–24% (minimal stenosis), 25%–49% (mild stenosis), 50%–69% (moderate stenosis), 70%–99% (severe stenosis), and 100% (occlusion) (21). A stenosis of greater than or equal to 50% was used to indicate a significant stenosis at coronary CT angiography.
Invasive Coronary Angiography and FFR
Invasive coronary angiography and FFR were performed for clinical indications and according to standard clinical guidelines. An FFR pressure wire (PressureTM CertusTM Wire; St Jude Medical, St Paul, Minn) was placed 1–2 cm distal to the coronary stenosis of interest; in the case of (suspicion of) multiple stenoses, the wire was placed 1–2 cm distal to the most distal lesion. Stenoses in sites of the coronary artery with a diameter smaller than 2 mm were not taken into account. FFR was measured during continuous intravenous infusion of adenosine at 140 μg/kg/min for 3 minutes. FFR was automatically calculated as ratio of pressure measured distal to the stenosis and at the level of the guiding catheter. An FFR less than or equal to 0.80 was used to indicate a functionally significant stenosis. The exact location of each FFR measurement was recorded during the invasive coronary angiography procedure.
On-Site CT FFR
CT FFR calculations were performed by using research prototype software (FFR-CT, IntelliSpace Portal, version 9.0.1.20490; Philips Healthcare). The CT FFR analysis was performed by an observer (R.W.v.H.) with 3 years of experience in cardiovascular imaging, blinded to the invasive FFR locations and results. First, coronary artery centerlines were automatically generated by the software and corrected where needed by the observer. Centerlines were used as input for the automatic lumen segmentation, which was also manually corrected where needed. The coronary lumen was segmented from the ostium to the most distal part where the lumen had a diameter of 1.5 mm or greater. Coronary arteries with diameters smaller than 1.5 mm were not taken into account, as the spatial resolution of CT limits accurate segmentation of these smaller vessels. Subsequently, a three-dimensional anatomic model of the coronary artery tree was generated and used as an input for the on-site CT FFR algorithm. The on-site CT FFR algorithm uses a patient-specific lumped parameter model, whereby parameters used by the model are based on patient-specific coronary artery lumen segmentations. In brief, the model works by converting the coronary artery tree into different segments. For each segment, the hydraulic effect is determined by analyzing the local geometry of that segment (eg, radius, curvature, length, cross-section, and perimeter) and applying simple equations governing flow and friction in tubular structures. The hydraulic effects are represented as an electrical circuit and thereby as a lumped parameter model. The local hydraulic effects of the segments are represented as resistors and summed along the centerline to represent the complete coronary artery tree in a lumped parameter model. Boundary conditions are represented in the model as inflow and outflow resistors and are determined based on the ostium and outflow segment geometry. The lumped parameter model is used to simulate blood flow and pressure drop, thereby allowing for noninvasive CT FFR simulation of the whole coronary tree. Because computation is performed for the whole coronary tree, the whole coronary tree connected to the coronary artery of interest needs to be segmented (ie, the whole coronary tree on the left or the whole coronary tree on the right). A more detailed description of the used CT FFR prototype can be found elsewhere (22), and this existing CT FFR algorithm was implemented in a software package (FFR-CT, IntelliSpace Portal, version 9.0.1.20490; Philips Healthcare), which combined a structured analysis of the coronary artery centerline and lumen segmentation with CT FFR analysis. After completion of the CT FFR simulation, the exact location of invasive FFR was projected to the segmented coronary tree at coronary CT angiography by using anatomic landmarks, and the CT FFR value at this position was recorded. Similar to invasive FFR, a CT FFR value of less than or equal to 0.80 was used to indicate a functionally significant stenosis.
Statistical Analysis
Categorical variables are reported as total number and percentage and continuous variables as mean with standard deviation or median with interquartile range, as appropriate. CT FFR and degree of stenosis at coronary CT angiography were compared with those at invasive FFR, and diagnostic performance was evaluated on a per-vessel basis using sensitivity, specificity, positive predictive value, negative predictive value, accuracy, and area under the receiver operating characteristic curve (AUC), with corresponding 95% confidence interval (CI). Statistical differences in sensitivity and specificity were evaluated by using the McNemar test, and differences in AUC were evaluated by using the method of DeLong et al (23). The optimal CT FFR threshold of the receiver operating characteristic curve was defined by using the Youden index. Correlation between CT FFR and invasive FFR measurements were evaluated by using the Pearson correlation coefficient. Agreement between both methods was evaluated by using a Bland-Altman plot with corresponding 95% limits of agreement. To evaluate interpretability of CT FFR values, diagnostic accuracy of different CT FFR ranges was evaluated. All results were evaluated on a per-vessel basis. A separate analysis was performed for vessels with intermediate degree of stenosis (25%–69%) at coronary CT angiography. Additionally, separate diagnostic performance was also computed for vessels containing no to mild Agatston score (0–100) and those with moderate to high calcium Agatston scores (≥101). To allow for evaluation on a patient basis, additional patient-based analyses were performed, whereby in the case of multiple CT FFR measurements, the lowest CT FFR measurement was used to represent the index test for that patient. For degree of stenosis at coronary CT angiography, the highest degree of stenosis was used to represent the index test for that patient. Lowest invasive FFR measurement was used to represent the reference standard for each patient. P values less than .05 were considered statistically significant. Statistical analysis was performed by using IBM SPSS version 25.0 (IBM, Armonk, NY) and MedCalc Statistical Software version 17.8.2 (MedCalc Software, Ostend, Belgium).
Results
In 57 patients (74% male patients; mean age, 58.5 years ± 9.2 [standard deviation]), 77 vessels were evaluated. Detailed patient characteristics are summarized in Table 1. FFR was performed in the left anterior descending artery (46 of 77 [60%]), circumflex artery (16 of 77 [21%]), and right coronary artery (15 of 77 [19%]). Invasive FFR revealed a functionally significant stenosis in 37 of 77 vessels (48%). Of all evaluated vessels (n = 77), the maximum degree of stenosis at coronary CT angiography was 0% in one vessel, 25%–69% in 69 vessels, and 70%–99% in seven vessels. In the complete data set, a maximum degree of stenosis greater than or equal to 50% at coronary CT angiography was found in 56 of 77 (73%) vessels and a CT FFR of less than or equal to 0.80 in 42 of 77 (55%) vessels. For CT FFR, the median time per patient for semiautomatic segmentation depended on the extent of CAD and was 25 minutes (interquartile range, 23 minutes) for the centerline and 11 minutes (interquartile range, 6 minutes) for the lumen. After the adjusted segmentations were considered acceptable by the observer, simulation of the CT FFR by the on-site CT FFR software required, on average, 8 seconds ± 1 per patient. A case example of CT FFR analysis is shown in Figure 2.
Table 1:
Patient Characteristics
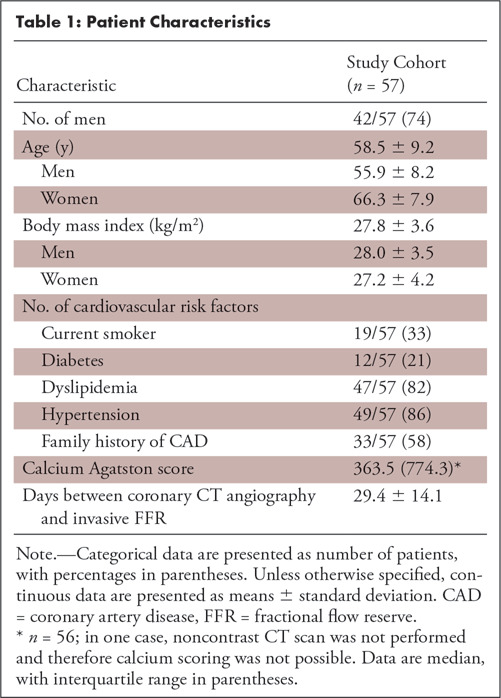
Figure 2:
Example of CT angiography–derived fractional flow reserve (CT FFR) analysis. Coronary CT angiographic curved multiplanar reconstruction of the left anterior descending artery indicated, A, a significant stenosis (white arrow; 50%–69% degree of stenosis). To apply the CT FFR algorithm, first, B, the centerline was automatically segmented and manually corrected where needed; C, D, subsequently, automatic lumen segmentation was performed and also manually corrected where needed. E, This anatomic model of the coronary tree was used as input for the CT FFR algorithm. In this case, CT FFR was 0.75 (black arrow), indicating a significant stenosis (white arrow). F, Findings were confirmed by invasive FFR with a value of 0.76 (black arrow).
Diagnostic Performance
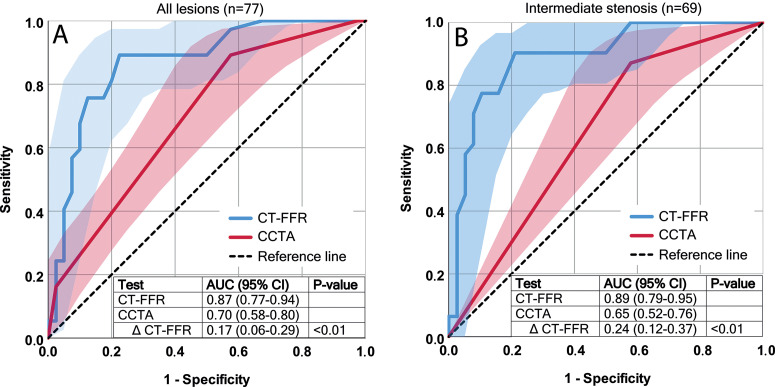
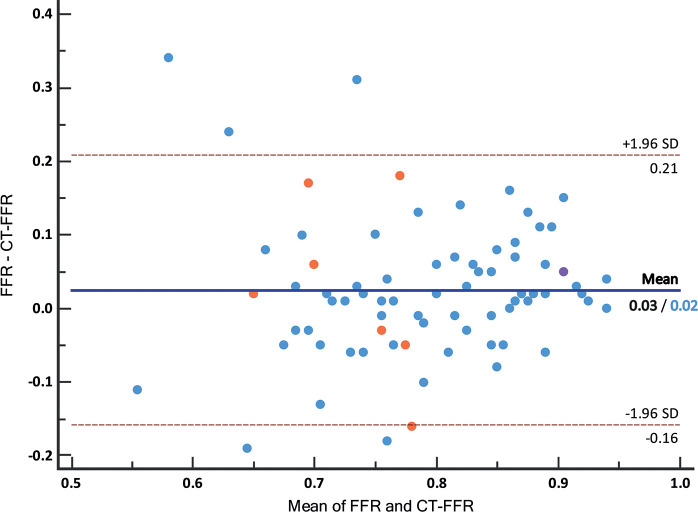
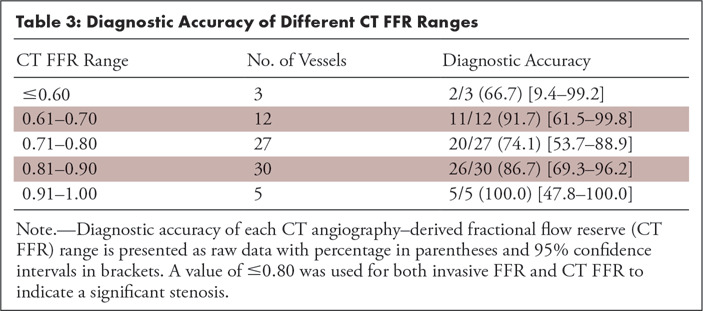
CT FFR showed an increased ability to indicate a functionally significant stenosis with an AUC of 0.87 (95% CI: 0.77, 0.94) compared with degree of stenosis at coronary CT angiography with an AUC of 0.70 (95% CI: 0.58, 0.80) with a difference in AUC of 0.17 (95% CI: 0.06, 0.29) (P < .01) (Fig 3). When applying the threshold of greater than or equal to 50% degree of stenosis to indicate a significant stenosis at coronary CT angiography, sensitivity and specificity were 33 of 37 (89.2%) (95% CI: 74.6, 97.0) and 17 of 40 (42.5%) (95% CI: 27.0, 59.1), respectively. Applying the threshold of less than or equal to 0.80 at CT FFR resulted in an equal sensitivity of 33 of 37 (89.2%) (95% CI: 74.6, 97.0) and significantly increased specificity of 31 of 40 (77.5%) (95% CI: 61.5, 89.2) (P < .01). Overall accuracy was higher for CT FFR (64 of 77 [83.1%] [95% CI: 72.9, 90.7]) compared with evaluation of stenosis degree at coronary CT angiography (50 of 77 [64.9%] [95% CI: 53.2, 75.5]). Other diagnostic parameters are summarized in Table 2. Optimal CT FFR threshold of the receiver operating characteristic curve, defined by Youden index, was 0.80. Pearson correlation between CT FFR and invasive FFR for all measurements was r = 0.55 (Fig 4). Mean invasive FFR was 0.80 ± 0.10, and Bland-Altman analysis showed that CT FFR underestimated the invasive FFR value slightly (mean bias, 0.03 ± 0.09) (Fig 5). Diagnostic accuracy of different CT FFR ranges is provided in Table 3.
Figure 3:
Receiver operating characteristic (ROC) curves for CT angiography–derived fractional flow reserve (CT FFR) (blue line) and degree of stenosis at coronary CT angiography (CCTA) (red line) with 95% confidence interval bands (blue and red areas) and corresponding area under the ROC curve (AUC) values in, A, all lesions and in, B, intermediate lesions only.
Table 2:
Per-Vessel Diagnostic Performance
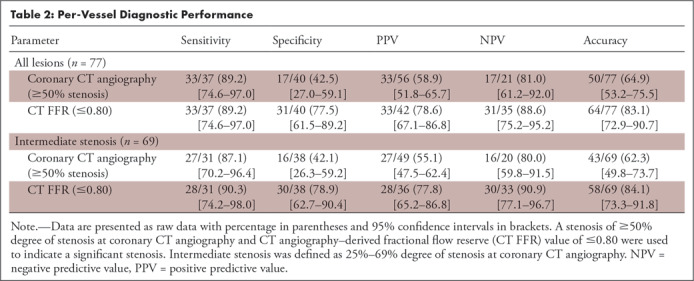
Figure 4:
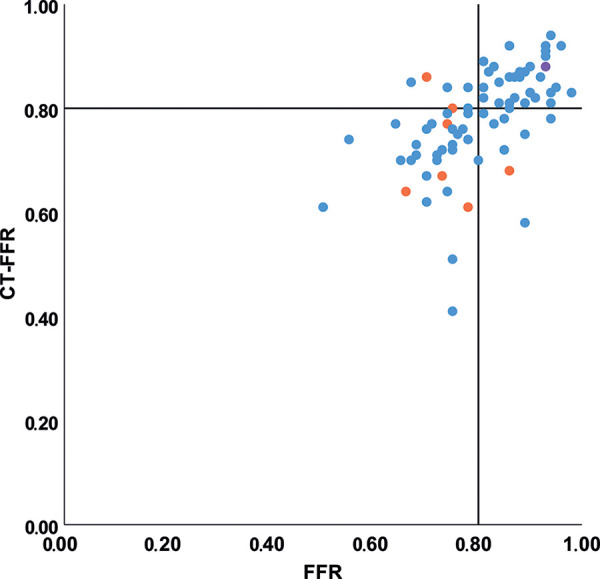
Scatterplot of CT angiography–derived fractional flow reserve (CT FFR) and invasive FFR values. Color of the dots indicates degree of stenosis at coronary CT angiography, with low-grade stenosis (<25%, one vessel) in purple, intermediate-degree stenosis (25%–69%, 69 vessels) in blue, and high-grade stenosis (≥70%, seven vessels) in orange. Pearson correlation coefficient for all lesions was r = 0.55 and for intermediate stenosis only r = 0.56. Black lines indicate the cutoff value used for both invasive FFR (0.80) and CT FFR (0.80).
Figure 5:
Bland-Altman plot of CT angiography–derived fractional flow reserve (CT FFR) and invasive FFR values. Color of the dots indicates degree of stenosis at coronary CT angiography, with low-grade stenosis (<25%, one vessel) in purple, intermediate-degree stenosis (25%–69%, 69 vessels) in blue, and high-grade stenosis (≥70%, seven vessels) in orange. Mean difference was 0.03 for all lesions and 0.02 for intermediate stenosis only, ±1.96 standard deviation (SD) was similar for both groups with an interval of −0.16 to 0.21.
Table 3:
Diagnostic Accuracy of Different CT FFR Ranges
Intermediate Stenosis
Intermediate stenosis (25%–69% degree of stenosis) was present in 69 vessels (69 of 77, 90%). Functionally significant stenoses at invasive FFR were present in 31 vessels (31 of 69, 45%). Separate analysis of the diagnostic performance in vessels with intermediate stenosis resulted in improvement in detection of functionally significant stenoses for CT FFR (AUC, 0.89 [95% CI: 0.79, 0.95]) compared with the degree of stenosis evaluation at coronary CT angiography (AUC, 0.65 [95% CI: 0.52, 0.76]), with a difference in AUC of 0.24 (P < .01) (Fig 3). A significant improvement (P < .01) of specificity was observed with CT FFR (30 of 38 [78.9%] [95% CI: 62.7, 90.4]) compared with degree of stenosis at coronary CT angiography (16 of 38 [42.1%] [95% CI: 26.3, 59.2]) without decrease in sensitivity (28 of 31 [90.3%] [95% CI: 74.2, 98.0] vs 27 of 31 [87.1%] [95% CI: 70.2, 96.4], respectively). These findings, together with other results on diagnostic performance, were comparable to results of the full sample (Table 2). Pearson correlation (r = 0.56) (Fig 4) and Bland-Altman analysis (mean difference, 0.02 ± 0.09) (Fig 5) of intermediate stenosis were also comparable to the results of the full sample.
Influence of Calcium Agatston Scores
The majority of vessels (43 of 77, 56%) had a calcium Agatston score of greater than or equal to 101. No difference in diagnostic performance was found for CT FFR between the vessels with no to mild calcium Agatston score (0–100) and vessels with a calcium score of greater than or equal to 101 (Table 4), indicating that the algorithm was overall not affected by an increase in calcium score (Fig 6). Although we did not find a clear relation between the overall performance of the described algorithm and the calcium score, outliers with a large difference between CT FFR and invasive FFR values (>0.20 difference) were only found in vessels with calcium scores greater than 101, indicating that the amount of calcium might influence the resulting CT FFR values (Fig 6).
Table 4:
Per-Vessel Diagnostic Performance in High-Density Calcifications
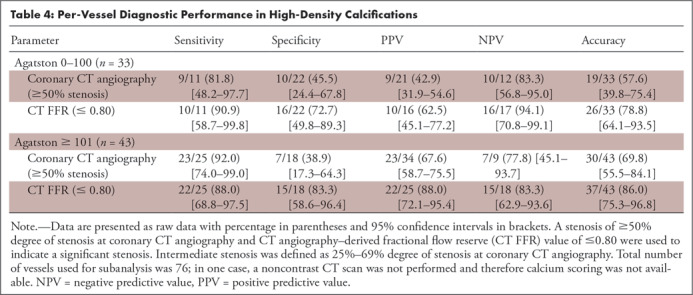
Figure 6:
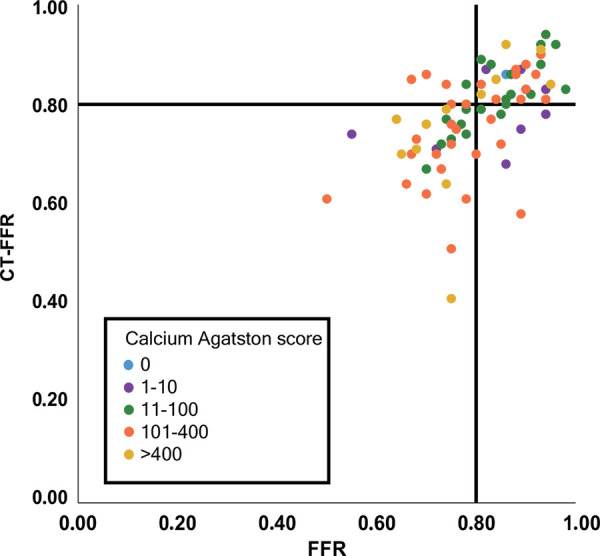
Scatterplot of CT angiography–derived fractional flow reserve (CT FFR) and invasive FFR values, subdivided by coronary calcium Agatston score in the vessel of interest. Color of the dots indicates grading of coronary artery calcium Agatston score. Black lines indicate the cutoff value used for both invasive FFR (0.80) and CT FFR (0.80).
Patient-based Analysis
Per patient, a mean ± standard deviation of 1.35 vessels ± 0.61 was analyzed using CT FFR. When taking the lowest CT FFR value measured per patient, a total of two false-negative findings and eight false-positive findings were present, whereas the highest degree of stenosis at coronary CT angiography per patient showed two false-negative findings and 20 false-positive findings. This resulted in an equal sensitivity for both CT FFR and degree of stenosis at coronary CT angiography (29 of 31, 93.5% [95% CI: 84.4, 1.00]) and an improved specificity for CT FFR (18 of 26, 69.2% [95% CI: 50.2, 88.2]) compared with degree of stenosis at coronary CT angiography (six of 26, 23.1% [95% CI: 0.06, 40.0]).
Discussion
In this feasibility study, we evaluated the diagnostic performance of an on-site CT FFR algorithm based on a patient-specific lumped parameter model. The main finding was that application of CT FFR significantly improved the diagnostic performance of CT compared with visual evaluation of degree of stenosis for the identification of functionally significant coronary artery stenosis.
In patients with stable angina, coronary CT angiography can help identify CAD in individual patients and reduce adverse events and cardiac deaths compared with standard clinical care (24). However, although degree of stenosis evaluation at coronary CT angiography allows for detection and exclusion of CAD, it has a poor performance for interpreting functional significance of a stenosis (1–4). In clinical practice, additional functional testing (eg, myocardial stress perfusion imaging) is often used to establish whether a significant stenosis is present. The drawback of this approach is the requirement for additional imaging, including induction of coronary hyperemia (25). CT FFR, on the other hand, potentially allows for functional evaluation of a stenosis on coronary CT angiographic images that have already been acquired, without the need for physical or pharmacologically induced coronary hyperemia. Therefore, CT FFR could be an alternative first-step evaluation after CAD is detected at coronary CT angiography, that could potentially obviate additional testing in some patients.
Different computational methods have been proposed for CT FFR. Diagnostic performance of both off-site and on-site CT FFR algorithms have shown incremental diagnostic performance for the evaluation of functional significant stenosis (4,8–19). A recent meta-analysis by Celeng et al (4) showed that pooled analysis of all CT FFR algorithms resulted in a sensitivity of 85% and specificity of 78%, which is in close correlation with the sensitivity (89.2%) and specificity (77.5%) found in the current study. Off-site CT FFR based on CFD showed an accuracy, sensitivity, specificity, positive predictive value, negative predictive value, AUC, and bias (Bland-Altman analysis) ranging between 69% and 86%, 80% and 88%, 63% and 86%, 56% and 74%, 84% and 95%, 0.90 and 0.93, and 0.02 and 0.06, respectively (8–11). As off-site CFD calculations are time-consuming due to the need for high-performance computational resources, more recent CT FFR algorithms have been focused on on-site CT FFR evaluation performed on a personal computer. A method introduced by Chung et al (19) used CFD combined with a lumped parameter model to represent outflow boundary conditions and was able to reduce reconstruction time to 37 minutes with similar diagnostic performance. A hybrid method—which applied a full-order algorithm to stenotic areas and a reduced-order algorithm to normal areas combined with a lumped parameter model to represent outflow boundary conditions—reduced computation time to 3–10 minutes, without decrease in diagnostic performance compared with full CFD algorithms (12–14,16). More recently, CT FFR methods based on patient-specific lumped parameter models (current study and 15) and machine learning (17,18) showed an even further reduction in computation time to only a few seconds with similar diagnostic performance compared with other methods. Donnelly and colleagues (15) showed that the CT FFR method based on a patient-specific lumped parameter model, similar to the method used in the current study, showed a strong diagnostic performance with an accuracy, sensitivity, specificity, positive predictive value, negative predictive value, and AUC of 78%, 91%, 72%, 63%, 93%, and 0.89, respectively. Additionally, they found that this CT FFR algorithm showed excellent intra- and interobserver reproducibility (intraclass correlation coefficient of 0.95 and 0.90, respectively), and no significant differences in AUC values between the first and second readings (intraobserver) or between readers (interobserver) were found (15). The current study expands on this study by evaluating this CT FFR algorithm using a separate cohort in another hospital. In the current study, a slightly higher specificity and positive predictive value and slightly lower sensitivity and negative predictive value were found, which can be explained by the lower bias found on Bland-Altman analysis in the current study (mean difference between invasive FFR and CT FFR = 0.03 ± 0.09) compared with the bias observed by Donnelly et al (0.07 ± 0.12) (15). The mean computation time in the current study was 8 seconds. Together with the feasibility of virtual stent placement (26,27), a short CT FFR computation time would allow for interactive virtual treatment and direct interpretation by clinical physicians.
Major drawbacks of CT FFR are its inability to evaluate cases with even slight artifacts as well as the need for time-consuming manual review of centerline and arterial lumen segmentations. In the current study, the median time for centerline and lumen segmentation per patient was 36 minutes, which precludes use of the technique in clinical routine. However, developments in machine learning (28) may facilitate automated segmentation and contouring of the vascular lumen, which will remove this limitation to a large extent. Because CT FFR relies on an accurate segmentation of the coronary lumen, high image quality is a prerequisite and thus cases with artifacts were excluded from CT FFR analysis. The number of nondiagnostic coronary CT angiographic data sets can be reduced by improvement of image acquisition protocols and artifact reduction algorithms. Another limitation of the currently used CT FFR algorithm is the inability to evaluate cases with ostial lesions, as CT FFR relies on lumen segmentation of a nonstenotic part of the ostium to define inflow conditions. Any coronary artery with an ostial lesion in the coronary tree of interest (left main or right coronary artery) was therefore excluded. Future optimization of CT FFR methods might address this limitation. Another approach could be evaluation of the left ventricle myocardium using stress CT perfusion (16) or the already-acquired coronary CT angiographic scans at rest (29,30). It is expected that by combining both stress CT perfusion and CT FFR, superior diagnostic performance may be found compared with both methods separately (16). Future prospective studies are needed to confirm this hypothesis.
Our study had limitations. When interpreting our results, the single-center retrospective study design needs to be taken into account. Patients were selected based on the presence of coronary CT angiography and invasive FFR, which could have induced selection bias; this resulted in a cohort with high prevalence of intermediate degree stenosis at coronary CT angiography (69 of 77; 90%) and invasive FFR values between 0.7 and 0.9 (55 of 77; 71%). In addition, the number of physiologically intermediate lesions (invasive FFR, 0.70–0.80) was 36% (28 of 77), which is higher than that found in most other studies (31). However, the patients we evaluated reflect the cohort in need of further functional evaluation in daily clinical practice and show the incremental value of CT FFR in this most challenging cohort with mainly intermediate stenosis and high calcium scores. Additional limitations are that the on-site CT FFR used in the current study is a research prototype and is not commercially available. Coronary CT angiographic data from a single vendor were used for CT FFR analysis, and therefore our findings may not be applicable to scans performed on equipment of other vendors.
In conclusion, the current feasibility study suggests that the diagnostic performance of on-site CT FFR is superior to stenosis evaluation at coronary CT angiography for identification of functionally significant coronary artery stenosis. Further prospective studies are needed to evaluate the integration of on-site CT FFR in clinical practice.
Disclosures of Conflicts of Interest: R.W.v.H. Activities related to the present article: institution supported by grant from Netherlands Organization for Health Research and Development (ZonMw), with participation of Pie Medical Imaging in the framework of the research program IMDI (Innovative Medical Devices Initiative); project 104003009; institution received research prototype CT-FFR software (FFR-CT, IntelliSpace Portal version 9.0.1.20490, Philips Healthcare) free from Philips Healthcare; The University Medical Center Utrecht Department of Radiology receives research support from Philips Healthcare. Activities not related to the present article: disclosed no relevant relationships. Other relationships: disclosed no relevant relationships. M.V. disclosed no relevant relationships. P.A.d.J. Activities related to the present article: The Division of Imaging, UMC Utrecht receives research support from Philips Healthcare. Activities not related to the present article: disclosed no relevant relationships. Other relationships: disclosed no relevant relationships. M.J.W. Activities related to the present article: institution receives money from the American Heart Association (18POST34030192). Activities not related to the present article: disclosed no relevant relationships. Other relationships: consultant for Artery; stockholder in Segmed. I.I. Activities related to the present article: institution receives grant from the Netherlands Organization for Health Research and Development with participation of Pie Medical Imaging in the framework of the research program IMDI (Innovative Medical Devices Initiative); project 104003009. Activities not related to the present article: institution receives research grant from Dutch Technology Foundation with participation of Pie Medical Imaging and Philips Healthcare (program P15-26); research grant with participation of Pie Medical Imaging and 3mensio Medical Imaging (project 12726); and research grant Dutch Cancer Society (KWF); two research grants Pie Medical Imaging; institution has patents (Pie Medical Imaging) US Patent App.15/933,854; one patent pending; as an inventor, author should also receive payments but has received none so far; scientific cofounder and shareholder of Quantib-U. Patents: patent pending for Pie Medical Imaging; patent issued, Pie Medical Imaging, US patent approved 15/933,854 (as inventor, author should also receive payments; none thus far) Other relationships: disclosed no relevant relationships. T.L. Activities related to the present article: institution received grant from Netherlands Organization for Health Research and Development (ZonMw), with participation of Pie Medical Imaging in the framework of the research program IMDI (Innovative Medical Devices Initiative); project 104003009; Activities not related to the present article: institution receives payment for lectures from Philips Healthcare and Bayer Healthcare. Other relationships: Dr Leiner is co-inventor of U.S. patent 10,176,575; this patent is held by Utrecht University Holdings, which manages the terms of any licensing agreement.
The University Medical Center Utrecht Department of Radiology receives research support from Philips Healthcare. This work was financially supported by the project FSCAD, funded by the Netherlands Organization for Health Research and Development (ZonMw) with participation of Pie Medical Imaging in the framework of the research program Innovative Medical Devices Initiative (IMDI) (project 104003009).
Abbreviations:
- AUC
- area under the receiver operating characteristic curve
- CAD
- coronary artery disease
- CFD
- computational fluid dynamics
- CI
- confidence interval
- CT FFR
- coronary CT angiography–derived FFR
- ECG
- electrocardiography
- FFR
- fractional flow reserve
References
- 1.Budoff MJ, Dowe D, Jollis JG, et al. Diagnostic performance of 64-multidetector row coronary computed tomographic angiography for evaluation of coronary artery stenosis in individuals without known coronary artery disease: results from the prospective multicenter ACCURACY (Assessment by Coronary Computed Tomographic Angiography of Individuals Undergoing Invasive Coronary Angiography) trial. J Am Coll Cardiol 2008;52(21):1724–1732. [DOI] [PubMed] [Google Scholar]
- 2.Rossi A, Papadopoulou SL, Pugliese F, et al. Quantitative computed tomographic coronary angiography: does it predict functionally significant coronary stenoses? Circ Cardiovasc Imaging 2014;7(1):43–51. [DOI] [PubMed] [Google Scholar]
- 3.Budoff MJ, Nakazato R, Mancini GBJ, et al. CT angiography for the prediction of hemodynamic significance in intermediate and severe lesions: head-to-head comparison with quantitative coronary angiography using fractional flow reserve as the reference standard. JACC Cardiovasc Imaging 2016;9(5):559–564. [DOI] [PubMed] [Google Scholar]
- 4.Celeng C, Leiner T, Maurovich-Horvat P, et al. Anatomical and functional computed tomography for diagnosing hemodynamically significant coronary artery disease: a meta-analysis. JACC Cardiovasc Imaging 2018 Sep 6 [Epub ahead of print]. [Google Scholar]
- 5.Task Force Members , Montalescot G, Sechtem U, et al. 2013 ESC guidelines on the management of stable coronary artery disease: the task force on the management of stable coronary artery disease of the European Society of Cardiology. Eur Heart J 2013;34(38):2949–3003. [DOI] [PubMed] [Google Scholar]
- 6.van Nunen LX, Zimmermann FM, Tonino PAL, et al. Fractional flow reserve versus angiography for guidance of PCI in patients with multivessel coronary artery disease (FAME): 5-year follow-up of a randomised controlled trial. Lancet 2015;386(10006):1853–1860. [DOI] [PubMed] [Google Scholar]
- 7.Agasthi P, Kanmanthareddy A, Khalil C, et al. Comparison of computed tomography derived fractional flow reserve to invasive fractional flow reserve in diagnosis of functional coronary stenosis: a meta-analysis. Sci Rep 2018;8(1):11535. [DOI] [PMC free article] [PubMed] [Google Scholar]
- 8.Koo BK, Erglis A, Doh JH, et al. Diagnosis of ischemia-causing coronary stenoses by noninvasive fractional flow reserve computed from coronary computed tomographic angiograms. Results from the prospective multicenter DISCOVER-FLOW (Diagnosis of Ischemia-Causing Stenoses Obtained Via Noninvasive Fractional Flow Reserve) study. J Am Coll Cardiol 2011;58(19):1989–1997. [DOI] [PubMed] [Google Scholar]
- 9.Gaur S, Taylor CA, Jensen JM, et al. FFR derived from coronary ct angiography in nonculprit lesions of patients with recent STEMI. JACC Cardiovasc Imaging 2017;10(4):424–433. [DOI] [PubMed] [Google Scholar]
- 10.Nørgaard BL, Leipsic J, Gaur S, et al. Diagnostic performance of noninvasive fractional flow reserve derived from coronary computed tomography angiography in suspected coronary artery disease: the NXT trial (Analysis of Coronary Blood Flow Using CT Angiography: Next Steps). J Am Coll Cardiol 2014;63(12):1145–1155. [DOI] [PubMed] [Google Scholar]
- 11.Min JK, Leipsic J, Pencina MJ, et al. Diagnostic accuracy of fractional flow reserve from anatomic CT angiography. JAMA 2012;308(12):1237–1245. [DOI] [PMC free article] [PubMed] [Google Scholar]
- 12.Coenen A, Lubbers MM, Kurata A, et al. Fractional flow reserve computed from noninvasive CT angiography data: diagnostic performance of an on-site clinician-operated computational fluid dynamics algorithm. Radiology 2015;274(3):674–683. [DOI] [PubMed] [Google Scholar]
- 13.De Geer J, Sandstedt M, Björkholm A, et al. Software-based on-site estimation of fractional flow reserve using standard coronary CT angiography data. Acta Radiol 2016;57(10):1186–1192. [DOI] [PubMed] [Google Scholar]
- 14.Kruk M, Wardziak Ł, Demkow M, et al. Workstation-Based Calculation of CTA-Based FFR for Intermediate Stenosis. JACC Cardiovasc Imaging 2016;9(6):690–699. [DOI] [PubMed] [Google Scholar]
- 15.Donnelly PM, Kolossváry M, Karády J, et al. Experience With an on-site coronary computed tomography-derived fractional flow reserve algorithm for the assessment of intermediate coronary stenoses. Am J Cardiol 2018;121(1):9–13. [DOI] [PubMed] [Google Scholar]
- 16.Yang DH, Kim YH, Roh JH, et al. Diagnostic performance of on-site CT-derived fractional flow reserve versus CT perfusion. Eur Heart J Cardiovasc Imaging 2017;18(4):432–440. [DOI] [PubMed] [Google Scholar]
- 17.Coenen A, Kim YH, Kruk M, et al. Diagnostic accuracy of a machine-learning approach to coronary computed tomographic angiography-based fractional flow reserve: result from the MACHINE Consortium. Circ Cardiovasc Imaging 2018;11(6):e007217. [DOI] [PubMed] [Google Scholar]
- 18.Tesche C, De Cecco CN, Baumann S, et al. Coronary ct angiography-derived fractional flow reserve: machine learning algorithm versus computational fluid dynamics modeling. Radiology 2018;288(1):64–72. [DOI] [PubMed] [Google Scholar]
- 19.Chung JH, Lee KE, Nam CW, et al. Diagnostic performance of a novel method for fractional flow reserve computed from noninvasive computed tomography angiography (NOVEL-FLOW Study). Am J Cardiol 2017;120(3):362–368. [DOI] [PubMed] [Google Scholar]
- 20.Abbara S, Blanke P, Maroules CD, et al. SCCT guidelines for the performance and acquisition of coronary computed tomographic angiography: a report of the Society of Cardiovascular Computed Tomography Guidelines Committee—endorsed by the North American Society for Cardiovascular Imaging (NASCI). J Cardiovasc Comput Tomogr 2016;10(6):435–449. [DOI] [PubMed] [Google Scholar]
- 21.Cury RC, Abbara S, Achenbach S, et al. CAD-RADS(TM) Coronary Artery Disease - Reporting and Data System. An expert consensus document of the Society of Cardiovascular Computed Tomography (SCCT), the American College of Radiology (ACR) and the North American Society for Cardiovascular Imaging (NASCI). Endorsed by the American College of Cardiology. J Cardiovasc Comput Tomogr 2016;10(4):269–281. [DOI] [PubMed] [Google Scholar]
- 22.Nickisch H, Lamash Y, Prevrhal S, et al. Learning patient-specific lumped models for interactive coronary blood flow simulations. In: Navab N, Hornegger J, Wells W, Frangi A, eds. Medical Image Computing and Computer-Assisted Intervention -- MICCAI 2015. MICCAI 2015. Lecture Notes in Computer Science, vol 9350. Cham, Switzerland: Springer, 2015; 433–441. [Google Scholar]
- 23.DeLong ER, DeLong DM, Clarke-Pearson DL. Comparing the areas under two or more correlated receiver operating characteristic curves: a nonparametric approach. Biometrics 1988;44(3):837–845. [PubMed] [Google Scholar]
- 24.SCOT-HEART Investigators , Newby DE, Adamson PD, et al. Coronary CT angiography and 5-year risk of myocardial infarction. N Engl J Med 2018;379(10):924–933. [DOI] [PubMed] [Google Scholar]
- 25.Takx RAP, Blomberg BA, El Aidi H, et al. Diagnostic accuracy of stress myocardial perfusion imaging compared to invasive coronary angiography with fractional flow reserve meta-analysis. Circ Cardiovasc Imaging 2015;8(1):e002666. [DOI] [PubMed] [Google Scholar]
- 26.Kim KH, Doh JH, Koo BK, et al. A novel noninvasive technology for treatment planning using virtual coronary stenting and computed tomography-derived computed fractional flow reserve. JACC Cardiovasc Interv 2014;7(1):72–78. [DOI] [PubMed] [Google Scholar]
- 27.Ihdayhid AR, White A, Ko B. Assessment of serial coronary stenoses with noninvasive computed tomography-derived fractional flow reserve and treatment planning using a novel virtual stenting application. JACC Cardiovasc Interv 2017;10(24):e223–e225. [DOI] [PubMed] [Google Scholar]
- 28.Wolterink JM, van Hamersvelt RW, Viergever MA, Leiner T, Išgum I. Coronary artery centerline extraction in cardiac CT angiography using a CNN-based orientation classifier. Med Image Anal 2019;51:46–60. [DOI] [PubMed] [Google Scholar]
- 29.Zreik M, Lessmann N, van Hamersvelt RW, et al. Deep learning analysis of the myocardium in coronary CT angiography for identification of patients with functionally significant coronary artery stenosis. Med Image Anal 2018;44:72–85. [DOI] [PubMed] [Google Scholar]
- 30.van Hamersvelt RW, Zreik M, Voskuil M, Viergever MA, Išgum I, Leiner T. Deep learning analysis of left ventricular myocardium in CT angiographic intermediate-degree coronary stenosis improves the diagnostic accuracy for identification of functionally significant stenosis. Eur Radiol 2019;29(5):2350–2359. [DOI] [PMC free article] [PubMed] [Google Scholar]
- 31.Cook CM, Petraco R, Shun-Shin MJ, et al. Diagnostic accuracy of computed tomography-derived fractional flow reserve: a systematic review. JAMA Cardiol 2017;2(7):803–810. [DOI] [PubMed] [Google Scholar]


