

Abstract
BACKGROUND AND PURPOSE: Diffusion tensor and diffusion-weighted spinal cord imaging remain relatively unexplored techniques despite demonstrations that such images can be obtained and may yield clinically relevant findings. In this study, we examined the temporal dynamics of spinal cord motion and their impact on diffusion tensor image quality.
METHODS: Four healthy volunteers underwent phase contrast-based velocity mapping and segmented echo-planar diffusion tensor scans of the cervical spinal cord. Regions of interest in the cord were used to identify the temporal patterns of motion. The delay of data acquisition after the cardiac trigger was varied to correspond to either quiescence or motion of the cord.
RESULTS: The cervical spinal cord consistently displayed maximal velocities in the range of 0.5 cm/s and accelerations of up to 25 cm/s2. In both these respects, the cervical cord values were greater than those of the medulla. Despite this pronounced motion, approximately 40% of the cardiac cycle can be described as relatively calm, with absolute velocities and accelerations less than 20% of the maximum values. Confining image acquisition to this window reduced ghosting artifacts and increased the consistency with which the dominant direction of diffusion was along the rostral-caudal axis in both gray and white matter of the spine. Preliminary clinical application and fiber tracking in pathologic cases was feasible, and alterations of the diffusion properties by multiple sclerosis lesions, tumor, and syringomyelia were seen.
CONCLUSIONS: Acquiring DTI data during the quiescent phase of spinal cord motion can reduce ghosting artifacts and improve fiber tracking.
Diffusion tensor imaging (DTI), and diffusion-weighted imaging (DWI) noninvasively provide information about structural integrity at a cellular level that is of significant clinical and research interest.1–8 Although demonstrated in application to the spinal cord by several groups, the clinical roles of both DTI and DWI remain poorly established.9–16 To date, demonstrations of fiber tracking in the spinal cord have been especially limited.17 It is our interest to expand the use of DWI and DTI in the spinal cord, where alterations in tract morphology may be relevant to injury diagnosis and in light of the arrival of new therapeutic measures in animal models, to future monitoring of recovery.
Three factors have contributed to the slow advancement of diffusion imaging in the investigation of patients with spinal cord pathology.18–20 First, magnetic field inhomogeneities as a result of nearby bone, lung, and body contour at the neck are exacerbated by the use of long echo times to allow diffusion encoding. Second, spinal imaging coils, because of their primarily planar geometry, are markedly less sensitive at the depth of interest (ie, the spinal cord) than the volume coils that are used for the brain. Third, the spinal cord and surrounding CSF undergo significant pulsations, whereas surrounding tissues are also prone to respiratory and swallowing motions, all of which can corrupt the motion-sensitive diffusion encoding and imaging processes. Because of these factors, single-shot echo-planar images (EPI) of the spine on clinical and high-field imaging systems are generally severely distorted. Multishot, echo-planar, and fast spin-echo sequences have yielded better results for diffusion imaging of the human spinal cord.21–24 On the other hand, strategies to restrict the imaging volume with25 or without the use of phase encoding13,26–29 have been used but are not yet routinely available for clinical use. All these techniques reduce the number of echoes acquired and thus the duration of the sampling window, leading to a reduction in susceptibility artifacts. Spin-echo based approaches have the advantage of better inherent refocusing of T2*-related signal intensity losses.17 Perhaps as a result of shorter acquisition train duration, EPI has been found to outperform fast spin-echo when a multishot strategy is used for DWI of the spinal cord.22
A problematic aspect of multishot acquisitions is the need to ensure that different acquisition “shots” for a given image undergo similar degrees of corruption by motion and that images sensitive to different directions of motion are not differentially affected. The dynamics of the spinal cord consist typically of caudal displacement starting soon after arterial systole in the cranium, and a return of the cord to its original position during diastole.30,31 This dependence on the cardiac cycle has been exploited through the use of cardiac gating.32 Further improvements can be achieved by the incorporation of a flow-compensated gradient pattern33 and correcting residual phase shift differences between shots by navigator echoes.12,34,35
Cardiac triggering is recognized to reduce signal intensity drop-out in single-shot diffusion-weighted acquisitions,36 and the addition of navigator correction is an essential step in segmented EPI data acquisition.32,37 Bammer et al38 and Holder et al10 combined cardiac-gated and navigator correction to multishot DTI of the spinal cord. However, they did not restrict the acquisition window to ensure that all data were acquired during comparable conditions of spinal cord motion. Thus, although cardiac cycle modulation of motion was avoided, they did not account for the possibility that different periods of the cardiac cycle may be more prone to motion than others and hence less desirable for data acquisition. Within the brain, the timing of data acquisition relative to the cardiac cycle has recently been shown to influence the quality of DTI studies.39 Herein, we consider the temporal dynamics of the CSF and spinal cord motion as a factor in optimizing cardiac-triggered, navigator-corrected, multishot, spin-echo echo-planar DTI of the human spinal cord. In particular, we aimed to identify an optimal period for data acquisition in the upper cervical region of the spinal cord by examining cardiac-related movement of the spinal cord and seeking to establish whether different trigger window timings affected DTI image quality or the results of fiber tracking.
Methods
Subjects
Spinal cord dynamics were examined in 4 healthy adult volunteers free of neurologic symptoms (3 men, 1 woman; mean age, 38 years [SD = 6.4 years]). Details of the motion and diffusion-sensitive imaging sequences and postprocessing are given below. A conventional T2-weighted, sagittal fast spin-echo acquisition (echo time [TE]/repetition time [TR]/echo-train length, 80 ms/3000 ms/13) was performed to rule out any pathologic conditions. DTI was then performed using the optimized acquisition strategy targeted to the quiescent period and again with the trigger delay set to begin acquisition during the motion of late spinal systole/early diastole.
In addition, the timing of the optimized triggering strategy obtained from the healthy subjects was applied in 5 patients with cervical spinal cord pathology undergoing spinal MR imaging investigation. In this subgroup, measurement of the spinal cord dynamics was performed in consideration of the time required for the routine clinical imaging. The patient referrals included 2 with multiple sclerosis, 1 with cervical syringomyelia, 1 with cervical intramedullary glioma, and 1 with dolichoectatic vertebrobasilar system compressing the medulla oblongata and the cervicomedullary junction. Each subject provided informed consent in keeping with the practices of the local institution.
All imaging was performed on a 3T MR scanner with high-performance gradient system (Gmax: 80 mT/m, Gslew: 200 T/m/s). A phased-array spine coil was used for reception, using the 4 cervical coil elements. Parallel image acquisition and reconstruction (eg, SENSitivity Encoding40) were not supported with this coil array at the time of the study.
Spinal Cord Movement
Acquisition.
A midline sagittal velocity mapping study of the superior-inferior component of velocity was performed using a retrospectively triggered phase-contrast sequence. The velocity encoding range was set to 8 cm/s, and 36 time points were reconstructed per cardiac cycle. The imaging parameters were: TE/TR/flip angle/number of excitations (NEX), 5.8–6.1 ms/20 ms/60°/3, field of view [FoV]/acquired resolution [AcqRes]/reconstructed resolution [ReconRes]/section thickness −200 mm/100 × 256/332 × 512/5 mm.
Image Analysis.
Using the scanner’s built-in analysis software, rectangular regions of interest (ROIs) containing at least 40 voxels were drawn in the spinal cord at the levels of the medulla and of the C2 and C6 vertebral bodies on the first frame of the velocity mapping study of each subject. The regions were copied to the following frames, and spatial mean velocity within each ROI was determined for each frame. The time course of the velocity was assessed to identify the onset and end of the longest plateau of velocity. As the criteria for identifying this range, we adopted a velocity change of 20% (typically ± 0.06 cm/s) of the maximal values. That any concomitant gradient and eddy current-induced errors would not alter the identified plateau was confirmed by the drawing of a background ROI, but no background correction was made. The time-course data were exported as a text file for preparation of figures.
Diffusion Tensor Imaging
Acquisition.
The diffusion tensor acquisition closely followed the protocols of Bammer et al38 and Holder et al.10 The sequence was cardiac-gated using the finger pulse-oximeter signal intensity. Spatial presaturation bands were applied outside all 4 edges of the FOV to reduce contamination from structures outside the spinal column. The sequence included a navigator echo for correction of patient motion over the course of the scan. The imaging parameters were: TE/TR/flip angle/NEX, 66–72 ms/2 or 3 RR intervals/90°/3; FOV/AcqRes/ReconRes/section thickness, 11 cm/82 × 96/128 × 128/6 mm. Diffusion encoding was performed in 6 directions with a maximal b-factor of 650 seconds/mm2. Previous studies with b-values of ≤750 seconds/mm2 have shown the strong anisotropy difference between spinal gray and white matter to be well resolved41 and have the advantage of allowing a shorter echo time than with the higher b-values typically used in DTI of the brain. This gradient scheme, standard on our system, always used at least 2 gradient coils simultaneously. This rotates the diffusion-encoding axes away from the imaging axes, making interpretation of the source images more difficult but reducing the echo time as much as possible. In addition, for each section, a baseline image with minimal diffusion weighting (b <20 seconds/mm2) was acquired.
Timing and duration of the DTI studies were dictated by the phase-contrast results. In each subject, the above multisection, axial diffusion tensor study was performed once with the gating window set to acquire the sections during quiescence, and once with acquisition including the motion of late spinal systole/early diastole. These corresponded to trigger delays of 290 to 320 ms for quiescence, and the system’s shortest trigger delay (90 ms) respectively. In both cases, the data acquisition window was limited to 350 ms (consistent with the minimum quiescent interval observed); allowing 2 sections was acquired in each cardiac cycle. The order of the scans alternated between subjects. To minimize cross-talk between sections, images were acquired in an interleaved order, with 2 passes through the sections, allowing the scanner software to acquire the odd-numbered sections first and then the even-numbered sections. Because 8 or 12 sections were planned, the TR was correspondingly set to either 2 or 3 RR intervals. Total imaging time was typically 9–12 minutes depending on the heart rate.
The DTI data were first reconstructed as the individual diffusion-weighted images, the reference T2-weighted (“b = 0”) EPI. After the reconstruction process described below, fractional anisotropy (FA) maps and mean diffusion-weighted images were generated. In the volunteers, for whom DTI acquisition was performed with cardiac triggering set in one instance to the scanner default (approximately 60 ms) and in one to the quiescent period of the cardiac cycle, 2 sets of the above DTI data were obtained. Pulsation artifacts were less obvious with gating to the quiescent window in all subjects. Because the ghosts tended to overlap other anatomic structures, however, we could not define an unambiguous quantitative metric of the change in the level of ghosting. An illustrative example of the difference in gating strategies is therefore provided. With the patients, only the optimized gating approach was performed. In assessing these, we focus therefore on the correspondence of the cross-sectional DTI with the conventional MR images.
Fiber Tracking.
Before performing fiber tracking, the data were transferred to an off-line workstation. Dewarping of eddy current-induced image deformations was performed with a correlation-based 2D-affine registration algorithm.42 The independent elements of the diffusion tensor were obtained on a pixel-by-pixel basis by singular value decomposition, using the diffusion-weighted images and the control images with b <20. After diagonalization, the eigenvalues and eigenvectors were determined, and FA maps and color-coded orientation field maps43 were created.
Tracking and subsequent visualization were performed using custom-made software. A line propagation algorithm based on FACT (Fiber Assignment by Continuous Tracking7) was the basis for reconstructing fiber pathways. Stopping criteria based on FA values were set to be either intermediate between gray and white matter (to selectively track in white matter), or at the lower range of values measured for gray matter (to allow tracking through both white and gray matter). Two 2D ROIs were manually defined, one encompassing the spinal cord on the most superior section and the other on the most inferior section. For each ROI, a user-specified number of seed points per voxel was generated; from each of these seed points was the line propagation algorithm launched. For all studies, 20 seed points per voxel were specified, and these were randomly distributed over the voxels of the ROIs. The resulting fibers were generated and saved separately. The 2 ROIs were then used in conjunction for a 2 ROI analysis of fibers propagating from end to end within the imaged volume. This last approach produced a subset of the fibers identified in the single ROI seeding but with reduced visibility of emerging nerve roots. The results reported therefore focus on the single and combined single ROI results.
Results
Spinal Cord Movement
Velocity-sensitive imaging of the spinal cord showed very good consistency between subjects for the overall pattern of spinal cord motion. The velocity time-course curves for each cervical level are shown in Fig 1 along with the derived acceleration time-course curves. Although there was no prolonged period of spinal cord stasis, between 36% and 56% of the cardiac cycle could be described as quiescent, showing velocities less than 0.06 cm/s. Over these time windows, the accelerations were also lowest, typically less than 5 cm/s2. Normalizing the time courses showed the onset and duration of the quiescent period as a fraction of the cardiac cycle to be strongly stereotypical across subjects (Fig. 1G, -H).
Fig 1.
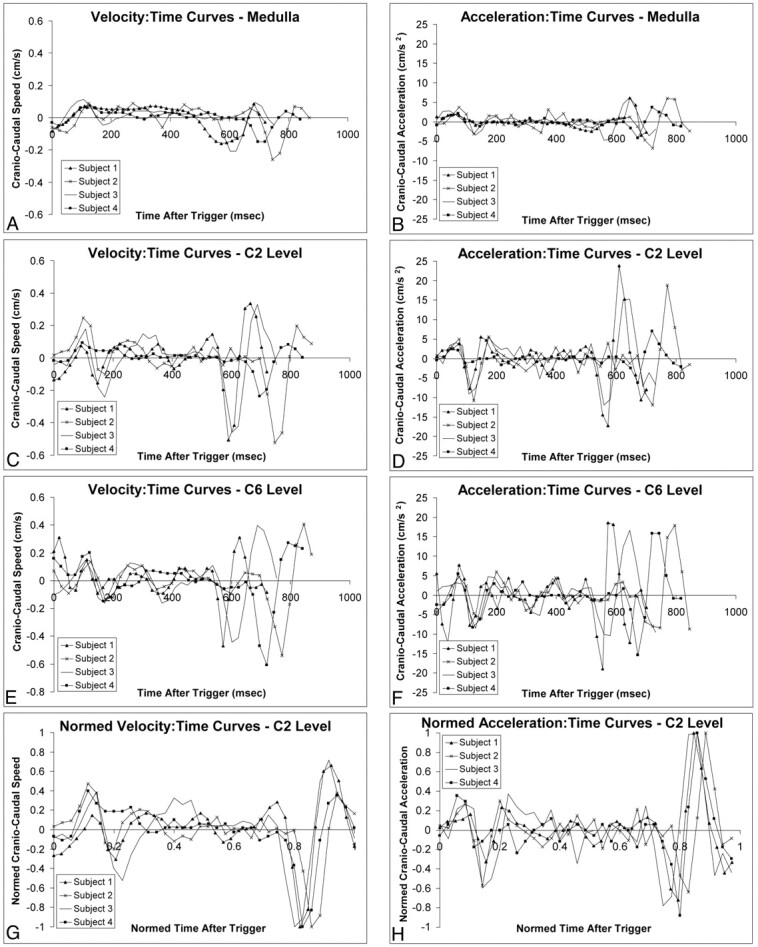
Cranio-caudal movement of the medulla (A and B), C2 (C and D), and C6 (E and F) segments of the spinal cord in 4 healthy subjects. Velocity- and acceleration-time curves for all levels show a period of relative quiescence between 200 and 550 msec after peripheral trigger. Normalized velocity-time curves (G) and acceleration-time curves (H) at the C2 level (reflecting those of the other levels; data not shown) indicate that quiescence consistently lasted 40% of the cardiac cycle, with good consistency between subjects.
The timing and velocity characteristics of the 3 cervical spinal levels examined are summarized in the Table. Progressing from superior to inferior, the onset of quiescence is seen to be progressively delayed, whereas its duration became progressively shorter. At the same time, the maximum velocities achieved over the cardiac cycle progressively increased from less than 2 mm/s to more than 5 mm/s. The subject heart rates were in a narrow range (67–81 beats/min).
Group-averaged characteristics of quiescence
| Spinal Level | Onset of Quiescence (ms) | Duration of Quiescence (ms) | Normalized Time of Onset (% RR) | Normalized Duration of Quiescence (% RR) | Absolute Quiescent Velocity (mm/s) | Maximum Absolute Velocity (m/s) |
|---|---|---|---|---|---|---|
| Medulla | 158 ± 10 | 448 ± 96 | 20 ± 2 | 56 ± 7 | 0.3 ± 0.2 | 1.9 ± 0.5 |
| C2 | 266 ± 110 | 360 ± 113 | 33 ± 15 | 45 ± 20 | 0.3 ± 0.2 | 4.3 ± 1.3 |
| C6 | 314 ± 105 | 286 ± 96 | 39 ± 13 | 36 ± 12 | 0.4 ± 0.1 | 5.2 ± 0.7 |
Note:—Cord velocity is <0.06 cm/s (in cervical spinal cord motion). RR indicates a period in the cardiac cycle.
Timing of DTI Data Collection
DTI data acquired during a mix of highly motional and quiescent periods of the cardiac cycle and strictly during the quiescent period are exemplified by the results shown in Figs 2 and 3, respectively. Three features are apparent from the acquired images. First, gating greatly reduces CSF-related ghosting in the T2-weighted, low b-value image used as a reference. Second, although ghosting of the spinal cord is not a prominent feature, the average intensity and the consistency of the cord appearance across sections and b-values is much higher in the images acquired entirely during the quiescent period. Finally, there is a notable ghosting of residual extraspinal tissues, particularly subcutaneous fat. To reduce the impact of ghosting from fat, subsequent DTI acquisitions were performed with fat suppression.
Fig 2.

DTI data covering 1 vertebral body (4 sections) acquired without restriction to the quiescence of spinal cord motion. Ghosting of CSF is apparent in the T2-weighted images (left column), whereas ghosting of subcutaneous fat and inconsistent spinal cord signal intensity are seen in the 6 diffusion-weighted acquisitions. In the average diffusion-weighted image (right column) the spinal cord is not well demonstrated.
Fig 3.

DTI data covering one vertebral body (4 sections) acquired entirely during the spinal cord quiescence for the same subject as Fig 2. Ghosting of CSF in the T2-weighted images is greatly reduced (left column), and the diffusion-weighted spinal cord signal intensity is more consistent. Some ghosting of subcutaneous fat is still apparent. Compared with Fig 2, the spinal cord is clearly seen in the average diffusion-weighted image (right column) for all sections.
Diffusion Tensor Imaging
Examples of DTI and tracking in the spinal cord are given in Figs 4–8, illustrating some preliminary observations based on the small number of subjects studied to date. Acquisition during quiescence results in greater consistency of the dominant direction of diffusion tensor laying in the rostral-cranial throughout the spinal cord. This is seen in the color-coded FA maps and first eigenvector displays from a healthy control subject (Fig 4). In all control subjects and patients, the spinal cord was clearly distinguished from adjacent fluid in the DTI data and maps. The expected butterfly configuration of the central gray matter however, was visible on most sections for each volunteer only with acquisition timed to the quiescent period.
Fig 4.
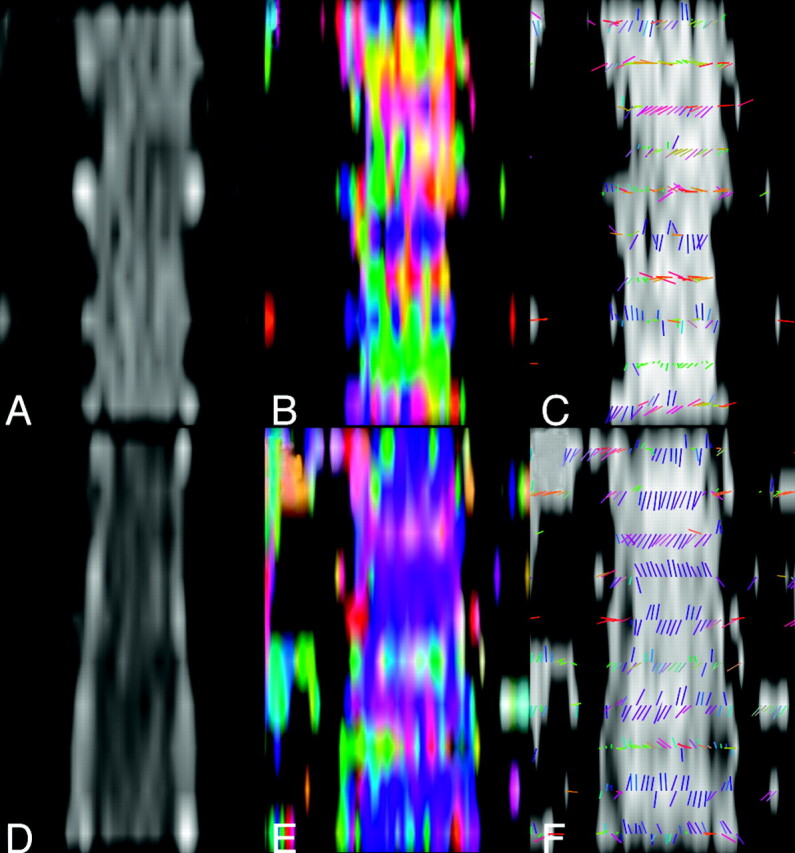
Comparison of diffusion tensor properties obtained without (top row) and with (bottom row) optimized cardiac triggering, illustrated in midspinal coronal reformat of axial section data. The CSF space and CSF-spinal cord interface are better defined in the low b-value data (D versus A) allowing the low FA in the CSF space to be better appreciated (F versus C). FA maps (B and E) color-coded to reflect the orientation of the first eigenvector (blue, caudal-cranial; green, anteroposterior; red, right-left) show greater consistency between sections when the proposed trigger window is used. This is also seen when examining the orientation of the eigenvectors directly overlaid on a gray-scale FA map (F versus C).
Fig 8.

An intramedullary glioma extending from C2 to C4 displaying hyperintense signal intensity on T2-weighted images (A). The overlaid lines denote the levels corresponding to the axial sections in B–E. The lesion displays heterogeneous signal intensities on conventional T1 (B), EPI T2 (C), and diffusion–weighted (D) images as well as the FA map (E). Below the tumor (bottom row), a clear butterfly configuration attributed to the central gray matter of the cord is visible on T2 and diffusion-weighted images and FA map but not at the T1-weighted image. In fiber tracking, seeding of the entire superior and inferior cross-sections results in a veil of fibers around a region of low fractional anisotropy in the tumor into which tracks do not propagate, as seen when viewed in section (F, arrow). From external viewpoints, the thinning of the fiber volume is visible only when seeding is restricted to the white matter (G).
Fiber Tracking.
Fiber tracking results representative of a healthy adult obtained using the optimized trigger timing detailed above are shown in Fig 5. When the ROI contains the entire cross-section of the spinal cord in the most superior (or inferior) section, it is notable that relatively few fibers extend from end to end of the comparatively short imaging volume (typically 2-3 vertebral bodies in the current implementation). At least part of this attrition appears to be due to fiber convergence and crossing at the emergence of nerve roots (Fig 5B). In light of the residual errors in the eigenvectors seen in Fig 4, however, one cannot rule out the presence of artifactual attrition as well. By limiting the initial ROI to the lateral white matter in the most superior section, a subset of the tracks can be more clearly seen. These tracks remain lateralized, and with a suitable stopping threshold, the depicted fibers do not appear to enter the central gray matter of the spinal cord. Blue in Fig 5B, -C, depicts the cranial-caudal orientation of the local first eigenvector, so the dominant direction of diffusion is readily apparent. Intermittent zones of green and red correspond to the origins and progressions of nerve roots.
Fig 5.

Fiber-tracking results from a healthy control (A) with the entire cross-section of the spinal cord in both the superior (blue fibers) and inferior section (red fibers) used as seeding regions. Few tracks extend from end to end of the scan volume (covering slightly more than 2 vertebral bodies). Color coding the same fibers in accordance with local orientation of the first eigenvector (blue, rostral-caudal; red, left-right; green, anteroposterior), many of the fibers appear to converge on an emerging nerve root, suggesting that fiber crossing may be present. Restricting seeding to the lateral white matter in the in the most superior section (C) shows no penetration of these tracks into the central regions of the cord.
In Fig 6, DTI and tracking results from a patient with hydromyelia are shown. We note that the diffusion-weighted images show signal intensity reduction in the dilated central canal that are not as pronounced as for the CSF, suggesting a lower diffusion coefficient in this region. The timing of the acquisition window (320 ms after peripheral pulse) was based on the results in controls. In this patient, ghosting of the spinal cord was evident on some sections, possibly as a result of altered spinal cord dynamics associated with its pathologic condition. No such ghosts were seen in the volunteers. Over the cross-section of the cord tissue, the direction of the first eigenvector was rostral-caudal, suggesting that the data were adequate for fiber tracking. Making use of a surface-shaded display of the central canal and high-intensity CSF based on the T2-weighted EPI images (low diffusion encoding), it is apparent that few fiber tracks extend into either of these regions (Fig 6D, -E). We attribute these incursions to differences in the effective boundaries generated in the processes of surface rendering and evaluating the stopping criteria of low FA.
Fig 6.
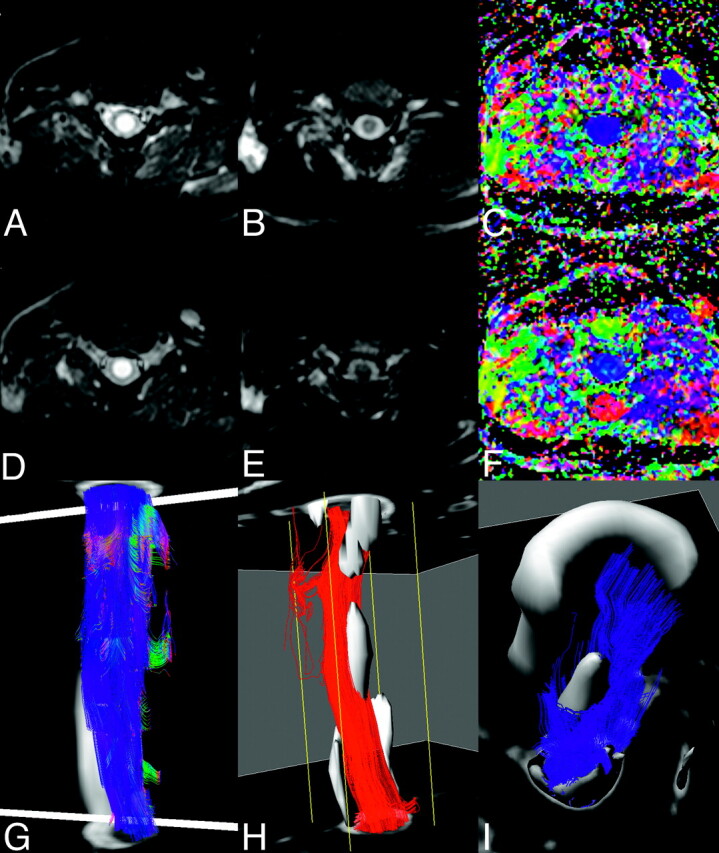
A patient with cervical syringomyelia. Axial T2-weighted images (A and D), mean diffusion-weighted images (B and E) and color-coded fractional anisotropy maps (C and F), at C2 (top row, A–C) and C3 (second row D--F) levels through the syrinx. Some residual ghosting of the spinal cord is apparent, but the orientation of the first eigenvector appears preserved. Lateral view of fiber tracking after seeding of the inferior and superior sections (G) shows little evidence of the pathology. Setting a conservative threshold on the T2-weighted images to isolate the core of the syrinx (gray), the tracks originating in the inferior section (H) and superior section (I) are seen not to penetrate this region of the pathology.
In the patients with MS, the DTI data were suggestive of localized differences in diffusion properties as illustrated in Fig 7. The location and extent of the lesions, however, was not readily visible from fiber tracking. Conversely, in a patient with an intramedullary glioma (Fig 8), the diffusion tracking results are clearly disrupted in proximity with the lesion. As with the syrinx, altered spinal cord dynamics may also play a role here, in that the image quality was exceptionally good, clearly depicting the expected pattern of gray and white matter in the mean diffusion-weighted, apparent diffusion coefficient, and FA maps at levels below the tumor. Immobilization of the thickened cord within the spinal canal was probably the important factor in achieving the good quality images in this patient. The presence of edema cranially and caudally to the tumor may also have accentuated the FA differences between gray and white matter.
Fig 7.

T2 (left column), and diffusion-weighted images (middle column) together with FA maps (right column) of a cervical spine lesion in a patient with multiple sclerosis. Top row, above lesion; middle row, top-most section showing T2 hyperintensity; bottom row, through widest extent of the lesion. Hyperintensity in the diffusion-weighted images follows that of the T2-weighted images, whereas in the center of the lesion is a unilateral reduction in FA.
Discussion
We have demonstrated a strategy for optimizing cardiac synchronization of the acquisition of multishot echo-planar, DTI of the spinal cord. The strategy takes advantage of a period of relative quiescence in the motion of the spinal cord to reduce artifactual signal intensity losses in the diffusion-weighted images and to reduce pulsation ghosting in the low b-value images acquired. This leads to visible improvement in orientation of the resulting diffusion eigenvectors, and the depiction of cross-sectional spinal cord diffusion properties. In addition, we present some initial results of fiber tracking in the spinal cord.
The motion of the cervical spinal cord we have observed is in very good agreement with the previous MR studies.44–46 Of particular interest here is the intraindividual consistency, across our small group of volunteers, of a period of relative quiescence lasting slightly less than half of the cardiac cycle and beginning roughly 320 ms after the trigger signal intensity. The use of peripheral triggering may be responsible for some of the variability between subjects in the onset of the quiescent window (Fig 1) in that the waveform does not have a sharp triggering feature, will have different delays relative to spinal systole depending on subject size, and is prone to variations due, for example, to cooling of the subject’s arms. Although ECG triggering may reduce this variability, an element of intersubject variation will arise from subject age, height, details of their skull-base anatomy, and pathologic conditions47 and will differ according to the spinal level being examined.30,31 For our purposes, a key advantage of peripheral triggering was that the quiescent window was consistently framed between the peripheral triggers, so that the split in the data acquisition required for prospective triggering coincided with spinal motion (ie, time during which we did not wish to acquire data). With ECG gating, part of the quiescent window would have been sacrificed to allow the scanner to unambiguously detect subsequent trigger signals, with a further loss in scan time efficiency.
We used the average onset and duration of the quiescent window observed in the volunteer studies as a basis for examining patients with different pathologic conditions of the spinal cord. This resulted in good quality DTI images, with consistent cranio-caudal orientation of the primary eigenvectors within the white matter of the cord. The presence of ghosting, specifically of the CSF and cord, in our DTI studies of patients with space-occupying lesions (eg, Fig 6), suggests that alterations in the spinal cord dynamics are present in these cases. Focal increases in cord velocity have previously been reported by Tanaka et al48 in cases of cord compression associated with lower extremity motor function impairment, whereas Levy49 has documented decreases in CSF and cord motion in symptomatic cord compression and increases during secondary atrophy. Ideally, therefore, timing of DTI data acquisition should be based on velocity measurements performed on an individual basis.
In a clinical setting, the need for broad anatomic coverage along the spinal cord within a scanning time acceptable to patients raises a conflict between spatial resolution and attaining adequate signal-to-noise ratio (SNR). With the combination of cardiac triggering, data acquisition limited to part of the cardiac cycle, and multishot acquisition, the resultant scan time was roughly 12 minutes for DTI. Sagittal imaging planes may be used to extend the range of the spinal cord examined, but with currently demonstrated section thicknesses, this exacerbates partial-volume mixing both between gray and white matter and between the cord and CSF in the through-plane direction. As a result of cord curvature, this partial volume effect may be difficult to distinguish from pathologic processes. Equally, such partial volume effects are likely to have a detrimental effect on fiber tracking results. We have therefore focused on axial imaging planes for the present work.
Our preliminary experience shows that limiting data acquisition to spinal cord quiescence increased the fraction of spinal cord voxels for which the first eigenvector of the diffusion tensor had the expected rostral—caudal orientation throughout both the gray and white matter of the cervical spine. However, because axons may extend the entire length of the spinal cord, with shorter axons extending from the level of their point of entry or exit through spinal foramina to the brain,50 it is notable that relatively few fibers propagated from end to end in the comparatively short imaging volume (typically less than 3 vertebral bodies). It is not clear to what extent this is due to noise in the data and to the staircase effect from the large section thickness coupled with the curvature of the spinal cord. In some cases (eg, Fig 5), however, the emergence of nerve roots and the associated partial volume effects of crossing and bending fiber tracts seem to be likely to play a role. These issues are the focus of considerable attention in connection with intracranial fiber-tracking.51–56 In the presence of the overwhelming diffusion anisotropy, a second eigenvector representation may be better suited to demonstrating the sub-structures of the spinal cord. Lee and Alexander57 have recently shown that diffusion encoding patterns may be optimized to improve the estimates of the minor eigenvectors
The good correspondence between the DTI results and the pathologic appearances in conventional MR imaging in the limited pathologic cases studied so far hints at the possible future clinical application of spinal cord DTI. DTI seems to provide a useful window in the depiction of spinal cord anatomy, through the distinction of gray and white matter (ie, the butterfly-shaped gray matter configuration) within the cervical spinal cord. Indeed, several authors have already presented results from individual patients and small patient groups investigating the nature of diffusion and diffusion tensor changes in specific pathologic condtions, including multiple sclerosis and cervical spondylosis.16,23,58–61 In the presence of pathologic conditions, the ability to examine both diffusivity and anisotropy changes within the both gray and white matter compartments is of interest. A shortcoming of the present technique, therefore, is that despite the measures taken and the improvement relative to simple cardiac gating, clear differentiation of gray and white matter was not achieved in all sections in all subjects. Imperfect fat suppression in the present study resulting in the overlay of chemical shift of unsuppressed paraspinal fat signals onto the spinal cord or the inconsistent suppression of lipid signals within the spinal cord signals is a possible contributor to the lack of contrast. Subsequent investigations of quadratic phase radio-frequency pulses have shown improved saturation behavior, allowing the acquisition FOV to be more closely targeted to the spinal cord.62 Higher order shimming63,64 and the placement of materials around the neck to improve the magnetic field homogeneity65 may also prove helpful.
We consider it more likely however, that motion caused by respiration over the course of the scan, or due to the remaining slight movements of the spinal cord during the quiescent period, are responsible for the inconsistent depiction of gray-white contrast. Spuentrup et al66 have demonstrated the advantages of respiratory gating via navigator echoes for diffusion imaging of the spinal vertebrae.31 Residual ghosting artifacts attributed to respiration suggest that navigator echoes did not correct for all residual motion in the present study. A possible future direction therefore would be to account for both the respiratory and cardiac cycles during data acquisition, though in general this would be expected to prolong scan times. Alternatively, the navigator process may be modified to better suit correcting the motion of the small, low-contrast spinal cord that is not rigidly coupled to the surrounding, larger tissue mass, as has been done for coronary imaging studies. Auto-focus algorithms,34,67 inherently less motion sensitive sequences,68 and parallel data acquisition strategies40,69,70 may also be avenues for reducing motion artifacts in spinal cord DTI.
We have not investigated the comparative scan time or SNR efficiencies between our gated approach and other acquisition strategies. Limiting data acquisition to the portion of the cardiac cycle during which the spinal cord is quiescent reduces the scan efficiency to achieve the benefit of reduced artifact levels. Two and a half times as many averages of ungated data could potentially be performed in a comparable scan time, but this is unlikely to be sufficient to average out the spinal cord motion. By rejecting roughly a third of ungated averages on the grounds of motion-related reduction of their navigator echo intensities, Wang et al71 demonstrated ghost reduction and improved image homogeneity in brain DTI studies. If the same level of performance was achieved in the spine, this would allow a scan time reduction of approximately one third compared with the present study. Based on the cord motion time-courses, however, we expect higher levels of motion contamination in the spine, which would reduce this temporal advantage. Improving the SNR of the acquired data, by so-called PROPELLER acquisitions, which have the benefit of reinforcing the SNR by repeated sampling of the center of k-space,72,73 may allow the number of averages to be reduced. Alternatively, targeting image acquisition to the spinal canal by volume-selective or FOV limitation can help with the time reduction but tend to compromise SNR.13,26–29,74 A compromise on repetition time and imaging volume size with a 3D acquisition may also bring signal intensity averaging benefits.75 With the short readout train of just 9 echoes, susceptibility artifacts were not significant on axial acquisitions in the present study. Accepting the intrusion of susceptibility artifacts would allow more echoes to be acquired per shot, thus reducing the number of shots required and overall imaging time. Finally, because the present work was performed with a conventional quadrature array spine coil, the growing availability of coils and receiver chains suitable for parallel data acquisition (eg, SENSE, GRAPPA, ASSET, etc) opens a further avenue to reducing scan times.
Conclusion
In this preliminary study, we have attempted to demonstrate the specific utility of optimizing the choice of cardiac triggering delay with the aim of reducing motion-related artifacts in DTI studies of the spine. Considerable challenges remain if a greater range of coverage along the spinal cord is to be achieved while maintaining or improving the high spatial resolution and contrast properties of the present study. The use of high performance gradient systems, more sensitive coil geometries, and refinements to the data acquisition strategy may contribute to this progress. Data acquisition during the quiescent phase of spinal cord motion should be used to minimize ghosting artifacts and improve fiber tracking.
Acknowledgments
We express our gratitude to Dr. Gerard Crelier for the use of software for diffusion tensor visualization and analysis.
Footnotes
This study was funded by the NCCR on Neural Plasticity, and Repair.
Previously presented in a preliminary form at the Annual Meeting of the American Society of Neuradiology, June 5–11, 2004; Seattle, Wash.
References
- 1.Kucharczyk J, Mintorovitch J, Asgari HS, et al. Diffusion/perfusion MR imaging of acute cerebral ischemia. Magn Reson Med 1991;19:311–15 [DOI] [PubMed] [Google Scholar]
- 2.Chien D, Kwong KK, Gress DR, et al. MR diffusion imaging of cerebral infarction in humans. AJNR Am J Neuroradiol 1992;13:1097–102 [PMC free article] [PubMed] [Google Scholar]
- 3.Doran M, Hajnal JV, Young IR, et al. Diffusion-weighted MRI reveals white matter tracts. Diagn Imaging (San Franc) 1991;13:50–55 [PubMed] [Google Scholar]
- 4.Douek P, Turner R, Pekar J, et al. MR color mapping of myelin fiber orientation. J Comput Assist Tomogr 1991;15:923–29 [DOI] [PubMed] [Google Scholar]
- 5.Coremans J, Luypaert R, Verhelle F, et al. A method for myelin fiber orientation mapping using diffusion-weighted MR images. Magn Reson Imaging 1994;12:443–54 [DOI] [PubMed] [Google Scholar]
- 6.Conturo TE, Lori NF, Cull TS, et al. Tracking neuronal fiber pathways in the living human brain. Proc Natl Acad Sci U S A 1999;96:10422–27 [DOI] [PMC free article] [PubMed] [Google Scholar]
- 7.Mori S, Crain BJ, Chacko VP, et al. Three-dimensional tracking of axonal projections in the brain by magnetic resonance imaging. Ann Neurol 1999;45:265–69 [DOI] [PubMed] [Google Scholar]
- 8.Mori S, van Zijl PC. Fiber tracking: principles and strategies—a technical review. NMR Biomed 2002;15:468–80 [DOI] [PubMed] [Google Scholar]
- 9.Nagayoshi K, Ito Y, Monzen Y, et al. [Delineation of the white and gray matter of the normal human cervical spinal cord using diffusion-weighted echo planar imaging]. Nippon Igaku Hoshasen Gakkai Zasshi 1998;58:578–80 [PubMed] [Google Scholar]
- 10.Holder CA, Muthupillai R, Mukundan S Jr., et al. Diffusion-weighted MR imaging of the normal human spinal cord in vivo. AJNR Am J Neuroradiol 2000;21:1799–806 [PMC free article] [PubMed] [Google Scholar]
- 11.Clark CA, Barker GJ, Tofts PS. Magnetic resonance diffusion imaging of the human cervical spinal cord in vivo. Magn Reson Med 1999;41:1269–73 [DOI] [PubMed] [Google Scholar]
- 12.Ries M, Jones RA, Dousset V, et al. Diffusion tensor MRI of the spinal cord. Magn Reson Med 2000;44:884–92 [DOI] [PubMed] [Google Scholar]
- 13.Robertson RL, Maier SE, Mulkern RV, et al. MR line-scan diffusion imaging of the spinal cord in children. AJNR Am J Neuroradiol 2000;21:1344–48 [PMC free article] [PubMed] [Google Scholar]
- 14.Assaf Y, Mayk A, Cohen Y. Displacement imaging of spinal cord using q-space diffusion-weighted MRI. Magn Reson Med 2000;44:713–22 [DOI] [PubMed] [Google Scholar]
- 15.Bammer R, Fazekas F, Augustin M, et al. Diffusion-weighted MR imaging of the spinal cord. AJNR Am J Neuroradiol 2000;21:587–91 [PMC free article] [PubMed] [Google Scholar]
- 16.Clark CA, Werring DJ, Miller DH. Diffusion imaging of the spinal cord in vivo: estimation of the principal diffusivities and application to multiple sclerosis. Magn Reson Med 2000;43:133–38 [DOI] [PubMed] [Google Scholar]
- 17.Sun F, Wang X, Cao G, et al. Comparison of DTI-SSFSE and DTI-SSEPI sequence for white matter tractography of dog spine. Proceedings of the International Society for Magnetic Resonance in Medicine 2004;11:2476 [Google Scholar]
- 18.Melhem ER. Technical challenges in MR imaging of the cervical spine and cord. Magn Reson Imaging Clin N Am 2000;8:435–52 [PubMed] [Google Scholar]
- 19.Clark CA, Werring DJ. Diffusion tensor imaging in spinal cord: methods and applications—a review. NMR Biomed 2002;15:578–86 [DOI] [PubMed] [Google Scholar]
- 20.Barker GJ. Diffusion-weighted imaging of the spinal cord and optic nerve. J Neurol Sci 2001;186 Suppl 1:S45–S49 [DOI] [PubMed] [Google Scholar]
- 21.Holder CA. MR diffusion imaging of the cervical spine. Magn Reson Imaging Clin N Am 2000;8:675–86 [PubMed] [Google Scholar]
- 22.Bammer R, Augustin M, Prokesch RW, et al. Diffusion-weighted imaging of the spinal cord: interleaved echo-planar imaging is superior to fast spin-echo. J Magn Reson Imaging 2002;15:364–73 [DOI] [PubMed] [Google Scholar]
- 23.Tsuchiya K, Katase S, Fujikawa A, et al. Diffusion-weighted MRI of the cervical spinal cord using a single-shot fast spin-echo technique: findings in normal subjects and in myelomalacia. Neuroradiology 2003;45:90–94 [DOI] [PubMed] [Google Scholar]
- 24.Xu D, Henry RG, Mukherjee P, et al. Single-shot fast spin-echo diffusion tensor imaging of the brain and spine with head and phased array coils at 1.5 T and 3.0 T. Magn Reson Imaging 2004;22:751–59 [DOI] [PubMed] [Google Scholar]
- 25.Wheeler-Kingshott CA, Hickman SJ, Parker GJ, et al. Investigating cervical spinal cord structure using axial diffusion tensor imaging. Neuroimage 2002;16:93–102 [DOI] [PubMed] [Google Scholar]
- 26.Feinberg DA, Jakab PD. Tissue perfusion in humans studied by Fourier velocity distribution, line scan, and echo-planar imaging. Magn Reson Med 1990;16:280–93 [DOI] [PubMed] [Google Scholar]
- 27.Gudbjartsson H, Maier SE, Mulkern RV, et al. Line scan diffusion imaging. Magn Reson Med 1996;36:509–19 [DOI] [PubMed] [Google Scholar]
- 28.Maier SE, Gudbjartsson H, Patz S, et al. Line scan diffusion imaging: characterization in healthy subjects and stroke patients. AJR Am J Roentgenol 1998;171:85–93 [DOI] [PubMed] [Google Scholar]
- 29.Murphy BP, Zientara GP, Huppi PS, et al. Line scan diffusion tensor MRI of the cervical spinal cord in preterm infants. J Magn Reson Imaging 2001;13:949–53 [DOI] [PubMed] [Google Scholar]
- 30.Loth F, Yardmici MA, Alperin NA. Hydrodynamic modeling of cerebrospinal fluid motion within the spinal cavity. J Biomech Eng 2001;123:71–79 [DOI] [PubMed] [Google Scholar]
- 31.Friese S, Hamhaber U, Erb M, et al. The influence of pulse and respiration on spinal cerebrospinal fluid pulsation. Invest Radiol 2004;39:120–30 [DOI] [PubMed] [Google Scholar]
- 32.Dietrich O, Heiland S, Benner T, et al. Reducing motion artifacts in diffusion-weighted MRI of the brain: efficacy of navigator echo correction and pulse triggering. Neuroradiology 2000;42:85–91 [DOI] [PubMed] [Google Scholar]
- 33.Johnson GA, Maki JH. In vivo measurement of proton diffusion in the presence of coherent motion. Invest Radiol 1991;26:540–45 [DOI] [PubMed] [Google Scholar]
- 34.Atkinson D, Porter DA, Hill DL, et al. Sampling and reconstruction effects due to motion in diffusion-weighted interleaved echo planar imaging. Magn Reson Med 2000;44:101–09 [DOI] [PubMed] [Google Scholar]
- 35.Anderson AW, Gore JC. Analysis and correction of motion artifacts in diffusion weighted imaging. Magn Reson Med 1994;32:379–87 [DOI] [PubMed] [Google Scholar]
- 36.Skare S, Andersson JL. On the effects of gating in diffusion imaging of the brain using single shot EPI. Magn Reson Imaging 2001;19:1125–28 [DOI] [PubMed] [Google Scholar]
- 37.Jiang H, Golay X, van Zijl PC, et al. Origin and minimization of residual motion-related artifacts in navigator-corrected segmented diffusion-weighted EPI of the human brain. Magn Reson Med 2002;47:818–22 [DOI] [PubMed] [Google Scholar]
- 38.Bammer R, Stollberger R, Augustin M, et al. Diffusion-weighted imaging with navigated interleaved echo-planar imaging and a conventional gradient system. Radiology 1999;211:799–806 [DOI] [PubMed] [Google Scholar]
- 39.Jones DK, Pierpaoli C. Contribution of cardiac pulsation to variability of tractography results. Proceedings of the International Society for Magnetic Resonance in Medicine 2005;13:222 . [Google Scholar]
- 40.Jaermann T, Crelier G, Pruessmann KP, et al. SENSE-DTI at 3 T. Magn Reson Med 2004;51:230–36 [DOI] [PubMed] [Google Scholar]
- 41.Mamata H, Jolesz FA, Maier SE. Characterization of central nervous system structures by magnetic resonance diffusion anisotropy. Neurochem Int 2004;45:553–60 [DOI] [PubMed] [Google Scholar]
- 42.Netsch T. Towards real-time multi-modality 3-D medical image registration. Proc ICCV 2001;718–725
- 43.Pajevic S, Pierpaoli C. Color schemes to represent the orientation of anisotropic tissues from diffusion tensor data: application to white matter fiber tract mapping in the human brain. Magn Reson Med 1999;42:526–40 [PubMed] [Google Scholar]
- 44.Hofmann E, Warmuth-Metz M, Bendszus M, et al. Phase-contrast MR imaging of the cervical CSF and spinal cord: volumetric motion analysis in patients with Chiari I malformation. AJNR Am J Neuroradiol 2000;21:151–58 [PMC free article] [PubMed] [Google Scholar]
- 45.Quigley M, Haughton V, Nicosia M, et al. Motion of the spinal cord during the cardiac cycle in adult patients with a Chiari I malformation and adult volunteers. Proceedings of the American Society for Neuroradiology 2005. :217
- 46.Mikulis D, Wood ML, Zerdoner OA, et al. Oscillatory motion of the normal cervical spinal cord. Radiology 1994;192:117–21 [DOI] [PubMed] [Google Scholar]
- 47.Levy LM, Di Chiro G, McCullough DC, et al. Fixed spinal cord: diagnosis with MR imaging. Radiology 1988;169:773–78 [DOI] [PubMed] [Google Scholar]
- 48.Tanaka H, Sakurai K, Iwasaki M, et al. Craniocaudal motion velocity in the cervical spinal cord in degenerative disease as shown by MR imaging. Acta Radiol 1997;38:803–09 [DOI] [PubMed] [Google Scholar]
- 49.Levy LM. MR imaging of cerebrospinal fluid flow and spinal cord motion in neurologic disorders of the spine. Magn Reson Imaging Clin N Am 1999;7:573–87 [PubMed] [Google Scholar]
- 50.y Cajal S. Histology of the nervous system. Oxford, UK: Oxford University Press,1995. :236–84
- 51.Lazar M, Weinstein DM, Tsuruda JS, et al. White matter tractography using diffusion tensor deflection. Hum Brain Mapp 2003;18:306–21 [DOI] [PMC free article] [PubMed] [Google Scholar]
- 52.Zhang S, Bastin ME, Laidlaw DH, et al. Visualization and analysis of white matter structural asymmetry in diffusion tensor MRI data. Magn Reson Med 2004;51:140–47 [DOI] [PubMed] [Google Scholar]
- 53.Frank LR. Anisotropy in high angular resolution diffusion-weighted MRI. Magn Reson Med 2001;45:935–39 [DOI] [PubMed] [Google Scholar]
- 54.Tuch DS, Reese TG, Wiegell MR, et al. High angular resolution diffusion imaging reveals intravoxel white matter fiber heterogeneity. Magn Reson Med 2002;48:577–82 [DOI] [PubMed] [Google Scholar]
- 55.Zhan W, Stein EA, Yang Y. Mapping the orientation of intravoxel crossing fibers based on the phase information of diffusion circular spectrum. Neuroimage 2004;23:1358–69 [DOI] [PubMed] [Google Scholar]
- 56.Staempfli P, Jaermann T, Crelier GR, et al. Resolving fiber crossing using advanced fast marching tractography based on diffusion tensor imaging. Neuroimage 2006;30:110–20. [DOI] [PubMed] [Google Scholar]
- 57.Lee J, Alexander AL. Optimized diffusion tensor encoding schemes with anisotropic diffusion weighting. Proceedings of the International Society for Magnetic Resonance in Medicine 2004;11:444 [Google Scholar]
- 58.Mamata H, Jolesz FA, Maier SE. Apparent diffusion coefficient and fractional anisotropy in spinal cord: age and cervical spondylosis-related changes. J Magn Reson Imaging 2005;22:38–43 [DOI] [PubMed] [Google Scholar]
- 59.Agosta F, Rovaris M, Benedetti B, et al. Diffusion tensor MRI of the cervical cord in a patient with syringomyelia and multiple sclerosis. J Neurol Neurosurg Psychiatry 2004;75:1647. [DOI] [PMC free article] [PubMed] [Google Scholar]
- 60.Valsasina P, Agosta F, Rocca MA, et al. Mean diffusivity and fractional anisotropy histogram analysis of the cervical cord in patients with multiple sclerosis. Proceedings of the International Society for Magnetic Resonance in Medicine 2004;11:1535 [Google Scholar]
- 61.Hesseltine S, Law M, Rad M, et al. Changes in normal-appearing cervical spinal cord in multiple sclerosis measured by diffusion tensor imaging. Proceedings of the International Society for Magnetic Resonance in Medicine 2005;13:811 [Google Scholar]
- 62.Wilm BJ, Svensson J, Henning A, et al. Susceptibility artefact reduction in single-shot EPI diffusion imaging of the cervical spinal cord. Proceedings of the European Society for Magnetic Resonance in Medicine and Biology 2005;204 [Google Scholar]
- 63.Zhao Y, Anderson AW, Gore JC. Computer simulation studies of the effects of dynamic shimming on susceptibility artifacts in EPI at high field. J Magn Reson 2005;173:10–22 [DOI] [PubMed] [Google Scholar]
- 64.Schar M, Kozerke S, Fischer SE, et al. Cardiac SSFP imaging at 3 Tesla. Magn Reson Med 2004;51:799–806 [DOI] [PubMed] [Google Scholar]
- 65.Vavrek R, Guclu C. Improving field homogeneity on fat-suppressed cervical spine images. Proceedings of the International Society for Magnetic Resonance in Medicine 2005;[13]:1976 [Google Scholar]
- 66.Spuentrup E, Buecker A, Koelker C, et al. Respiratory motion artifact suppression in diffusion-weighted MR imaging of the spine. Eur Radiol 2003;13:330–36 [DOI] [PubMed] [Google Scholar]
- 67.Miller KL, Pauly JM. Nonlinear phase correction for navigated diffusion imaging. Magn Reson Med 2003;50:343–53 [DOI] [PubMed] [Google Scholar]
- 68.Norris DG. Implications of bulk motion for diffusion-weighted imaging experiments: effects, mechanisms, and solutions. J Magn Reson Imaging 2001;13:486–95 [DOI] [PubMed] [Google Scholar]
- 69.Bammer R, Auer M, Keeling SL, et al. Diffusion tensor imaging using single-shot SENSE-EPI. Magn Reson Med 2002;48:128–36 [DOI] [PubMed] [Google Scholar]
- 70.Wilson GJ, Wang P, Szumowsi J, et al. Diffusion-weighted imaging of the spinal cord using SENSE at 3T. Proceedings of the International Society for Magnetic Resonance in Medicine 2004;12:2517 [Google Scholar]
- 71.Wang JJ, Deichmann R, Hsiao I, et al. Selective averaging for the diffusion tensor measurement. Magn Reson Imaging 2005;23:585–90 [DOI] [PubMed] [Google Scholar]
- 72.Dietrich O, Herlihy A, Dannels WR, et al. Diffusion-weighted imaging of the spine using radial k-space trajectories. MAGMA 2001;12:23–31 [DOI] [PubMed] [Google Scholar]
- 73.Wu Y, Field AS, Alexander AL. Diffusion tensor imaging of the human cervical spinal cord using propeller. Proceedings of the International Society for Magnetic Resonance in Medicine 2004;11:2125 [Google Scholar]
- 74.Morrell G. Volume-selective excitation for improved imaging of the spine. Proceedings of the International Society for Magnetic Resonance in Medicine 2003;11:2308 [Google Scholar]
- 75.Jeong E-K, Kim S-E, Guo J, et al. High-resolution 3D diffusion tensor imaging of the cervical spinal cord at 3T. Proceedings of the International Society for Magnetic Resonance in Medicine 2005;13:1361 [Google Scholar]