

Abstract
Purpose
To evaluate the interobserver variability associated with quantitative and qualitative MRI assessments of malignant pleural mesothelioma (MPM).
Materials and Methods
Patients with MPM who underwent uniform-protocol preoperative MRI between 2009 and 2014 were included. The MRI-derived tumor volume was estimated. Unidimensional measurements of maximal pleural thickness (Pmax) and average pleural thickness (Pavg) on axial MR images; maximal fissural thickness (Fmax); maximal diaphragmatic thickness (Dmax); and average diaphragmatic thickness (Davg) on sagittal reconstructed images were acquired. Interobserver agreement regarding the American Joint Committee on Cancer (AJCC) tumor stage at each criterion level was assessed by using Cohen κ statistics. Agreement between quantitative measurements was assessed by using Bland-Altman plots and intraclass correlation coefficients (ICCs).
Results
The study cohort included 349 patients (median age, 68 years [age range, 30–90 years), 273 (78%) of whom were men and 203 (58%) of whom had epithelioid-subtype tumors. Qualitative assessment performed by using the AJCC staging criteria (eighth edition) was concordant in 31% of cases and yielded considerable disagreement (κ = 0.177). Inspection of the Bland-Altman plots led to decisive agreement between the two reviewers regarding MRI-derived tumor volume (ICC, 0.979). There was also a good degree of agreement between the two reviewers regarding unidimensional measurements of Dmax (ICC, 0.807), Davg (ICC, 0.823), Pmax (ICC, 0.787), Pavg (ICC, 0.787), and Fmax (ICC, 0.659).
Conclusion
Quantitative assessment can enhance the clinical staging of MPM. Compared with qualitative assessment, quantitative assessment has low interobserver variability and could yield a tumor size criterion that is currently lacking in the AJCC clinical staging of MPM.
Supplemental material is available for this article.
© RSNA, 2020
Summary
Compared with qualitative assessment, quantitative assessment performed by using an optimized MRI protocol has low interobserver variability independent of radiologist experience and measurement criteria and could yield a tumor size criterion that is currently lacking in the American Joint Committee on Cancer clinical staging of malignant pleural mesothelioma.
Key Points
■ Quantitative metrics derived by using an optimized MRI protocol exhibited low interobserver variability compared with qualitative metrics.
■ There was better agreement between the reviewers regarding average measurements relative to corresponding single measurements.
■ Identification of a reproducible metric can yield a surrogate of tumor size in the American Joint Committee on Cancer clinical staging of malignant pleural mesothelioma.
Introduction
Malignant pleural mesothelioma (MPM) has a complex morphology, with a rindlike appearance, and the potential for simultaneous invasion of multiple tissue boundaries. Owing to these features, performing accurate and consistent radiologic assessment and clinical staging can be challenging (1). The qualitative nature of the current American Joint Committee on Cancer (AJCC) staging system leaves radiographic assessment at a disadvantage in terms of discerning invasion through multiple tissue planes over a broad area on a macroscopic scale. Quantitative metrics, including tumor volume, pleural thickness, and diaphragmatic thickness, are currently being explored as measurements to potentially enhance the accuracy of clinical staging and response assessment in the setting of MPM (2–4).
CT remains the primary modality for imaging MPM because it is universally available and serves as a cost-effective strategy for staging, diagnosis, and response assessment (5–8). However, it can be difficult to distinguish tumor from atelectasis or adjacent pleural fluid on CT images, especially non-contrast material–enhanced scans. Thus, accurately defining invasion and performing unidimensional measurements can be challenging (9). For example, although pleural thickness measured with CT has been identified as a promising quantitative metric (2), it has been associated with significant interobserver variability (10). Similarly, in a multicenter study (9,11), there was a poor correlation between the performances of two experienced radiologists in the determination of AJCC clinical stage and improved but moderate correlation in the assessment of tumor volume with use of the same CT scans. At root cause analysis, the discrepant volume estimates were attributed to perception difference and the inability to differentiate tumor from the adjacent chest wall and loculated pleural fluid at CT (9).
Compared with CT, MRI provides excellent soft-tissue resolution. Use of optimized protocols, such as those involving the use of gadolinium-based contrast agents and fat-suppression techniques, and optimized visualization of tumors can further enhance the accuracy of MRI in the identification of tumors and distinguishing them from adjacent structures and pleural fluid (6,7,12). We evaluated the interobserver variability of mesothelioma classifications based on AJCC TNM criteria (eighth edition) and quantitative measurements, including MRI-derived tumor volume, pleural thickness, and diaphragmatic thickness, in a single-institution cohort by using a uniform protocol and optimized MR images.
Materials and Methods
With approval from the institutional review board, we retrospectively reviewed data from the Institutional Mesothelioma Patient Data Registry (protocol number 2005P001520). We audited the records of patients at our institution who had a diagnosis of MPM and underwent MRI, performed with a uniform optimized protocol, between 2009 and 2014 (protocol number 2008P001887). Demographic data, laboratory findings, pertinent history, treatment details, histopathologic findings, and vital statuses were recorded. The study was compliant with provisions of the Health Insurance Portability and Accountability Act. No industry support was provided for this study.
MRI Protocol
We performed MRI for pleural tumor evaluation with a 3-T whole-body system (Magnetom TIM Trio; Siemens Healthineers, Erlangen, Germany) by using the manufacturer’s body-array coil for signal reception and body coil for transmission. Initial anatomic imaging consisted of coronal and transverse T2-weighted single-shot (half-Fourier single-shot turbo spin-echo sequence; repetition time msec/echo time msec, 1200/101; section thickness, 5.0 mm; intersection gap, 1.5 mm; signal averages, one; field of view, 400 mm; matrix size, 320 × 224; parallel imaging factor, 2) and three-dimensional T1-weighted volume-interpolated gradient-echo (volume-interpolated breath-hold examination sequence; 3.34/1.26; section thickness, 4.0 mm; signals averages, one; field of view, 400 mm; matrix size, 320 × 256; parallel imaging factor, two) acquisitions performed by using a breath-hold technique and encompassing the entire thoracic cavity and diaphragm. Diffusion-weighted images also were acquired, with b values of 250, 500, and 750 sec/mm2. The three-dimensional MR images were acquired after the administration of a standard dose (0.1 mmol per kilogram of body weight) of gadopentetate dimeglumine (Magnevist; Bayer-Schering, Leverkusen, Germany) at an injection rate of 3 cm3/sec. A saline chaser was not used. Our protocol was optimized to image tumors after contrast agent administration at the maximal enhancement derived from a dynamic contrast-enhanced imaging–determined time-enhancement curve.
Radiologic Assessment
Four hundred seventy-two patients with MPM were examined with MRI that was performed with the described uniform protocol from 2009 to 2014. Three hundred forty-nine of these patients had complete histopathologic and demographic information available for analyses and comprised the final cohort. Image analyses were performed by a thoracic radiology fellow with 2 years’ experience (D.J.M., reader 2) and an experienced thoracic radiologist with 10 years’ experience (R.R.G., reader 1), both of whom were blinded to the clinical data. For this study, both reviewers had access to all of the images for assessing clinical stage, and the contrast-enhanced three-dimensional images were used to derive the quantitative metrics (Fig 1).
Figure 1:

Diagram outlining the patient cohort.
The MRI-detected tumor in each patient was staged qualitatively by using the eighth edition of the AJCC TNM staging system. The detailed TNM criteria for each patient were scored in a binary fashion, and the overall clinical stage was determined on the basis of the published stage groupings. Prior to performing the quantitative and qualitative assessments, both radiologists reviewed the methodology by using five MR images, which were not included in the final analyses. The measurements were performed by using the same methodology and calipers on the picture archiving and communication system workstation, and both reviewers used the same software to measure tumor volume. The screenshots were saved, and both readers recorded the measurements independently. The methodology was established, and both reviewers independently obtained measurements.
The quantitative assessments were performed on a picture archiving and communication system workstation. Tumor volume was calculated by using Vitrea (Vital Images; Minnetonka, Minn) postprocessing software to load the axial gadolinium-enhanced three-dimensional T1-weighted radiofrequency spoiled gradient-echo (ie, volume-interpolated breath-hold examination) sequence. Tumor volume measurements were performed by using a semiautomated segmentation technique and manually selecting the tumor by using the vessel grow feature, allowing rapid segmentation of adjacent pixels on serial axial images with similar signal intensity. Once selected, the segmented volume was highlighted and could be reviewed in the axial, sagittal, and coronal orthogonal planes, allowing manual adjustment of the segmented volume contours. During segmentation, special attention was paid to exclude adjacent atelectasis, pleural fluid, and vasculature from the tumor volume (Fig 2).
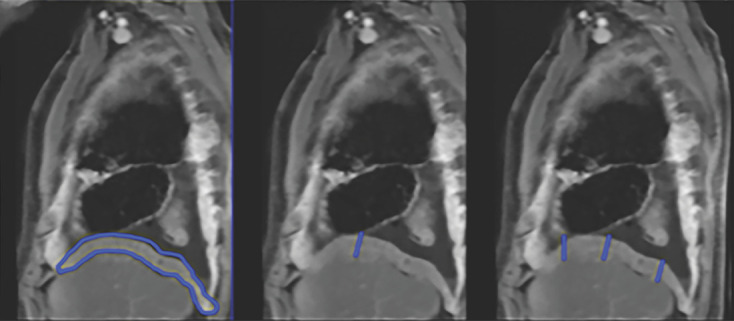
Figure 2a:

Multiplanar postcontrast MR images obtained in a patient with right-sided malignant pleural mesothelioma (MPM). (a) Axial MR images obtained at the upper (left), middle (middle), and lower (right) levels show pleural thickness measurements (blue lines): Pavg (average pleural thickness) and Pmax (sum of maximal pleural thicknesses at the three levels). (b) Sagittal MR image shows the fissure and Fmax (maximal fissure thickness) (blue outlines). (c) Sagittal MR image shows the diaphragm (right image) and diaphragmatic thickness measurements (middle and right images): Davg (average diaphragmatic thickness) and Dmax (maximal diaphragmatic thickness). (d) Axial (far left), sagittal (second from left image), coronal (third from left image), and three-dimensional (far right) MR images show segmentation (shaded blue) of the right-sided MPM.
Figure 2b:

Multiplanar postcontrast MR images obtained in a patient with right-sided malignant pleural mesothelioma (MPM). (a) Axial MR images obtained at the upper (left), middle (middle), and lower (right) levels show pleural thickness measurements (blue lines): Pavg (average pleural thickness) and Pmax (sum of maximal pleural thicknesses at the three levels). (b) Sagittal MR image shows the fissure and Fmax (maximal fissure thickness) (blue outlines). (c) Sagittal MR image shows the diaphragm (right image) and diaphragmatic thickness measurements (middle and right images): Davg (average diaphragmatic thickness) and Dmax (maximal diaphragmatic thickness). (d) Axial (far left), sagittal (second from left image), coronal (third from left image), and three-dimensional (far right) MR images show segmentation (shaded blue) of the right-sided MPM.
Figure 2c:
Multiplanar postcontrast MR images obtained in a patient with right-sided malignant pleural mesothelioma (MPM). (a) Axial MR images obtained at the upper (left), middle (middle), and lower (right) levels show pleural thickness measurements (blue lines): Pavg (average pleural thickness) and Pmax (sum of maximal pleural thicknesses at the three levels). (b) Sagittal MR image shows the fissure and Fmax (maximal fissure thickness) (blue outlines). (c) Sagittal MR image shows the diaphragm (right image) and diaphragmatic thickness measurements (middle and right images): Davg (average diaphragmatic thickness) and Dmax (maximal diaphragmatic thickness). (d) Axial (far left), sagittal (second from left image), coronal (third from left image), and three-dimensional (far right) MR images show segmentation (shaded blue) of the right-sided MPM.
Figure 2d:

Multiplanar postcontrast MR images obtained in a patient with right-sided malignant pleural mesothelioma (MPM). (a) Axial MR images obtained at the upper (left), middle (middle), and lower (right) levels show pleural thickness measurements (blue lines): Pavg (average pleural thickness) and Pmax (sum of maximal pleural thicknesses at the three levels). (b) Sagittal MR image shows the fissure and Fmax (maximal fissure thickness) (blue outlines). (c) Sagittal MR image shows the diaphragm (right image) and diaphragmatic thickness measurements (middle and right images): Davg (average diaphragmatic thickness) and Dmax (maximal diaphragmatic thickness). (d) Axial (far left), sagittal (second from left image), coronal (third from left image), and three-dimensional (far right) MR images show segmentation (shaded blue) of the right-sided MPM.
Quantitative assessment of tumor thickness was performed by each radiologist on axial and sagittal T1-weighted fat-saturated contrast-enhanced images obtained at each MRI examination, in accordance with previously published methods (2–4). The chest was divided into three segments at axial MRI: the upper thorax above the carina, the middle thorax between the carina and inferior pulmonary vein insertion into the left atrium, and the lower thorax inferior to this level. At each level, the chest was divided into anterior and posterior halves. Three measurements were performed at each level by using electronic calipers: the maximal tumor thickness perpendicular to the chest wall along the anterior and posterior pleural surfaces and a single measurement of the maximal tumor thickness along the mediastinal pleura. From these pleural thickness measurements, the sum of maximal pleural thickness (Pmax) values at the three levels was calculated (2). Additional measurements of the diaphragm and interlobar fissures were performed on sagittal MR images. The maximal fissural thickness (Fmax) in the affected hemithorax was measured (4). For the diaphragmatic measurements, the diaphragm was divided into three sectors (anterior, middle, and posterior) on the sagittal images, and the maximal diaphragmatic thickness (Dmax) was measured at three sites corresponding to the maximal thickness of each sector of the diaphragm (3). The largest of the three measurements was recorded as the Dmax, and the average of the three diaphragmatic measurements, or average diaphragmatic thickness (Davg) (Fig 3), was recorded.
Figure 3a:

Bland-Altman plots of differences between the two reviewers in (a) MRI-derived tumor volume, (b) maximal pleural thickness (Pmax), (c) average pleural thickness (Pavg), (d) maximal fissural thickness (Fmax), (e) maximal diaphragmatic thickness (Dmax), and (f) average diaphragm thickness (Davg). Central gray lines indicate the overall mean difference, and the continuous green lines indicate the value of the bias predicted by using a linear model versus the measurement averages. Top and bottom red lines correspond to the upper and lower 95% limits of agreement. With a probability of 95%, differences in normalized scores of future possible examinations will be between the upper and lower limits of agreement (mean ± variability estimate = 1.96 standard deviation). The coefficient values for each line on the plots are provided in Table 3. Reference lines are included in each panel to facilitate comparisons between the panels.
Figure 3b:

Bland-Altman plots of differences between the two reviewers in (a) MRI-derived tumor volume, (b) maximal pleural thickness (Pmax), (c) average pleural thickness (Pavg), (d) maximal fissural thickness (Fmax), (e) maximal diaphragmatic thickness (Dmax), and (f) average diaphragm thickness (Davg). Central gray lines indicate the overall mean difference, and the continuous green lines indicate the value of the bias predicted by using a linear model versus the measurement averages. Top and bottom red lines correspond to the upper and lower 95% limits of agreement. With a probability of 95%, differences in normalized scores of future possible examinations will be between the upper and lower limits of agreement (mean ± variability estimate = 1.96 standard deviation). The coefficient values for each line on the plots are provided in Table 3. Reference lines are included in each panel to facilitate comparisons between the panels.
Figure 3c:

Bland-Altman plots of differences between the two reviewers in (a) MRI-derived tumor volume, (b) maximal pleural thickness (Pmax), (c) average pleural thickness (Pavg), (d) maximal fissural thickness (Fmax), (e) maximal diaphragmatic thickness (Dmax), and (f) average diaphragm thickness (Davg). Central gray lines indicate the overall mean difference, and the continuous green lines indicate the value of the bias predicted by using a linear model versus the measurement averages. Top and bottom red lines correspond to the upper and lower 95% limits of agreement. With a probability of 95%, differences in normalized scores of future possible examinations will be between the upper and lower limits of agreement (mean ± variability estimate = 1.96 standard deviation). The coefficient values for each line on the plots are provided in Table 3. Reference lines are included in each panel to facilitate comparisons between the panels.
Figure 3d:

Bland-Altman plots of differences between the two reviewers in (a) MRI-derived tumor volume, (b) maximal pleural thickness (Pmax), (c) average pleural thickness (Pavg), (d) maximal fissural thickness (Fmax), (e) maximal diaphragmatic thickness (Dmax), and (f) average diaphragm thickness (Davg). Central gray lines indicate the overall mean difference, and the continuous green lines indicate the value of the bias predicted by using a linear model versus the measurement averages. Top and bottom red lines correspond to the upper and lower 95% limits of agreement. With a probability of 95%, differences in normalized scores of future possible examinations will be between the upper and lower limits of agreement (mean ± variability estimate = 1.96 standard deviation). The coefficient values for each line on the plots are provided in Table 3. Reference lines are included in each panel to facilitate comparisons between the panels.
Figure 3e:

Bland-Altman plots of differences between the two reviewers in (a) MRI-derived tumor volume, (b) maximal pleural thickness (Pmax), (c) average pleural thickness (Pavg), (d) maximal fissural thickness (Fmax), (e) maximal diaphragmatic thickness (Dmax), and (f) average diaphragm thickness (Davg). Central gray lines indicate the overall mean difference, and the continuous green lines indicate the value of the bias predicted by using a linear model versus the measurement averages. Top and bottom red lines correspond to the upper and lower 95% limits of agreement. With a probability of 95%, differences in normalized scores of future possible examinations will be between the upper and lower limits of agreement (mean ± variability estimate = 1.96 standard deviation). The coefficient values for each line on the plots are provided in Table 3. Reference lines are included in each panel to facilitate comparisons between the panels.
Figure 3f:

Bland-Altman plots of differences between the two reviewers in (a) MRI-derived tumor volume, (b) maximal pleural thickness (Pmax), (c) average pleural thickness (Pavg), (d) maximal fissural thickness (Fmax), (e) maximal diaphragmatic thickness (Dmax), and (f) average diaphragm thickness (Davg). Central gray lines indicate the overall mean difference, and the continuous green lines indicate the value of the bias predicted by using a linear model versus the measurement averages. Top and bottom red lines correspond to the upper and lower 95% limits of agreement. With a probability of 95%, differences in normalized scores of future possible examinations will be between the upper and lower limits of agreement (mean ± variability estimate = 1.96 standard deviation). The coefficient values for each line on the plots are provided in Table 3. Reference lines are included in each panel to facilitate comparisons between the panels.
Statistical Analysis
We evaluated the extent of disagreement between readers who use categorical measurements, such as metrics in the eighth edition of the AJCC clinical staging system, by using Cohen κ statistics, with corresponding 95% confidence intervals (CIs). Similarly, for continuous measurements (eg, volumetric assessments, maximal and average MRI-measured tumor, fissural, and diaphragmatic values), we initially assessed the normality of the distribution of the differences between the values recorded by the two readers by using the Shapiro-Wilk test and preliminarily used the Wilcoxon signed rank test to detect a possible difference in medians. In addition, we calculated the intraclass correlation coefficient (ICC); specifically, we assumed that both the patients and the readers had been randomly selected to yield a result based on two-way random effects analysis of variance (ICC [2,k]), as described by Shrout and Fleiss (13). Finally, to address levels of agreement, we analyzed Bland-Altman plots to consider whether we observed proportional bias and heteroscedasticity, and when this was the case, we calculated the appropriate corresponding 95% limits of agreement, following the indications of Ludbrook (14). All of the calculations were performed by using R software (R Foundation for Statistical Computing; Vienna, Austria), version 3.5.1, with appropriate packages for interrater agreement calculations (“irr,” “psych,” “fmsb”).
Results
The study cohort included patients with MPM who were referred for surgical evaluation between 2009 and 2014 and underwent preoperative MRI, which was performed with a uniform protocol. Four hundred seventy-two patients underwent MRI with our optimized protocol, and 123 of them were excluded because they did not have complete data for analyses. The final study cohort comprised 349 patients. These patients’ baseline demographic data, disease characteristics, and exposure history are provided in Table 1. The median age of the patients was 68 years (age range, 30–90 years). Two hundred seventy-three (78%) patients were men, and 203 (58%) patients had epithelioid-subtype tumors.
Table 1:
Demographic, Imaging, Treatment, and Histopathologic Data on the Study Cohort

As reported in Table 2, we found that the only quantitative metric for which there was a nonsignificant difference in median values (Wilcoxon signed rank test) was tumor volume (P = .066). There were significant differences (P < .05) in all other measurements with the Wilcoxon signed rank test. Thus, study results were already indicative of a higher level of disagreement between the two readers. These findings were supported by the ICCs: Only tumor volume yielded an ICC higher than 0.95 (ICC, 0.979 [95% CI: 0.975, 0.983]), which is considered by several sources (15) to indicate good to moderate agreement. In contrast, all of the other measurements yielded ICC values lower than or equal to 0.807 (for agreement on Dmax measurements) and as low as 0.659 (for agreement on Fmax measurements), again revealing a more pronounced level of disagreement.
Table 2:
Summary of Agreement Indexes

By inspecting the Bland-Altman plots (Fig 3), we observed that with the exception of tumor volume, all quantitative measurements showed heteroscedasticity—that is, an increasing variability in the difference for increasing values of the average—and sometimes significant proportional bias (P = .003 for Pmax and Pavg). For this reason, we modeled the bias and calculated corresponding “V-shaped” 95% limits of agreement, following the indications of Ludbrook (14). In addition, an overall estimate of the average bias was reported on each plot as the overall mean difference, with reference vertical lines at common values of the average, to facilitate comparisons of the five linear measurements. Tumor volume was the only measurement that was on a different scale, because of the different unit of measure, and it was the only metric for which the readers mostly reported values within standard Bland-Altman 95% limits of agreement (−208.27, 228.97). However, reader 1 had greater bias (10.350) than reader 2 with respect to the other measurements, which also was possibly the result of the different measurement unit. All of the details related to the 95% limits of agreement (including intercepts and slopes) are provided in Table 3.
Table 3:
Intercept and Slopes Values for 95% Limits of Agreement in Figure 2

A summary (means, standard deviations, ranges, first and third quartiles) of the measurement values reported by the two readers is provided in Table 4. The median MRI-derived tumor volume for reader 1 was 689.8 cm3 (range, 15.6–3202.4 cm3) compared with a median MRI-derived tumor volume of 686.6 cm3 (range, 11.8–3222.1 cm3) measured by reader 2. Median linear measurements obtained by reader 1 versus reader 2, respectively, were: 37 mm versus 34 mm for Pmax, 6.2 mm versus 5.0 mm for Fmax, 13.1 mm versus 12.2 mm for Dmax, and 8.9 mm versus 8.8 mm for Davg.
Table 4:
Summary of Quantitative Measurements Obtained by Readers

Measurement variability was comparable across all metrics without significant differences. Pmax measurements were evenly distributed between the CIs, with a few outliers. In comparison, Pavg measurements were more closely correlated, with fewer outliers. Therefore, between these two metrics, Pavg may be the better one to include as a surrogate for pleural thickness measurements.
The effect was less dramatic when Dmax and Davg measurements were compared. Variability in Fmax measurements also was low. Fissural measurements were relatively simple because the lung has good contrast, and, thus, both boundaries of the fissure could be visualized and measured. Results of a previous study (4) showed that an Fmax measurement of greater than 5 mm or less than or equal to 5 mm can be used as a binary variable. There was low interobserver variability across the range, with very few outliers, owing to good visualization of the tumors and use of the semiautomatic feature of the software.
Qualitative MRI assessment performed by using the AJCC cancer staging criteria (eighth edition) resulted in concordant staging between the two reviewers in 31% of cases (Table 5), with a Cohen κ index of 0.177 (95% CI: 0.119, 0.235), which was interpreted as indicating slight agreement by Landis and Koch (16) but reflective of a high level of disagreement. The concordance between the two reviewers in assessing individual classification criteria is summarized in Table E1 (supplement). Of note: Perception differences regarding three qualitative elements (endothoracic fascia involvement [33% detected], lung parenchyma [44% detected], and chest wall [35% detected]) contributed to discordant staging.
Table 5:
Concordance in Clinical TNM Staging between Reviewers 1 and 2

Discussion
Clinical staging of MPM, which is usually performed by using CT, has been unsatisfactory, with low accuracy and high interobserver variability (9). MRI has been used selectively for evaluating MPM, primarily to resolve ambiguity regarding CT findings (6,7,17). Although MRI is more expensive and technically challenging, and less widely available, it has been shown to be superior to CT in the detection of occult chest wall invasion, bone involvement, transdiaphragmatic extension, spread along the interlobar fissures, and extension into the endothoracic fascia (6,18). These advantages suggest that using MRI as a primary modality for clinical staging could improve staging performance relative to that with CT.
The current study was designed for evaluation of the interobserver variability associated with MRI clinical staging; quantitative metrics, including tumor volume; and/or the linear metrics of pleural, diaphragmatic, and fissural thickness. These metrics can be readily derived by using an optimized MRI protocol and may yield a tumor size criterion to further augment staging accuracy. In the current study, despite the advantages associated with MRI, the concordance rate (31%) associated with AJCC clinical staging with MRI was similar to previously published concordance rates associated with using CT (36%) (9,11). There continued to be significant discrepancy between the reviewers with respect to qualitative metrics. Root cause analysis of the current study results revealed that the low reviewer concordance observed with use of MRI reflected a perception difference regarding the degree of involvement and invasion of anatomic planes that are attributable to selecting optimal sequences for assessing involvement.
Each MRI study comprised six imaging sequences (approximately 700 images) that were potentially relevant for evaluation of the 25 staging criteria. All sequences were available to both reviewers to assess the clinical staging. Therefore, experience and familiarity with MRI sequences potentially could have contributed to the observed perception differences. In contrast, the perception error noted in a CT study (9) in which both reviewers were highly experienced was attributed primarily to study parameters and the low resolution of tissue planes and tissue-fluid boundaries associated with CT.
Results of the current study demonstrate that quantitative metrics derived from an optimized MRI protocol exhibit low interobserver variability, independent of the metric considered and radiologist experience. It is important that both the CT and MRI study results indicate superior concordance of quantitative versus qualitative metrics, supporting the argument for including quantitative criteria as a surrogate for tumor stage. The difference in performance between CT (9,11) and MRI, independent of operator experience, may be attributed to improved delineation of tumors on contrast-enhanced MR images and the ease of segmentation resulting from the high contrast between tumor and adjacent tissues. Optimization of the MRI protocol helped in distinguishing tumor from effusion and adjacent tissues and thus in minimizing differences in the perception of tumor between the two reviewers. Because the sequence acquisition time was based on maximal tumor enhancement and the acquired data were isotropic, the resultant images were easy to segment and it was easy to obtain measurements in all three orthogonal planes on them.
Efforts to improve the performance of TNM staging of MPM have included validation of quantitative metrics as a surrogate for clinical stage (2,4). Although CT-derived tumor volume has emerged as a promising and feasible quantitative metric (4,9,11), the availability remains confined to centers of excellence. Conversely, unidimensional measurements such as pleural thickness (2) and diaphragmatic thickness (3) may be more feasible to implement globally. Volumetric tumor measurement with CT has been shown to be feasible and reproducible in a prospective multicenter study (9,11), and assigning patients to stage groups according to tumor volume may yield superior prognostic information compared with qualitative clinical staging. In addition, unidimensional quantitative metrics may yield additional orthogonal information, further improving prognoses. In a large single-center study involving 472 patients, Gill et al (4) found that a quantitative staging model comprising CT-derived tumor volume and Fmax was substantially better as a prognostic classifier compared with AJCC clinical staging performed by using CT only. Although the MRI-derived tumor volume measurement is relatively easier to obtain and demonstrates improved interreviewer concordance independent of radiologist experience, a formal comparison with the CT-derived tumor volume and prognostic significance is needed. Moreover, because of the superior tissue visualization, the tumor volume estimates derived from MRI, as compared with CT, may be larger, particularly for early-manifesting tumors and tumors appearing as a thin rind with loculated pleural effusion, such that optimal categorical cut points may differ from those determined by using CT.
de Perrot et al (3) studied tumor, fissural, and diaphragmatic thicknesses measured at CT in 65 patients with MPM who underwent surgery after neoadjuvant radiation therapy and found diaphragmatic thickness to be prognostic. The superior soft-tissue resolution at MRI relative to that at CT, including the ability to differentiate tumor from atelectasis, pleural fluid, and normal extrapleural soft tissue and chest wall tissue, was potentially advantageous when these quantitative measurements were obtained. Optimal enhancement facilitated excellent visualization of tumors in all planes and thus accurate unidimensional measurements. Among the unidimensional measurements, Dmax and Davg had the lowest interobserver variability in the current study.
This study had several limitations. Only those patients who underwent uniform-protocol MRI optimized to ensure uniformity in image analysis and quantification were included. All studies were performed by using optimized gadolinium-enhanced MRI sequences, and the interobserver variability of MRI-based clinical staging without contrast enhancement in this setting was not evaluated. Compared with CT, MRI is relatively prone to variability across imaging units and institutions, possibly limiting its translational potential. In addition, MRI is not yet universally available, is more costly than CT, and requires a longer imaging time, specific expertise, and ongoing protocol optimization. Moreover, because the cohort in the current study comprised patients who underwent surgery, chemotherapy, and palliative care, complete histopathologic and prognostic information was not available in all cases. Also, only two readers assessed the variability of the metrics; a larger study to assess adaptability to clinical practice was recommended.
In conclusion, our study results suggest that quantitative assessment performed with MRI can augment standard qualitative assessment in the clinical staging of MPM. Each of the quantitative metrics evaluated demonstrated low interobserver variability. The problems with clinical staging of MPM are manifest, and introducing a quantitative component has the potential to improve prognostication and guide treatment selection. It is not yet clear whether or in what capacity quantitative measurement may be incorporated into the clinical staging of MPM; however, identifying those metrics that showed low variability was the first step. Future studies in which the prognostic importance of the most reproducible metrics is compared are needed. MRI demonstrated both the advantages and challenges that should be considered as MPM staging continues to evolve.
SUPPLEMENTAL TABLES
Disclosures of Conflicts of Interest: R.R.G. disclosed no relevant relationships. D.J.M. disclosed no relevant relationships. R.T.S. Activities related to the present article: disclosed no relevant relationships. Activities not related to the present article: employed by, holds a patent with, and owns stock in Siemens Healthineers. Other relationships: received payment for developing free-breathing MR angiography system and pulmonary blood flow MRI method. E.M. disclosed no relevant relationships. R.B. Activities related to the present article: disclosed no relevant relationships. Activities not related to the present article: payment for expert testimony on behalf of patients seeking compensation from asbestos and tobacco manufacturers and physicians in malpractice lawsuits; research grants or grants pending from The National Cancer Institute, Department of Defense, Roche, Genentech, Siemens, Gritstone, Epizyme, Merck, Verastem, Medgenome, and The National Institutes of Health; payment for lectures from the International Association for the Study of Lung Cancer, American Association for Thoracic Surgery, American College of Surgery, the Alliance for Clinical Trials in Oncology, Society of Thoracic Surgeons, HMS, Johnson and Johnson, Intuitive, Astra Zeneca, Roche, Genentech, Novocure, Siemens Healthineers, and Medgenome; patent for invention licensed through hospital employer (Brigham and Women’s Hospital); owns and has equity in Navigation Sciences. Other relationships: disclosed no relevant relationships. W.G.R. disclosed no relevant relationships.
Abbreviations:
- AJCC
- American Joint Committee on Cancer
- CI
- confidence interval
- Davg
- average diaphragmatic thickness
- Dmax
- maximal diaphragmatic thickness
- Fmax
- maximal fissural thickness
- ICC
- intraclass correlation coefficient
- MPM
- malignant pleural mesothelioma
- Pavg
- average pleural thickness
- Pmax
- maximal pleural thickness
References
- 1.Gill RR, Gerbaudo VH, Sugarbaker DJ, Hatabu H. Current trends in radiologic management of malignant pleural mesothelioma. Semin Thorac Cardiovasc Surg 2009;21(2):111–120. [DOI] [PubMed] [Google Scholar]
- 2.Nowak AK, Chansky K, Rice DC, et al. The IASLC mesothelioma staging project: proposals for revisions of the T descriptors in the forthcoming eighth edition of the TNM classification for pleural mesothelioma. J Thorac Oncol 2016;11(12):2089–2099. [DOI] [PubMed] [Google Scholar]
- 3.de Perrot M, Dong Z, Bradbury P, et al. Impact of tumour thickness on survival after radical radiation and surgery in malignant pleural mesothelioma. Eur Respir J 2017;49(3):1601428. [DOI] [PubMed] [Google Scholar]
- 4.Gill RR, Yeap BY, Bueno R, Richards WG. Quantitative clinical staging for patients with malignant pleural mesothelioma. J Natl Cancer Inst 2018;110(3):258–264. [DOI] [PMC free article] [PubMed] [Google Scholar]
- 5.Kent M, Rice D, Flores R. Diagnosis, staging, and surgical treatment of malignant pleural mesothelioma. Curr Treat Options Oncol 2008;9(2-3):158–170. [DOI] [PubMed] [Google Scholar]
- 6.Heelan RT, Rusch VW, Begg CB, Panicek DM, Caravelli JF, Eisen C. Staging of malignant pleural mesothelioma: comparison of CT and MR imaging. AJR Am J Roentgenol 1999;172(4):1039–1047. [DOI] [PubMed] [Google Scholar]
- 7.Wang ZJ, Reddy GP, Gotway MB, et al. Malignant pleural mesothelioma: evaluation with CT, MR imaging, and PET. RadioGraphics 2004;24(1):105–119. [DOI] [PubMed] [Google Scholar]
- 8.Truong MT, Viswanathan C, Godoy MBC, Carter BW, Marom EM. Malignant pleural mesothelioma: role of CT, MRI, and PET/CT in staging evaluation and treatment considerations. Semin Roentgenol 2013;48(4):323–334. [DOI] [PubMed] [Google Scholar]
- 9.Gill RR, Naidich DP, Mitchell A, et al. North American multicenter volumetric CT study for clinical staging of malignant pleural mesothelioma: feasibility and logistics of setting up a quantitative imaging study. J Thorac Oncol 2016;11(8):1335–44. [DOI] [PMC free article] [PubMed] [Google Scholar]
- 10.van Klaveren RJ, Aerts JG, de Bruin H, Giaccone G, Manegold C, van Meerbeeck JP. Inadequacy of the RECIST criteria for response evaluation in patients with malignant pleural mesothelioma. Lung Cancer 2004;43(1):63–69. [DOI] [PubMed] [Google Scholar]
- 11.Rusch VW, Gill R, Mitchell A, et al. A multicenter study of volumetric computed tomography for staging malignant pleural mesothelioma. Ann Thorac Surg 2016;102(4):1059–1066. [DOI] [PMC free article] [PubMed] [Google Scholar]
- 12.Gill RR, Gerbaudo VH, Jacobson FL, et al. MR imaging of benign and malignant pleural disease. Magn Reson Imaging Clin N Am 2008;16(2):319–339. [DOI] [PubMed] [Google Scholar]
- 13.Shrout PE, Fleiss JL. Intraclass correlations: uses in assessing rater reliability. Psychol Bull 1979;86(2):420–428. [DOI] [PubMed] [Google Scholar]
- 14.Ludbrook J. Confidence in Altman-Bland plots: a critical review of the method of differences. Clin Exp Pharmacol Physiol 2010;37(2):143–149. [DOI] [PubMed] [Google Scholar]
- 15.Koo TK, Li MY. A guideline of selecting and reporting intraclass correlation coefficients for reliability research. J Chiropr Med 2016;15(2):155–163. [Published correction appears in J Chiropr Med 2017;16(4):346.]. [DOI] [PMC free article] [PubMed] [Google Scholar]
- 16.Landis JR, Koch GG. The measurement of observer agreement for categorical data. Biometrics 1977;33(1):159–174. [PubMed] [Google Scholar]
- 17.Gill RR. Imaging of mesothelioma. Recent Results Cancer Res 2011;189:27–43. [DOI] [PubMed] [Google Scholar]
- 18.Yamamuro M, Gerbaudo VH, Gill RR, Jacobson FL, Sugarbaker DJ, Hatabu H. Morphologic and functional imaging of malignant pleural mesothelioma. Eur J Radiol 2007;64(3):356–366. [DOI] [PubMed] [Google Scholar]
Associated Data
This section collects any data citations, data availability statements, or supplementary materials included in this article.