

Abstract
Purpose
To use global longitudinal strain (GLS) as a marker of left ventricular decompensation in aortic stenosis and to investigate the relationship of GLS measured with cardiac MRI with markers of myocardial fibrosis, symptom development, remodeling, and clinical outcomes.
Materials and Methods
Patients with aortic stenosis and healthy control subjects were assessed. GLS was assessed by using cardiac MRI feature tracking, diffuse fibrosis by T1 mapping, and replacement fibrosis using late gadolinium enhancement. Follow-up was prospective for the primary endpoint of all-cause mortality.
Results
GLS was reduced in aortic stenosis (n = 159) compared with control subjects (n = 41) (−17.6% ± 3.1 [standard deviation] vs −18.9% ± 2.6, P = .02). GLS demonstrated weak associations with aortic stenosis severity (Vmax; r = 0.24, P = .0005) but showed moderate correlation with T1 mapping measures of myocardial fibrosis (eg, indexed extracellular volume [iECV]; r = 0.43, P < .0001). Moreover, GLS was reduced in patients with midwall fibrosis compared with control subjects (P < .001), although values were similar to those of patients with myocardial infarction (P = .25). In adjusted analyses, GLS was associated with total myocardial fibrosis burden (iECV) and ejection fraction (both P < .001). GLS offered poor discrimination between disease states, inability to distinguish between control subjects and patients (area under the curve [AUC], 0.60), presence or absence of fibrosis (AUC, 0.63), or symptomatic severity (left ventricular decompensation AUC, 0.64). At follow-up (median, 1466 days), 21 patients died. GLS did not independently predict clinical outcomes.
Conclusion
GLS correlates with established markers of myocardial fibrosis. However, widespread utility of single GLS measurements may be limited by overlap between disease states and its inability to predict clinical outcomes beyond current established markers.
© RSNA, 2019
Summary
Global longitudinal strain by using cardiac MRI is a widely available functional surrogate of myocardial fibrosis but is limited by overlap between diseases and does not provide additional prognostic information beyond established cardiac MRI assessments; its clinical utility may be greater when assessing changes over time.
Key Points
■ Global longitudinal strain (GLS) is proposed as a marker of left ventricular decompensation in aortic stenosis.
■ GLS appears to occur as the functional manifestation of myocardial fibrosis in aortic stenosis; however, it is not specific to the etiology of fibrosis, and there does not appear to be a clear threshold to define left ventricular decompensation in aortic stenosis.
■ Although GLS is a widely available functional surrogate of myocardial fibrosis, its clinical utility may be greater when assessing changes over time rather than single time-point measurements; thus, studies evaluating the utility of serial GLS measurements over time are necessary to determine its role in the assessment of patients with aortic stenosis.
Introduction
Aortic stenosis is a major health care burden that is set to expand rapidly with an aging population. It is characterized by progressive valve narrowing, which causes a left ventricular hypertrophic remodeling response. The remodeling response (ie, how the ventricle changes shape in response to aortic stenosis) is adaptive for many years but ultimately results in progressive myocardial cell death and fibrosis, which in turn drives clinical progression to symptoms, heart failure, and adverse events. Current guidelines recommend aortic valve replacement once patients reach this decompensated phase, as evidenced by either the development of symptoms or a reduction in left ventricular ejection fraction. However, symptom development, which is routinely interpreted as an indicator of left ventricular decompensation, is often challenging in elderly patients with frailty or multiple morbidities, although changes in ejection fraction occur relatively late and are often irreversible. Interest exists, therefore, in developing earlier and more objective imaging markers of left ventricular decompensation.
Global longitudinal strain (GLS), the fractional change in length of myocardium relative to baseline averaged across left ventricular segments, provides an assessment of the left ventricular systolic longitudinal function that appears to demonstrate changes before alterations in ejection fraction are evident (1). Negative strain values describe myocardial shortening, so that GLS values closer to zero represent reduced shortening, hereafter referred to as reduced GLS. GLS can be measured using speckle-tracking echocardiography or, as in the present study, feature-tracking cardiovascular MRI with recent comparisons demonstrating excellent agreement between the two approaches (2,3). GLS has been investigated in a variety of myocardial pathologic conditions (4–8), including aortic stenosis (9,10). Several recent studies have demonstrated reduced GLS in patients with severe aortic stenosis before any alteration in ejection fraction (11,12). It has been hypothesized that, in this condition, GLS reduction reflects underlying myocardial fibrosis, thereby serving as a marker of left ventricular decompensation. However, this has not been confirmed to date.
Cardiac MRI allows assessment of GLS but also provides reference standard measurements of left ventricular remodeling and myocardial fibrosis, with potential therefore to detect precursors of left ventricular dysfunction, which would be highly clinically relevant to this population. We sought therefore to evaluate the relationship of cardiac MRI–derived GLS with aortic stenosis severity, symptom development, and the left ventricular remodeling response to aortic stenosis and myocardial fibrosis, in addition to long-term clinical outcomes in patients with aortic stenosis and healthy volunteers.
Materials and Methods
Study Protocol
The study was conducted in accordance with the Declaration of Helsinki and approved by the local research ethics committee. Written informed consent was obtained from all participants. The tissue-tracking module of the CVI4.2 software package was provided on a trial basis by Circle Cardiovascular Imaging (Calgary, Alberta, Canada) for strain analysis in this study. Siemens Healthineers (Erlangen, Germany) provided the use of their T1 mapping work-in-progress software package in this study. No person from either company had access to study data or was involved in image analysis, manuscript preparation, or any part of the study. The authors had full control of the data submitted for publication.
Study Population
Patients with at least mild aortic stenosis (velocity >2 m/sec) attending the Edinburgh Heart Centre between March 2012 and August 2014 were invited to take part in the study as described previously (13). Data were collected on past medical history (diabetes mellitus, hypertension, hyperlipidemia, coronary artery disease), baseline echocardiography, and cardiac MRI assessments. In brief, exclusion criteria were other nontrivial valvular heart disease, contraindications to gadolinium-enhanced cardiac MRI, and nonischemic cardiomyopathy, including myocarditis. As reference standard for quantifying aortic stenosis, transthoracic echocardiography was performed to identify eligibility (iE33; Philips Medical Systems, the Netherlands) by a specialist research ultrasonographer (A.C.W.) as well as an echocardiography-certified cardiologist (C.W.L.C.). The severity of aortic stenosis was assessed by peak velocity, mean gradient, and valve area according to American Society of Echocardiography guidelines. Symptoms attributable to valve disease were assessed and their presence here used to define the development of left ventricular decompensation. Clinical assessment by a cardiologist, New York Heart Association class, and 6-minute walk test were used to define symptoms. Healthy volunteers were recruited from the community with similar demographic characteristics in terms of age and sex, but without history or clinical evidence of myocardial infarction. Hypertension was not excluded on account of the high prevalence of this important pathologic condition in the demographic studied. Final date of follow-up for all patients was May 11, 2017, with a median follow-up of 1466 days.
Image Acquisition and Analysis
Full imaging protocols have been described previously (13). In brief, cardiac MRI was performed by using a 3-T unit (Magnetom Verio; Siemens Healthcare, Erlangen, Germany). Long- and short-axis cardiac cine images (8-mm sections, 2-mm gap) were acquired for volumetric, mass, and functional calculation. In brief, the imaging protocol consisted of 6-mm section steady-state free precession acquisitions, with an approximate field of view (FOV) of 340 mm (adjusted to patient volume where required), generally with a 192 matrix and 72% phase resolution (adjusted to patient volume). These images were acquired with electrocardiographic (ECG) gating and minimal echo time (1.39 msec). Late gadolinium enhancement (LGE) was acquired with a inversion time (TI)-scout midventricle (8-mm section), ECG gating with a range of inversion times, 340 mm × 81% FOV, 192 matrix (all adjusted for patient volume). Optimal nulling for specific inversion time was confirmed and applied to an inversion-recovery short-axis stack, acquired with 9-mm sections and 1-mm gap, with FOV and matrix size identical to the TI scout. T1 mapping was acquired with 8-mm sections with 2-mm gap, FOV of 340 mm and matrix 192 adjusted for patient volume, and ECG gating with a 3-3-5 modified Look-Locker inversion-recovery scheme applied. Presence and extent of replacement fibrosis was assessed using LGE, performed 15 minutes after administration of 0.1 mmol/kg of gadobutrol (Gadovist; Bayer Pharma, Barmen, Germany), and the presence of midwall myocardial fibrosis was determined qualitatively by two independent expert operators (M.R.D. and C.W.L.C.), defined as 2 standard deviations above remote myocardial signal intensity, with minimal manual correction. Fibrosis was further quantified by calculating extracellular volume (ECV) expansion, which was assessed using myocardial T1 mapping, performed using a modified Look-Locker inversion recovery sequence and a standardized image analysis approach previously described (13,14). Segments with infarct-pattern LGE were excluded in T1 mapping analysis, whereas segments containing a midwall pattern LGE were not (15). Indexed extracellular volume (iECV) was also used for analysis (ECV% × left ventricular end-diastolic myocardial volume normalized to body surface area), as described previously (13). This marker modifies the ECV fraction, thereby providing a surrogate marker of the total volume of the extracellular compartment in the left ventricle—an indication of total fibrosis burden. We have previously demonstrated that a cutoff of greater than or equal to 22.5 mL/m2 acts as a useful threshold for differentiating patients with increased interstitial myocardial fibrosis compared with normal interstitial myocardial fibrosis (13). Finally, the mass-volume index was calculated by dividing the left ventricular mass by end-diastolic volume, as the conceptual cardiac MRI equivalent to echocardiogram-derived relative wall thickness measurement, providing a surrogate indicator of adverse remodeling in response to aortic stenosis. For all of the aforementioned analysis, cardiac MRI was performed by using OsiriX (version 4.1.1, Geneva, Switzerland).
For strain analysis, commercially available software (CVI4.2; Circle Cardiovascular Imaging) was used to draw left ventricular endo- and epicardial diastolic contours in two-, three-, and four-chamber long-axis views and all short-axis cine sections. After defining right ventricular insertion points, a fully automated strain analysis was carried out to produce two- and three-dimensional global longitudinal left ventricular strain calculations (Fig 1). As the most comparable parameter to echocardiography, data for two-dimensional GLS were used as the primary strain assessment for analysis (results for three-dimensional GLS are presented in Appendix E1 [supplement]).
Figure 1:

Automated strain analysis software platform. Endocardial contours are drawn manually (column A). Application of various qualitative strain outputs and overlays aids visual appreciation of relative deformation (columns B–D), as well as strain represented in polar plot (E) and graph form (F).
Clinical Outcomes
In an exploratory outcomes analysis, mortality data were collected from the General Register of Scotland with clinical events identified by search of electronic medical records to include only those resulting in hospital admission. The earliest event was used for the time-to-endpoint analysis, with one event counted for each patient. The primary clinical endpoint was all-cause mortality. The secondary clinical endpoint was a composite of all-cause mortality and hospital admission with heart failure.
Statistical Analysis
A statistical analysis plan was prespecified and published online prior to analysis (16). Summary statistics are provided for the baseline characteristics for both control subjects and patients with varying severity of aortic stenosis. Baseline characteristics were reported as percentage or mean or median, with standard deviation or interquartile range as appropriate, unless otherwise stated. Patients with aortic stenosis were divided into tertiles according to GLS. Continuous variables were compared by using parametric and nonparametric tests as appropriate. Categorical variables were compared by using the χ2 or the Fisher exact test where appropriate. Multivariable linear regression analysis was performed to assess the relationship between GLS and clinical parameters in patients with mild aortic stenosis as the referent group (model 1), established imaging markers of myocardial fibrosis and left ventricular decompensation in aortic stenosis (model 2), and a composite of the two (model 3). Multivariable Cox regression analysis was subsequently undertaken in all patients with aortic stenosis to evaluate the relationship between GLS and clinical outcomes of mortality and heart failure admission, adjusted for baseline variables of age, sex, and ejection fraction. Analyses were performed in R software (version 2.15.2, Vienna, Austria) and GraphPad Prism (v.7.0, GraphPad Software, La Jolla, Calif). Statistical significance was taken as a two-sided P < .05. The corresponding author had full access to all the data in the study and takes responsibility for its integrity and the data analysis.
Results
Patients versus Control Subjects
In total, data from 166 patients and 48 control subjects were available for initial inclusion. Seven patients and four control subjects were excluded because of incomplete cardiac MRI data for strain analysis. A further three control subjects were excluded because of evidence of infarct at LGE cardiac MR imaging, resulting in 159 patients and 41 control subjects being eligible for inclusion in the final analysis. Control participants were similar in sex but were younger by 8.7 years and had less comorbidity by design (Table 1). All key cardiac MRI parameters of the left ventricular remodeling response to aortic stenosis and decompensation were more abnormal in the patient cohort (left ventricular mass, iECV, LGE presence and distribution, ejection fraction) compared with control subjects. Overall, GLS was reduced in the patient cohort compared with control subjects (−17.6% ± 3.1 [standard deviation] vs −18.9% ± 2.6; 95% confidence interval [CI]: 0.23, 2.30). Substantial overlap in values between these two groups was observed, however, with no clear cutoff providing discrimination of health and disease.
Table 1:
Baseline Characteristics for Controls and Patients with Aortic Stenosis

Aortic Stenosis Severity
Similarly, although GLS reduced in a stepwise fashion with increasing aortic stenosis severity (mild, −19.9% ± 3.7; moderate, −18.7% ± 4.5; severe, −17.6% ± 4.0; severe symptomatic, −16.8% ± 3.7; P = .007; Fig 2a), there was major overlap between groups. Weak correlations were observed between GLS and severity of aortic stenosis by echo criteria (Vmax, r = 0.24, P = .0005; mean peak gradient, r = 0.25, P = .0004; aortic valve area, r = −0.17, P = .02).
Figure 2a:

Global longitudinal strain (GLS) stratified by disease severity, symptoms, and fibrosis. Two-dimensional GLS according to (a) severity of aortic stenosis (AS) versus control subjects (posthoc Bonferroni corrected P value, P < .01 taken as significant), (b, c) asymptomatic versus severe symptomatic patients, and (d, e) fibrosis and patients with late gadolinium enhancement (LGE) (posthoc Bonferroni corrected P value, P < .02 taken as significant). AUC = area under the curve, iECV = indexed extracellular volume.
Symptoms
No clear threshold was observed differentiating patients with symptoms of left ventricular decompensation (ie, severe symptomatic aortic stenosis) and those without (nonsevere asymptomatic, −18.1% ± 4.3; severe symptomatic, −16.8% ± 3.7; 95% CI: 0.1, 2.5; Fig 2b). Receiver operating characteristic curve analysis demonstrated poor sensitivity of GLS for the identification of aortic stenosis with symptomatic evidence of left ventricular decompensation (area under the curve, 0.64; Fig 2c).
Figure 2b:

Global longitudinal strain (GLS) stratified by disease severity, symptoms, and fibrosis. Two-dimensional GLS according to (a) severity of aortic stenosis (AS) versus control subjects (posthoc Bonferroni corrected P value, P < .01 taken as significant), (b, c) asymptomatic versus severe symptomatic patients, and (d, e) fibrosis and patients with late gadolinium enhancement (LGE) (posthoc Bonferroni corrected P value, P < .02 taken as significant). AUC = area under the curve, iECV = indexed extracellular volume.
Figure 2c:

Global longitudinal strain (GLS) stratified by disease severity, symptoms, and fibrosis. Two-dimensional GLS according to (a) severity of aortic stenosis (AS) versus control subjects (posthoc Bonferroni corrected P value, P < .01 taken as significant), (b, c) asymptomatic versus severe symptomatic patients, and (d, e) fibrosis and patients with late gadolinium enhancement (LGE) (posthoc Bonferroni corrected P value, P < .02 taken as significant). AUC = area under the curve, iECV = indexed extracellular volume.
Remodeling Response and Fibrosis
Overall, moderate correlations were observed with ejection fraction (r = −0.37, P < .0001) and cardiac MRI markers of interstitial fibrosis (two-dimensional GLS native T1 value, r = 0.35, P < .0001; two-dimensional GLS ECV%, r = 0.17, P = .03; two-dimensional GLS iECV, r = 0.43, P < .0001; Fig 3). Patients with increased total interstitial fibrosis burden (iECV ≥22.5 mL/m2) had reduced GLS compared with patients without (−16.9% ± 2.1 vs −18.4% ± 3.0; 95% CI: 0.5, 2.4; Fig 2d). In addition, GLS correlated with mass-volume index (r = 0.30, P = .0001), a measure of left ventricular remodeling. Patients with both midwall LGE (indicative of aortic stenosis–related left ventricular decompensation) and infarct LGE demonstrated lower GLS than patients without LGE (no LGE −18.6% ± 2.8 vs midwall −16.6% ± 2.9; 95% CI: 0.7, 2.9; and infarct −15.6% ± 3.1; 95% CI: 1.2, 4.4; Fig 2e). Indeed, GLS was reduced in patients with coronary artery disease versus no coronary artery disease (−16.9% ± 3.0 vs −18.4% ± 3.0; 95% CI: 0.6, 2.4). However, with GLS it was not possible to differentiate between these two patterns of late enhancement (−16.6% ± 2.9 vs −15.6% ± 3.1; 95% CI: −0.8, 2.7), and although GLS was lower in those with midwall late enhancement than all other patients (−16.7% ± 2.9 vs −18.0% ± 3.1, 95% CI: 0.3, 2.5), it was not specific to this pattern of injury (area under the curve, 0.63).
Figure 3a:
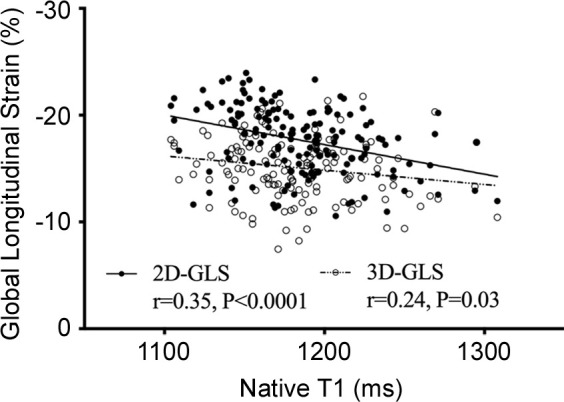
Relationship of global longitudinal strain (GLS) with fibrosis and ejection fraction. Correlation between two-dimensional (2D) and three-dimensional (3D) left ventricular GLS and (a) native T1, (b) extracellular volume (ECV), (c) indexed extracellular volume (iECV), and (d) ejection fraction among patients with aortic stenosis.
Figure 2d:

Global longitudinal strain (GLS) stratified by disease severity, symptoms, and fibrosis. Two-dimensional GLS according to (a) severity of aortic stenosis (AS) versus control subjects (posthoc Bonferroni corrected P value, P < .01 taken as significant), (b, c) asymptomatic versus severe symptomatic patients, and (d, e) fibrosis and patients with late gadolinium enhancement (LGE) (posthoc Bonferroni corrected P value, P < .02 taken as significant). AUC = area under the curve, iECV = indexed extracellular volume.
Figure 2e:

Global longitudinal strain (GLS) stratified by disease severity, symptoms, and fibrosis. Two-dimensional GLS according to (a) severity of aortic stenosis (AS) versus control subjects (posthoc Bonferroni corrected P value, P < .01 taken as significant), (b, c) asymptomatic versus severe symptomatic patients, and (d, e) fibrosis and patients with late gadolinium enhancement (LGE) (posthoc Bonferroni corrected P value, P < .02 taken as significant). AUC = area under the curve, iECV = indexed extracellular volume.
Figure 3b:

Relationship of global longitudinal strain (GLS) with fibrosis and ejection fraction. Correlation between two-dimensional (2D) and three-dimensional (3D) left ventricular GLS and (a) native T1, (b) extracellular volume (ECV), (c) indexed extracellular volume (iECV), and (d) ejection fraction among patients with aortic stenosis.
Figure 3c:

Relationship of global longitudinal strain (GLS) with fibrosis and ejection fraction. Correlation between two-dimensional (2D) and three-dimensional (3D) left ventricular GLS and (a) native T1, (b) extracellular volume (ECV), (c) indexed extracellular volume (iECV), and (d) ejection fraction among patients with aortic stenosis.
Figure 3d:
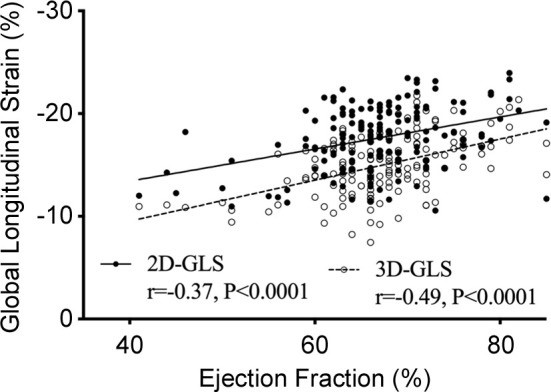
Relationship of global longitudinal strain (GLS) with fibrosis and ejection fraction. Correlation between two-dimensional (2D) and three-dimensional (3D) left ventricular GLS and (a) native T1, (b) extracellular volume (ECV), (c) indexed extracellular volume (iECV), and (d) ejection fraction among patients with aortic stenosis.
Multivariable linear regression indicated that important predictors of GLS were the total fibrosis burden (iECV), ejection fraction, and the presence of previous myocardial infarction at LGE imaging (Table 2). Additional clinical variables that demonstrated an association with GLS were male sex and severe aortic stenosis. When clinical and imaging variables were considered together, male sex, total myocardial fibrosis burden (iECV), and ejection fraction emerged as the independent predictors of GLS.
Table 2:
Multivariable Linear Regression: Clinical and Imaging Predictors of 2D Cardiac MRI Peak Global Longitudinal Strain in Patients with Aortic Stenosis

Clinical Outcomes
Twenty-one patients with aortic stenosis reached the primary endpoint of all-cause mortality. In addition, eight patients required hospital admission for heart failure. Two patients had both heart failure and mortality, with only the earliest event included in the analysis, resulting in 27 patients reaching the secondary composite endpoint (Table 3). Kaplan-Meier plots did not demonstrate a significance in either the primary (Fig 4 or secondary endpoint between tertiles of GLS.
Table 3:
Baseline Characteristics for Patients with Aortic Stenosis according to Tertile of 2D Cardiac MRI Peak Global Longitudinal Strain

Figure 4a:

Global longitudinal strain (GLS) and long-term clinical outcomes in patients with aortic stenosis. Kaplan-Meier plots to median follow-up (1466 days). (a) All-cause mortality and (b) composite of all-cause mortality and heart failure by tertile (T) of two-dimensional (2D) GLS. (c) Forest plot shows adjusted Cox regression models for primary and secondary composite clinical endpoints. CI = confidence interval, EF = ejection fraction, HR = hazard ratio.
Figure 4b:

Global longitudinal strain (GLS) and long-term clinical outcomes in patients with aortic stenosis. Kaplan-Meier plots to median follow-up (1466 days). (a) All-cause mortality and (b) composite of all-cause mortality and heart failure by tertile (T) of two-dimensional (2D) GLS. (c) Forest plot shows adjusted Cox regression models for primary and secondary composite clinical endpoints. CI = confidence interval, EF = ejection fraction, HR = hazard ratio.
Figure 4c:

Global longitudinal strain (GLS) and long-term clinical outcomes in patients with aortic stenosis. Kaplan-Meier plots to median follow-up (1466 days). (a) All-cause mortality and (b) composite of all-cause mortality and heart failure by tertile (T) of two-dimensional (2D) GLS. (c) Forest plot shows adjusted Cox regression models for primary and secondary composite clinical endpoints. CI = confidence interval, EF = ejection fraction, HR = hazard ratio.
On univariate analysis there was an observed trend to GLS acting as a predictor of all-cause mortality (hazard ratio [HR], 1.14; 95% CI: 0.99, 1.31) and it was a significant predictor of the composite secondary endpoint of death and heart failure admission (HR, 1.16; 95% CI: 1.03, 1.34). On multivariable Cox regression analysis, these borderline signals were lost after adjusting for age and sex. Ejection fraction emerged as an independent predictor of both the primary and secondary clinical endpoints after adjustment for age, sex, and GLS (HR, 0.93; 95% CI: 0.88, 0.98 and HR, 0.96; 95% CI: 0.91, 1.00; Table 4; Fig 4).
Table 4:
Cox Multivariable Regression Analysis: Predictors of Clinical Outcomes in Patients with Aortic Stenosis

Discussion
In this study, we have shown that cardiac MRI–derived GLS is associated with markers of left ventricular remodeling and decompensation in the context of aortic stenosis and that cardiac MRI–derived GLS correlates with cardiac MRI markers of myocardial fibrosis. Despite these important mechanistic associations, however, single GLS measurements demonstrate considerable overlap between patient groups and in particular offer poor discrimination for the identification of patients with symptomatic evidence of left ventricular decompensation. This may limit use of single time-point cardiac MRI–derived GLS measurements in clinical practice, although monitoring changes in GLS in individual patients over time may prove to be a better strategy.
Aortic stenosis is the most common form of heart disease in the developed world, and it is associated with significant morbidity and mortality (17). Accurate imaging techniques for the early identification of valve-related left ventricular decompensation are therefore crucial to risk stratification and in optimizing the timing of surgical or transcutaneous aortic valve replacement. For such an important and binary decision as proceeding to aortic valve replacement, a robust parameter is required—one that serves as a specific marker of valve-related left ventricular decompensation and provides defined thresholds to guide when and when not to proceed.
Our analysis confirms that cardiac MRI–derived GLS is associated with many other clinical parameters of left ventricular remodeling and decompensation related to aortic stenosis. The relationship of GLS to mass-volume index in this patient cohort indicates that GLS measurements respond to remodeling and hypertrophy associated with aortic stenosis. The most striking and consistent association was observed between GLS and each of the various cardiac MRI measures of myocardial fibrosis. We observed significant correlations with native T1, ECV fraction, and iECV, with the latter serving as one of only two predictors of GLS on multivariable analysis. Moreover, we observed reduced GLS in patients with increased burdens of diffuse interstitial fibrosis and in patients with a midwall pattern of LGE—two parameters that have been demonstrated to act as objective markers of left ventricular decompensation in aortic stenosis (13).
Based on the published evidence that cardiac MRI and echocardiographic GLS are comparable, GLS in aortic stenosis may therefore add value to current sonographic assessments, providing a useful surrogate of myocardial fibrosis, a parameter not otherwise detectable by ultrasonography, to complement the information provided by ejection fraction. It is important to note, however, that GLS was also reduced in patients with an infarct pattern of LGE; thus, although GLS can be considered a surrogate of myocardial fibrosis, it cannot be considered specific to valve-related left ventricular decompensation. This is highly relevant because patients with severe aortic stenosis and reduced GLS may simply have coexistent ischemic heart disease rather than left ventricular decompensation resulting from valve disease. Aortic valve replacement in these circumstances may therefore not be appropriate.
The clinical utility of cardiac MRI–derived GLS may also be limited by the major overlap observed between different patient groups. Many healthy control subjects had GLS values similar to those of patients with even advanced aortic stenosis, whereas no GLS threshold appeared to separate patients with established left ventricular decompensation (ie, those with severe symptomatic aortic stenosis) from the rest of the cohort. In the univariate analysis, GLS narrowly failed to reach statistical significance, although the point estimate was similar to recently published data on echocardiographic GLS that was statistically significant (18), which suggests there may be a borderline association that this study was not powered to detect. However, GLS did not perform as well as ejection fraction in the prediction of clinical events in our albeit limited outcome analysis, similar to recent data in the post–ST-segment elevation myocardial infarction population, in which GLS did not add to conventional risk stratification (19). Consequently, although this is not possible to definitively assess using current data, it is hard to envisage how single GLS measurements by cardiac MRI might be used to usefully discriminate between relevant patient groups. Instead, the value of cardiac MRI–derived GLS may lie in repeated measurements to detect subtle changes in left ventricular performance in individual patients over time. This would be readily feasible on the repeat ECGs that are obtained in routine clinical practice and is a subject that requires further analysis and research.
Limitations and Future Directions
This is a single-center, cross-sectional study with a modest number of clinical endpoints limiting multivariable analysis. Although validated for most cardiac MRI techniques, including T1 mapping and late enhancement imaging, we cannot exclude that imaging at 3T may affect the strain quantification. Scanning parameters were identical for all patients, however. Larger longitudinal multicenter studies are now required to assess whether changes in GLS over time may be of greater clinical utility. Our study also lacked speckle-tracking echocardiographic strain data, and conversion of data for strain analysis was not possible, precluding direct comparison with GLS measurements made using this modality. Consequently, we have relied on the results of recent comparative studies (2,3) that demonstrated excellent agreement between the two modalities and on this basis inferred that discussion comparing GLS measurements made by echocardiography and cardiac MRI is valid.
Conclusion
GLS correlates with established markers of left ventricular remodeling and decompensation in the context of aortic stenosis and correlates with established markers of myocardial fibrosis. However, significant overlap between patient groups limits the widespread clinical utility of single GLS measurements, which do not add to prediction of clinical outcomes beyond current established markers. Further studies are necessary to assess whether changes in GLS over time are of greater clinical utility for patients with aortic stenosis.
APPENDIX
Acknowledgments
Acknowledgments
The authors thank Circle Cardiovascular Imaging for use of the strain module of the CVI4.2 software package. No person from the company was involved in image analysis, data collection, or drafting of the manuscript.
Disclosures of Conflicts of Interest: N.B.S. disclosed no relevant relationships. M.G. disclosed no relevant relationships. R.J.E. disclosed no relevant relationships. S.S. Activities related to the present article: disclosed no relevant relationships. Activities not related to the present article: author was a paid consultant for GlaxoSmithKline; institution received grant from GlaxoSmithKline. Other relationships: disclosed no relevant relationships. C.W.L.C. disclosed no relevant relationships. A.C.W. disclosed no relevant relationships. A.G.J. disclosed no relevant relationships. D.E.N. Activities related to the present article: institution receives grant from British Heart Foundation. Activities not related to the present article: disclosed no relevant relationships. Other relationships: disclosed no relevant relationships. M.R.D. Activities related to the present article: institution receives grant from British Heart Foundation. Activities not related to the present article: disclosed no relevant relationships. Other relationships: disclosed no relevant relationships.
D.E.N. and M.R.D. supported by British Heart Foundation (CH/09/002 and FS/14/78/31020). C.W.L.C. supported by the National Research Foundation, Ministry of Health, Singapore. The Edinburgh Imaging Facility (Queen’s Medical Research Institute) is supported by the National Health Service Research Scotland through National Health Service Lothian Health Board.
Abbreviations:
- CI
- confidence interval
- ECG
- electrocardiography
- GLS
- global longitudinal strain
- iECV
- indexed extracellular volume
- LGE
- late gadolinium enhancement
References
- 1.Kalam K, Otahal P, Marwick TH. Prognostic implications of global LV dysfunction: a systematic review and meta-analysis of global longitudinal strain and ejection fraction. Heart 2014;100(21):1673–1680. [DOI] [PubMed] [Google Scholar]
- 2.Onishi T, Saha SK, Delgado-Montero A, et al. Global longitudinal strain and global circumferential strain by speckle-tracking echocardiography and feature-tracking cardiac magnetic resonance imaging: comparison with left ventricular ejection fraction. J Am Soc Echocardiogr 2015;28(5):587–596. [DOI] [PubMed] [Google Scholar]
- 3.Obokata M, Nagata Y, Wu VC-C, et al. Direct comparison of cardiac magnetic resonance feature tracking and 2D/3D echocardiography speckle tracking for evaluation of global left ventricular strain. Eur Heart J Cardiovasc Imaging 2016;17(5):525–532. [DOI] [PubMed] [Google Scholar]
- 4.Motoki H, Borowski AG, Shrestha K, et al. Incremental prognostic value of assessing left ventricular myocardial mechanics in patients with chronic systolic heart failure. J Am Coll Cardiol 2012;60(20):2074–2081. [DOI] [PubMed] [Google Scholar]
- 5.Stanton T, Leano R, Marwick TH. Prediction of all-cause mortality from global longitudinal speckle strain: comparison with ejection fraction and wall motion scoring. Circ Cardiovasc Imaging 2009;2(5):356–364 [DOI] [PubMed] [Google Scholar]
- 6.Hare JL, Brown JK, Marwick TH. Association of myocardial strain with left ventricular geometry and progression of hypertensive heart disease. Am J Cardiol 2008;102(1):87–91 . [DOI] [PubMed] [Google Scholar]
- 7.Chimura M, Onishi T, Tsukishiro Y, et al. Longitudinal strain combined with delayed-enhancement magnetic resonance improves risk stratification in patients with dilated cardiomyopathy. Heart 2017;103(9):679–686. [DOI] [PubMed] [Google Scholar]
- 8.Buss SJ, Emami M, Mereles D, et al. Longitudinal left ventricular function for prediction of survival in systemic light-chain amyloidosis: incremental value compared with clinical and biochemical markers. J Am Coll Cardiol 2012;60(12):1067–1076. [DOI] [PubMed] [Google Scholar]
- 9.Dahl JS, Videbæk L, Poulsen MK, Rudbæk TR, Pellikka PA, Møller JE. Global strain in severe aortic valve stenosis: relation to clinical outcome after aortic valve replacement. Circ Cardiovasc Imaging 2012;5(5):613–620. [DOI] [PubMed] [Google Scholar]
- 10.Hwang JW, Kim SM, Park SJ, et al. Assessment of reverse remodeling predicted by myocardial deformation on tissue tracking in patients with severe aortic stenosis: a cardiovascular magnetic resonance imaging study. J Cardiovasc Magn Reson 2017;19(1):80. [DOI] [PMC free article] [PubMed] [Google Scholar]
- 11.Ozawa K, Funabashi N, Kobayashi Y. Left ventricular myocardial strain gradient using a novel multi-layer transthoracic echocardiography technique positively correlates with severity of aortic stenosis. Int J Cardiol 2016;221:218–226. [DOI] [PubMed] [Google Scholar]
- 12.Vollema EM, Ng ACT, Ajmone Marsan N, Delgado V, Bax JJ. Progression of left ventricular global longitudinal strain in patients with asymptomatic severe aortic stenosis. Eur Heart J 2017;38(suppl_1):P6127. [Google Scholar]
- 13.Chin CWL, Everett RJ, Kwiecinski J, et al. Myocardial Fibrosis and Cardiac Decompensation in Aortic Stenosis. JACC Cardiovasc Imaging 2017;10(11):1320–1333. [DOI] [PMC free article] [PubMed] [Google Scholar]
- 14.Messroghli DR, Greiser A, Fröhlich M, Dietz R, Schulz-Menger J. Optimization and validation of a fully-integrated pulse sequence for modified look-locker inversion-recovery (MOLLI) T1 mapping of the heart. J Magn Reson Imaging 2007;26(4):1081–1086. [DOI] [PubMed] [Google Scholar]
- 15.Messroghli DR, Moon JC, Ferreira VM, et al. Clinical recommendations for cardiovascular magnetic resonance mapping of T1, T2, T2* and extracellular volume: A consensus statement by the Society for Cardiovascular Magnetic Resonance (SCMR) endorsed by the European Association for Cardiovascular Imaging (EACVI). J Cardiovasc Magn Reson 2017;19(1):75 [Published correction appears in J Cardiovasc Magn Reson 2018;20(1):9.]. [DOI] [PMC free article] [PubMed] [Google Scholar]
- 16.Spath NB, Dweck MR, Shah ASV. Statistical Analysis Plan: CMR Longitudinal Strain Analysis in Aortic Stenosis. Edinburgh Research Explorer. https://www.research.ed.ac.uk/portal/en/publications/statistical-analysis-plan-cmr-longitudinal-strain-analysis-in-aortic-stenosis(40f27420-b4b0-4b9b-99e8-47d4d55494fa).html. Published 2017. Accessed February 6, 2019. [Google Scholar]
- 17.Nkomo VT, Gardin JM, Skelton TN, Gottdiener JS, Scott CG, Enriquez-Sarano M. Burden of valvular heart diseases: a population-based study. Lancet 2006;368(9540):1005–1011. [DOI] [PubMed] [Google Scholar]
- 18.Kusunose K, Goodman A, Parikh R, et al. Incremental prognostic value of left ventricular global longitudinal strain in patients with aortic stenosis and preserved ejection fraction. Circ Cardiovasc Imaging 2014;7(6):938–945. [DOI] [PubMed] [Google Scholar]
- 19.Gavara J, Rodriguez-Palomares JF, Valente F, et al. Prognostic Value of Strain by Tissue Tracking Cardiac Magnetic Resonance After ST-Segment Elevation Myocardial Infarction. JACC Cardiovasc Imaging 2018;11(10):1448–1457. [DOI] [PubMed] [Google Scholar]
Associated Data
This section collects any data citations, data availability statements, or supplementary materials included in this article.