

Abstract
Purpose
To evaluate the performance of a deep learning–based algorithm in detecting lung cancers not reported on posteroanterior chest radiographs during routine practice.
Materials and Methods
The retrospective test dataset included 168 posteroanterior chest radiographs acquired between March 2017 and December 2018 (168 patients; mean age, 71.9 years ± 9.5 [standard deviation]; age range, 42–91 years) with 187 lung cancers (mean size, 2.3 cm ± 1.2) undetected during initial clinical evaluation, and 50 normal chest radiographs. CT served as the reference standard for ground truth. Four thoracic radiologists independently reevaluated the chest radiographs for lung nodules both without and with the aid of the algorithm. The performances of the algorithm and the radiologists were evaluated and compared on a per–chest radiograph basis and a per-lesion basis, according to the area under the receiver operating characteristic curve (AUROC) and area under the jackknife free-response ROC curve (AUFROC).
Results
The algorithm showed excellent diagnostic performances both in terms of per-chest radiograph classification (AUROC, 0.899) and per-lesion localization (AUFROC, 0.744); both of these values were significantly higher than those of the radiologists (AUROC, 0.634–0.663; AUFROC, 0.619–0.651; P < .001 for all). The algorithm also demonstrated higher sensitivity (69.6% [117 of 168] vs 47.0% [316 of 672]; P < .001) and specificity (94.0% [47 of 50] vs 78.0% [156 of 200]; P = .01). When assisted by the algorithm, the radiologists’ AUROC (0.634–0.663 vs 0.685–0.724; P < 0.01 for all) and pooled AUFROC (0.636 vs 0.688; P = .03) substantially improved. The false-positive rate of the algorithm, that is, the total number of false-positive nodules divided by the total number of chest radiographs, was similar to that of pooled radiologists (21.1% [46 of 218] vs 19.0% [166 of 872]; P > .05).
Conclusion
A deep learning–based nodule detection algorithm showed excellent detection performance of lung cancers that were not reported on chest radiographs during routine practice and significantly reduced reading errors when used as a second reader.
Supplemental material is available for this article.
© RSNA, 2020
See also commentary by White in this issue.
Summary
A deep learning–based nodule detection algorithm showed excellent performance detecting lung cancers that were undetected at routine posteroanterior chest radiography and reduced the reading errors of thoracic radiologists when used as a second reader.
Key Points
■ The algorithm demonstrated excellent performance concerning both per-radiograph classification (area under the receiver operating characteristic curve [AUROC], 0.899) and per-lesion localization (area under the jackknife alternative free-response receiver operating characteristic curve [AUFROC], 0.744) for chest radiographs in patients with undetected lung cancers. These performances were higher than those of thoracic radiologists (P < .001 for both).
■ A deep learning–based automated nodule detection algorithm showed higher sensitivity (70% [117 of 168]) and specificity (94% [47 of 50]) than those of pooled radiologists (sensitivity, 47% [316 of 672]; specificity, 78% [156 of 200]).
■ Per-radiograph classification (AUROC, 0.634–0.663 to 0.685–0.724) and per-lesion localization performance (AUFROC, 0.636–0.688) of thoracic radiologists significantly improved when aided by the algorithm (P < .03 for all).
Introduction
Chest radiography is the most commonly performed radiologic study, and these images provide an early opportunity to detect both symptomatic and asymptomatic lung cancers (1). However, despite its vast use in routine clinical practice, chest radiography is known to be responsible for 90% of reading errors in lung cancer diagnosis (2), with reported sensitivity of 36%–84% depending on the study population (3,4). Screening using chest radiographs failed to reduce lung cancer–associated mortality in a large randomized controlled clinical trial (5), and CT has become the modality of choice in lung cancer screening. Nevertheless, a substantial number of lung cancers are still incidentally found at chest radiography.
The two main factors of reading errors in chest radiographs are related to nodule appearance and observer performance (6–8). Lesion location is one of the most common factors accountable for missed lung lesions (6,7,9). Posteroanterior chest radiography may limit detection of lung lesions, particularly in apical, hilar, retrocardiac, and retrodiaphragmatic locations (6,7,9). Lesion size or density of nodules may further limit the detection rate (6,7). Observer performance may be negatively affected by the reading environment, observer fatigue, observer experience, and the satisfaction of the search (6–8,10). Regardless of the known limitations, chest radiography is the initial modality of choice for most thoracic diseases in daily clinical practice and is widely used as a screening tool for tuberculosis and lung cancer in various countries, owing to its easy accessibility, readily available x-ray equipment, and low cost compared with CT (11).
Various computer-aided diagnosis (CAD) systems have been developed to limit human errors at interpretation of chest radiography, but they have not been widely adopted in clinical practice owing to their unsatisfactory performance (12). Fortunately, with the advent of deep learning technology and its application on CAD systems, the performance of CAD algorithms on chest radiographs has improved (4,13). A recent study reported that a deep learning–based CAD algorithm performed well in detection of lung nodules in obscured lung areas (4) and, thus, it may improve the radiologist’s performance in detecting undetected lung cancers on chest radiographs. We evaluated the performance of a deep learning–based algorithm in detecting lung cancer initially not reported at chest radiography during routine practice.
Materials and Methods
For our retrospective study, ethics review and institutional review board approval were obtained from Seoul National University Hospital, and the requirement for patients’ informed consent was waived.
Study Participants and Reference Standards
Patients with pathologically confirmed lung cancers at percutaneous lung biopsy between March 2017 and December 2018 at our institution were retrospectively collected (n = 1034). Of these, patients without chest radiographs with posteroanterior projections or with radiographs only acquired before biopsy (n = 33) were excluded. Of 1001 patients with chest radiographs acquired before biopsy procedures, the presence of a lung cancer nodule or mass (afterward described as nodule) was appropriately reported in 861 patients; however, pulmonary lesions representing lung cancers were not reported in the remaining 140 patients. Among the 861 patients whose nodules were reported, 28 patients had previous chest radiographs, in which the corresponding lung cancer nodules were visible but were not reported at initial clinical interpretation. These patients were also included in the study population. For the 168 patients with initially undetected lung lesions, all patients underwent CT scanning before biopsy (median interval, 14 days [interquartile range, 7–26 days]). The ground truth was based on CT and/or reevaluation of chest radiography in these 168 patients, because they were part of the final test set. The median interval between the corresponding chest radiograph and the latest CT scan was 15 days (interquartile range, 3–38 days). Two thoracic radiologists (J.G.N. and C.M.P., with 5 and 17 years of experience, respectively) retrospectively reviewed all chest radiographs in consensus and annotated all positive lesions (confirmed lung cancer with or without multiple nodules) on the basis of the corresponding CT scan and follow-up chest radiographs. Nodules smaller than 5 mm were not included in this study.
A total of 187 lung nodules in 168 patients (mean age, 71.9 years ± 9.5 [standard deviation]; age range, 42–91 years), including 112 men (mean age, 73.6 years ± 8.1) and 56 women (mean age, 68.5 years ± 11.0) were reported, and the size of each nodule was measured either on CT scans obtained within 30 days (n = 134) or on chest radiographs (n = 53) when there were no available CT scans obtained within 30 days. Afterward, the conspicuity of each lung cancer lesion on chest radiographs was determined by two thoracic radiologists (J.G.N. and C.M.P.) in consensus using a five-point scale: 0 (invisible), 1 (visible but with less than a 50% confidence, even with CT review), 2 (50%–70% confidence at retrospective focused evaluation), 3 (possibly neglected but a true nodule on retrospective focused evaluation), and 4 (visible at initial view) (4) (Fig E1 [supplement]). The pathologic diagnosis of 187 lung lesions on the basis of chest radiography in the 168 selected patients revealed 127 adenocarcinomas, 34 squamous cell carcinomas, and seven small cell lung cancers. In addition, we selected consecutive normal chest radiographs from 50 patients as the control group and part of the final tests that were performed in January 2019 and confirmed with same-day CT scans to have no pulmonary nodules. Details are summarized in Figure 1. The manufacturer and technical information of the chest radiographs are listed in Table E1 (supplement).
Figure 1:

Flow diagram for our study design. EMR = electronic medical record, exam = examination.
Among the 218 patients with 187 nodules included in this study, 58 nodules were categorized as 0 or 1 (< 50% confidence). As a subgroup analysis, after exclusion of these 58 nodules, we conducted additional analysis on the 129 lung cancer nodules apparent on chest radiographs but that were overlooked during routine clinical practice (Appendix E1 [supplement]) (10,14).
Evaluation of the Performance of the Deep Learning Algorithm
A commercially available deep learning–based algorithm (Lunit INSIGHT CXR, version 1.0.1.1; Lunit, Seoul, Korea) was used. This algorithm was trained using 43 292 chest radiographs consisting of 34 067 normal chest radiographs and 9225 chest radiographs with malignant pulmonary nodules in a combined fully supervised and weakly supervised manner (4). A deep convolutional neural network with 25 layers and eight residual connections was designed, and the outputs of three networks trained with different hyperparameters were averaged (4). A detailed description of the algorithm and its performance has been previously reported (4). The algorithm provided both a per-radiograph probability value between 0 and 1 for each chest radiograph to have lung nodules, and a per-pixel localization map overlaid on the input chest radiographs identifying the locations of the lung nodules (activation values between 0 and 1). The performance of the algorithm was evaluated to detect nodules (per-radiograph classification) and to localize lung nodules (per-lesion localization). For the binary classification of positive and negative results, we adopted a manufacturer recommended cutoff value of 0.15, both in terms of per-radiograph classification and per-lesion localization.
Reader Performance Test
To compare the performance of the deep learning–based algorithm with that of radiologists and to evaluate whether the algorithm can improve radiologists’ detection performance, a reader performance test was conducted by four thoracic radiologists (E.J.H., D.S.K., S.J.Y., H.C., with 9, 6, 6, and 5 years of experience, respectively) who did not participate in dataset curation with randomly rearranged 187 chest radiographs. Readers were aware of the characteristics of the dataset, but they were not aware of the proportion of positive to negative cases. In test 1, each reader independently reviewed each chest radiograph to determine whether the radiograph had nodules or not (per-radiograph classification) and subsequently localized all lung nodules (per-lesion localization) on a five-point confidence scale: 1 (potential lesion, low degree of suspicion), 2 (dubious lesions), 3 (possible lesion, more than 50% confidence), 4 (probable lesion, with high confidence; and 5, definite lesion (4). After finishing test 1, each reader was allowed to start test 2. In test 2, each reader reviewed the results of the algorithm and his or her initial decision, and then modified the decision on the presence of the nodule or rescored their confidence level from test 1. The results of the algorithm were shown as color-coded activation maps, in which areas with activation value greater than 0.15 were color coded, with red representing higher probability and blue representing lower probability. During the test, each reader was able to adjust the window width and level, magnify the image, or invert the images. Lesions were marked by drawing a circle around the suspected lesion (Fig E2a [supplement]). The nodule was primarily regarded as a true-positive result if there was a cross-section between the true lesion and users’ marked lesion; otherwise, it was considered a false-positive result. Afterward, one radiologist (J.G.N.) reviewed all cases and corrected the falsely marked lesions. All tests were conducted using picture archiving and communication system monitors. A custom web-based image review application on a Python Django framework (https://www.djangoproject.com; public domain) was built using cornerstone.js (https://github.com/chafey/cornerstone; open source) and MariaDB (https://mariadb.org; public domain) to provide a smooth workflow. An example is presented in Figure E2 (supplement).
Statistical Analysis
The performance of the deep learning–based algorithm and those of the human readers were evaluated using the area under the receiver operating characteristic (ROC) curve (AUROC) for per-radiograph classification and the area under the jackknife free-response ROC curve (AUFROC), defined as the probability that true lesions are rated higher than nonlesion marks on normal chest radiographs (15), for per-lesion localization. The per-radiograph classification and per-lesion localization performance of the algorithm, the readers (test 1), and readers aided by the algorithm (test 2), were compared using pairwise comparison ROC curve analysis (16) and jackknife alternative free-response ROC (JAFROC) analysis, respectively. For JAFROC analysis, the random-case fixed reader method was used for individual reader comparison, and the random case, random reader method was used for group-averaged comparison (17). Detailed analyses were performed according to the conspicuity, size, and location of the lesions, including the area obscured by overlapping structures (retrocardiac, retrodiaphragmatic, hilar, apical, or others). For comparison of per-lesion and per-radiograph sensitivity and specificity for the pooled radiologists and the algorithm, generalized estimating equations based on binary logistic regression and an exchangeable correlation matrix were used. The false-positive rate, that is, the total number of false-positive nodules divided by the total number of chest radiographs, of the algorithm and the readers were compared using the Wilcoxon signed rank test. ROC analysis was performed using MedCalc statistical software version 15.8 (MedCalc Software, Ostend, Belgium), and the Dorfman-Berbaum-Metz model was applied using JAFROC version 4.2.1 (http://www.devchakraborty.com/). Other statistical analyses were performed using SPSS software version 25 (IBM, Chicago, Ill). For all tests, P values less than .05 indicated statistical significance, and P values were multiplied by 2, following the Bonferroni method (18).
Results
Characteristics of Nodules
Median size of the 187 lung cancers was 2.2 cm (range, 0.7–8.2 cm), and 72% (135 of 187) of them were 1.1–3.0 cm. Fifty-five percent (103 of 187) of the lung cancers were located at one of the obscured areas on chest radiographs (retrocardiac, retrodiaphragmatic, hilar, apical, or others) (Table 1). Nodules of conspicuity category 3, initially undetected, but visible at retrospective evaluation, were seen most frequently (60 of 187 [32%]). Twenty of the 187 lung cancers (11%) were categorized as conspicuity level 4, visible at initial view.
Table 1:
Summary of Nodule Characteristics Used in the Reader Performance Test

Performances Analysis
In terms of per-radiograph classification of performance, the AUROC of the algorithm was 0.899, which was significantly higher than the AUROC of all four human readers (range, 0.634–0.663; P < .001 for all) (Table 2; Fig E3 [supplement]). When aided by the algorithm, the performance of all four readers significantly improved (AUROC range, 0.685–0.724; P < .01 for all) (Table 2 and Fig E3 [supplement]).The algorithm showed significantly higher sensitivity (70% [117 of 168]) and specificity (94% [47 of 50]) than did pooled readers (sensitivity, 47% [316 of 672]; specificity, 78% [156 of 200]; P < .001 and P = .01, respectively). When aided by the algorithm (test 2), the sensitivity (53% [357 of 672]) and specificity (82% [164 of 200]) of readers significantly increased (P < .001 and P < .01, respectively).
Table 2:
Per-Radiograph Classification and Per-Lesion Localization Performances on the Reader Performance Test

In terms of per-lesion localization performance, the AUFROC of the algorithm was 0.744, which was significantly higher than that of all four human readers (range, 0.619–0.651; P < .01 for all) on JAFROC analysis. Pooled AUFROC of the readers was 0.636, which was significantly lower than that of the algorithm (corrected P < .001) (Table 2). On test 2, all four readers improved their AUFROC, and the pooled AUFROC showed a significant increase, from 0.636 to 0.688 (corrected P = .03) (Fig E4 [supplement]).
The algorithm detected of 54% (101 of 187) of the nodules, while pooled readers detected 44% (327 of 748) of the nodules (P < .001) (Tables 3, 4). When assisted by the algorithm, pooled readers detected 45 more nodules (50% [372 of 748]; P < .001) (Table 4). The false-positive rate of the algorithm was similar to that of the pooled radiologists (21% [46 of 218] vs 19% [166 of 872]; P > .05) (Table 3). The false-positive rate remained similar on test 2 (19% [169 of 872]; P > .05) compared with test 1 (19% [166 of 872]).
Table 3:
Summary of the Detection Performance of the Algorithm and the Thoracic Radiologists

Table 4:
Percentage of Detected Nodules by the Algorithm and by Readers, according to Nodule Characteristics

Performance analysis according to nodule conspicuity and size.—The algorithm performed better than readers for nodules of conspicuity category 3. Among 60 nodules of conspicuity level 3, the algorithm detected 93% (56 of 60) of all nodules, while pooled readers detected 70% (169 of 240) of them. When assisted by the algorithm, readers detected 11% (26 of 240) more nodules (Table 4). In terms of nodule size, the readers tended to detect more nodules when they were larger, but the algorithm maintained relatively consistent detection rates (Table 4). Of the nodules measuring 1.0 cm or smaller, the algorithm detected 45% (5 of 11) of the nodules, while pooled readers found 25% (11 of 44). However, readers mostly did not accept the algorithm’s results and detected only two more nodules for the nodules measuring 1.0 cm or smaller on test 2. Pooled readers showed the highest acceptance rate of the algorithm’s results for the nodules measuring 2.1–3.0 cm; they detected 10% more nodules (21 of 208) on test 2 (Table 4).
Performance analysis for apparent nodules.—After excluding the 58 nodules of conspicuity category 0–1, the radiologists detected 51% (59 of 115) to 75% (86 of 115) of the nodules (pooled sensitivity, 63% [288 of 460]), while the algorithm detected 87% (100 of 115) of them. The algorithm performed better than the readers on the per-radiograph classification (AUROC, 0.957 vs 0.707–0.768) and per-lesion localization (AUFROC, 0.880 vs 0.718) (Appendix E1 and Table E2 [supplement]).
Performance analysis for nodules obscured by overlapping structures.—For 103 nodules obscured by the overlapping structures, the algorithm detected 45% (46 of 103) of the nodules, while pooled readers detected 35% (146 of 412) of them. The algorithm showed a higher detection rate than readers for obscured nodules, especially for those located in the hilar (61% [17 of 28] vs 45% [50 of 112]) or apical (47% [eight of 17] vs 31% [21 of 68]) areas (Table 4). Pooled readers successfully detected more than 10% more nodules when assisted with the algorithm for the hilar and apical nodules, but they did not show increased detection rate for retrodiaphragmatic nodules (Table 4). Examples of nodules obscured by overlapping structures are presented in Figures 2 and 3
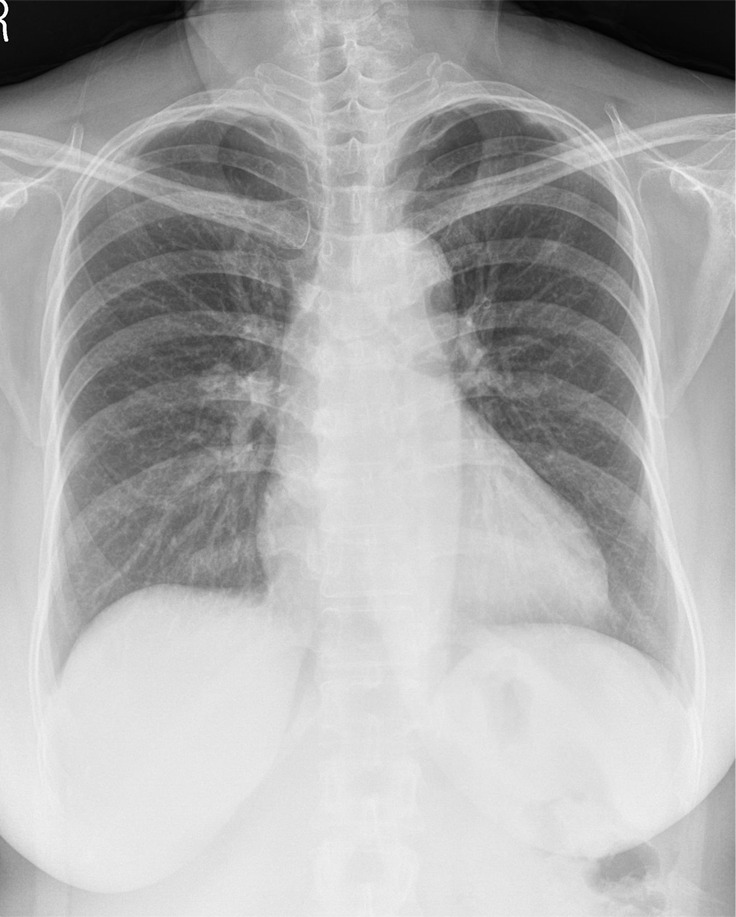
Figure 2a:
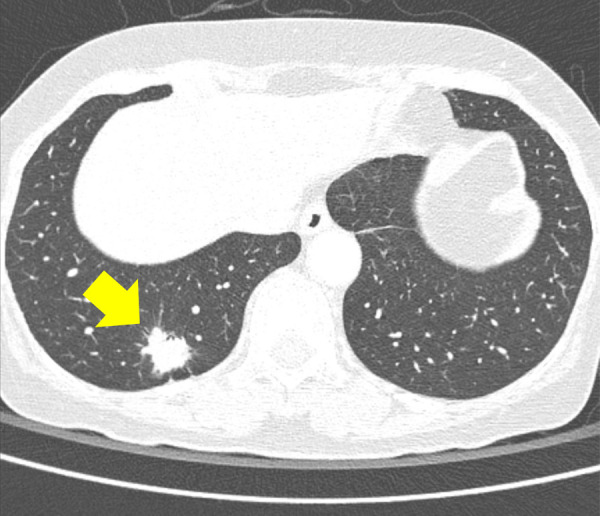
(a) A 64-year-old woman with confirmed lung adenocarcinoma at the right lower lobe (arrow). (b) The lesion, located at the right retrodiaphragmatic area, was missed during routine clinical practice. (c) In the reader performance test, none of the thoracic radiologists detected the lesion. The algorithm successfully localized the lesion (light blue shaded area) with a probability score of 0.16.
Figure 3a:

(a) A 57-year-old woman with confirmed lung adenocarcinoma at the right lower lobe (arrow). (b) The lesion, located at the right hilar area, was missed during routine clinical practice. (c) In the reader performance test, all thoracic radiologists detected the lesion. The algorithm also successfully localized the lesion (green shaded area), with a probability score of 0.47.
Figure 2b:

(a) A 64-year-old woman with confirmed lung adenocarcinoma at the right lower lobe (arrow). (b) The lesion, located at the right retrodiaphragmatic area, was missed during routine clinical practice. (c) In the reader performance test, none of the thoracic radiologists detected the lesion. The algorithm successfully localized the lesion (light blue shaded area) with a probability score of 0.16.
Figure 2c:

(a) A 64-year-old woman with confirmed lung adenocarcinoma at the right lower lobe (arrow). (b) The lesion, located at the right retrodiaphragmatic area, was missed during routine clinical practice. (c) In the reader performance test, none of the thoracic radiologists detected the lesion. The algorithm successfully localized the lesion (light blue shaded area) with a probability score of 0.16.
Figure 3b:
(a) A 57-year-old woman with confirmed lung adenocarcinoma at the right lower lobe (arrow). (b) The lesion, located at the right hilar area, was missed during routine clinical practice. (c) In the reader performance test, all thoracic radiologists detected the lesion. The algorithm also successfully localized the lesion (green shaded area), with a probability score of 0.47.
Figure 3c:

(a) A 57-year-old woman with confirmed lung adenocarcinoma at the right lower lobe (arrow). (b) The lesion, located at the right hilar area, was missed during routine clinical practice. (c) In the reader performance test, all thoracic radiologists detected the lesion. The algorithm also successfully localized the lesion (green shaded area), with a probability score of 0.47.
Characteristics of the ignored and accepted nodules by the readers.—The characteristics of the nodules that were ignored by readers but detected by the algorithm (n = 41) and those that were accepted by readers (n = 34) were compared. No statistical significance was found, but the ignored group, compared with the accepted group, had more nodules located below the left bronchus bifurcation level (51% [21 of 41] vs 32% [11 of 34]) and at the retrocardiac and retrodiaphragmatic areas (29% [12 of 41] vs 18% [six of 34]). The median size of the ignored nodules and accepted nodules was 1.7 cm and 2.3 cm, respectively (P > .05) (Table E3 [supplement]).
Discussion
In our study, a deep learning–based algorithm showed excellent performance for detecting lung cancers that initially went undetected at posteroanterior chest radiography and significantly improved the diagnostic performance of radiologists when used as a second reader, both in terms of per-radiograph classification and per-lesion localization. Unlike previously reported CAD systems shown to yield frequent false-positive interpretations (3,9,10,12,19), the system showed significantly higher specificity than that of the pooled radiologists (94% vs 78%; P = .01). The sensitivity and specificity demonstrated by the radiologists was significantly improved when they were aided by the algorithm (P < .001 and P < .01, respectively).
Reading errors on chest radiographs concerning lung cancers are a well-recognized study topic in lung cancer screening and diagnosis (6,7,9,10). In concordance with data from previous studies, 58% of the nodules were located in the upper lung zone (above the bifurcation of the left main bronchus), 55% were obscured by overlapping structures, and nodules measuring 1.1–3.0 cm in size were dominant (accounting for 72% of the nodules; median size, 2.2 cm) (7,10,20,21). Retrospective analysis showed nodules of conspicuity category 3, defined as possibly neglected lesions but true on focused retrospective evaluation, to be most frequent (32.1%).
Various strategies have been proposed to reduce reading errors, including careful comparison with existing radiographs and double reading (10,22); however, often these are not feasible in routine practice. It is encouraging that the algorithm showed good sensitivity that was higher than that of the thoracic radiologists (69.6% vs 47.0%; P < .001) as well as higher specificity (94.0% vs 78.0%; P = .01). The algorithm yielded three false-positive radiographs.
Concerning performance analysis based on nodule conspicuity, the algorithm showed good results for moderately visible nodules (those with conspicuity category 3), although it showed a detection rate similar to that of the radiologists for poorly visualized nodules. In terms of the nodule size, the algorithm showed consistent detection rates (70%–80%) throughout nodule sizes; radiologists were likely to detect larger nodules. This implies that the algorithm identifies all recognized nodules, while radiologists are hesitant to identify small nodules. The improvement in performance on test 2 was also limited for nodules measuring 2.0 cm or smaller compared with nodules measuring 2.1–3.0 cm. In concordance with a previous study (4), the algorithm showed good performance in detecting nodules located in the apical or hilar area (detection rate, 47% and 61%, respectively), which were challenging for human experts (pooled detection rate, 31% and 45%, respectively). While a previous study evaluating a primitive form of the algorithm suggested its weakness in localizing retrodiaphragmatic nodules (4), in this study, the algorithm was comparable to the radiologists in detecting them (21% vs 22%). These results suggest that this algorithm has potential to improve the detection rate of lung cancers that prove challenging to radiologists. However, the algorithm did not detect any invisible nodules (category 0) in our study. Considering the natural limitations of radiography, it is unrealistic that the algorithm may exceed the performance of CT in detecting lung nodules.
Interestingly, the readers’ performance (AUROC [range, 0.634–0.663] and pooled AUFROC [0.636] in test 2) could not reach that of the algorithm (AUROC [0.899] and AUFROC [0.744]), although the radiologists’ performance improved significantly when aided by the algorithm. Specifically, retrocardiac and retrodiaphragmatic nodules were likely to be missed by the readers. Also, readers neglected more true nodules at lower lung fields, regarding them as nipple or vascular shadow. Because the algorithm takes pixel values of the image, it may recognize abnormalities in areas of soft-tissue density better than do human readers. In addition, readers accepted larger nodules and showed limited acceptance rate for subcentimeter nodules (Table 2).
Our study had some limitations. First, owing to its retrospective nature, there was selection bias. Because we only included cases confirmed by percutaneous needle biopsy, only a certain portion of patients with cancer was included. Nodule measurements were not consistent because of the nature of the cohort. Second, we used a single chest radiograph to test reader performance, which might not reflect real-life reading, in which a radiologist compares previous chest radiographs. Also, the cohort was constructed by selection and inclusion criteria and the readers were aware of characteristics of the cohort. Furthermore, the human readers had variable experience and training in using the algorithm. Third, we only studied chest radiographs using posteroanterior projections, because lateral or bone-suppression images are not routinely used in our institution. Overall, the selection bias, unblinded observers, variable training experience of observers, and the use of only posteroanterior chest radiographs may have artificially enhanced the performance of the algorithm. Fourth, we only evaluated a single commercially available deep learning–based algorithm. Finally, we only evaluated the potential role of the algorithm in one specific retrospectively collected diagnostic cohort consisting of patients with initially negatively read chest radiographs from those in whom lung cancer was later diagnosed. Further prospective studies are required to test the effectiveness of the algorithm in screening or in a diagnostic setting for lung cancers.
In conclusion, a deep learning–based nodule detection algorithm showed excellent performance in detecting lung cancers initially missed on chest radiographs and significantly reduced the reading errors of thoracic radiologists when used as a second reader.
APPENDIX
SUPPLEMENTAL FIGURES
Disclosures of Conflicts of Interest: J.G.N. disclosed no relevant relationships. E.J.H. disclosed no relevant relationships. D.S.K. disclosed no relevant relationships. S.J.Y. disclosed no relevant relationships. H.C. disclosed no relevant relationships. J.M.G. Activities related to the present article: disclosed no relevant relationships. Activities not related to the present article: grants/grants pending from Dongkook Lifescience and Infinnitt Healthcare. Other relationships: disclosed no relevant relationships. C.M.P. Activities related to the present article: disclosed no relevant relationships. Activities not related to the present article: grant from Lunit. Other relationships: disclosed no relevant relationships.
Supported by the Seoul Research and Business Development Program (grant FI170002).
Abbreviations:
- AUFROC
- area under the jackknife free-response ROC curve
- AUROC
- area under the ROC curve
- CAD
- computer-aided diagnosis
- JAFROC
- jackknife alternative free-response ROC curve
- ROC
- receiver operating characteristic
References
- 1.Pass H, Ball D, Scagliotti G. IASLC Thoracic Oncology. 2nd ed. Philadelphia, Pa: Elsevier, 2017. [Google Scholar]
- 2.Del Ciello A, Franchi P, Contegiacomo A, Cicchetti G, Bonomo L, Larici AR. Missed lung cancer: when, where, and why? Diagn Interv Radiol 2017;23(2):118–126. [DOI] [PMC free article] [PubMed] [Google Scholar]
- 3.de Hoop B, De Boo DW, Gietema HA, et al. Computer-aided detection of lung cancer on chest radiographs: effect on observer performance. Radiology 2010;257(2):532–540. [DOI] [PubMed] [Google Scholar]
- 4.Nam JG, Park S, Hwang EJ, et al. Development and validation of deep learning–based automatic detection algorithm for malignant pulmonary nodules on chest radiographs. Radiology 2019;290(1):218–228. [DOI] [PubMed] [Google Scholar]
- 5.Oken MM, Hocking WG, Kvale PA, et al. Screening by chest radiograph and lung cancer mortality: the Prostate, Lung, Colorectal, and Ovarian (PLCO) randomized trial. JAMA 2011;306(17):1865–1873. [DOI] [PubMed] [Google Scholar]
- 6.de Groot PM, Carter BW, Abbott GF, Wu CC. Pitfalls in chest radiographic interpretation: blind spots. Semin Roentgenol 2015;50(3):197–209. [DOI] [PubMed] [Google Scholar]
- 7.Hossain R, Wu CC, de Groot PM, Carter BW, Gilman MD, Abbott GF. Missed Lung Cancer. Radiol Clin North Am 2018;56(3):365–375. [DOI] [PubMed] [Google Scholar]
- 8.Manning DJ, Ethell SC, Donovan T. Detection or decision errors? Missed lung cancer from the posteroanterior chest radiograph. Br J Radiol 2004;77(915):231–235. [DOI] [PubMed] [Google Scholar]
- 9.Schalekamp S, van Ginneken B, Koedam E, et al. Computer-aided detection improves detection of pulmonary nodules in chest radiographs beyond the support by bone-suppressed images. Radiology 2014;272(1):252–261. [DOI] [PubMed] [Google Scholar]
- 10.White CS, Flukinger T, Jeudy J, Chen JJ. Use of a computer-aided detection system to detect missed lung cancer at chest radiography. Radiology 2009;252(1):273–281. [DOI] [PubMed] [Google Scholar]
- 11.Bach PB, Mirkin JN, Oliver TK, et al. Benefits and harms of CT screening for lung cancer: a systematic review. JAMA 2012;307(22):2418–2429 [Published corrections appear in JAMA 2012;308(13):1324 and JAMA 2013;309(21):2212.]. [DOI] [PMC free article] [PubMed] [Google Scholar]
- 12.Schalekamp S, van Ginneken B, Karssemeijer N, Schaefer-Prokop CM. Chest radiography: new technological developments and their applications. Semin Respir Crit Care Med 2014;35(1):3–16. [DOI] [PubMed] [Google Scholar]
- 13.Hwang EJ, Park S, Jin KN, et al. Development and Validation of a Deep Learning-Based Automated Detection Algorithm for Major Thoracic Diseases on Chest Radiographs. JAMA Netw Open 2019;2(3):e191095 [Published correction appears in JAMA Netw Open 2019;2(4):e193260.]. [DOI] [PMC free article] [PubMed] [Google Scholar]
- 14.Li F, Engelmann R, Metz CE, Doi K, MacMahon H. Lung cancers missed on chest radiographs: results obtained with a commercial computer-aided detection program. Radiology 2008;246(1):273–280. [DOI] [PubMed] [Google Scholar]
- 15.Chakraborty DP. Recent developments in imaging system assessment methodology, FROC analysis and the search model. Nucl Instrum Methods Phys Res A 2011;648(Supplement 1):S297–S301. [DOI] [PMC free article] [PubMed] [Google Scholar]
- 16.DeLong ER, DeLong DM, Clarke-Pearson DL. Comparing the areas under two or more correlated receiver operating characteristic curves: a nonparametric approach. Biometrics 1988;44(3):837–845. [PubMed] [Google Scholar]
- 17.Fletcher JG, Yu L, Li Z, et al. Observer performance in the detection and classification of malignant hepatic nodules and masses with CT image-space denoising and iterative reconstruction. Radiology 2015;276(2):465–478. [DOI] [PMC free article] [PubMed] [Google Scholar]
- 18.Bland JM, Altman DG. Multiple significance tests: the Bonferroni method. BMJ 1995;310(6973):170. [DOI] [PMC free article] [PubMed] [Google Scholar]
- 19.De Boo DW, Prokop M, Uffmann M, van Ginneken B, Schaefer-Prokop CM. Computer-aided detection (CAD) of lung nodules and small tumours on chest radiographs. Eur J Radiol 2009;72(2):218–225. [DOI] [PubMed] [Google Scholar]
- 20.Quekel LG, Kessels AG, Goei R, van Engelshoven JM. Miss rate of lung cancer on the chest radiograph in clinical practice. Chest 1999;115(3):720–724. [DOI] [PubMed] [Google Scholar]
- 21.Shah PK, Austin JH, White CS, et al. Missed non-small cell lung cancer: radiographic findings of potentially resectable lesions evident only in retrospect. Radiology 2003;226(1):235–241. [DOI] [PubMed] [Google Scholar]
- 22.White CS, Salis AI, Meyer CA. Missed lung cancer on chest radiography and computed tomography: imaging and medicolegal issues. J Thorac Imaging 1999;14(1):63–68. [DOI] [PubMed] [Google Scholar]
Associated Data
This section collects any data citations, data availability statements, or supplementary materials included in this article.