

Abstract
Purpose
To evaluate three-dimensional (3D) ultrashort echo time (UTE) MRI regarding image quality and suitability for functional image analysis using gradient-echo sequences in breath-hold and with self-navigation.
Materials and Methods
In this prospective exploratory study, 10 patients (mean age, 21 years; age range, 5–58 years; five men) and 10 healthy control participants (mean age, 25 years; age range, 10–39 years; five men) underwent 3D UTE MRI at 3.0 T. Imaging was performed with a prototypical stack-of-spirals 3D UTE sequence during single breath holds (echo time [TE], 0.05 msec) and with a self-navigated “Koosh ball” 3D UTE sequence at free breathing (TE, 0.03 msec). Image quality was rated on a four-point Likert scale. Edge sharpness was calculated. After semiautomated segmentation, fractional ventilation was calculated from MRI signal intensity (FVSI) and volume change (FVVol). The air volume fraction (AVF) was estimated from relative signal intensity (aortic blood signal intensity was used as a reference). Means were compared between techniques and participants. The Wilcoxon signed rank test and Spearman rank correlation were used for statistical analyses.
Results
Image quality ratings were equal for both techniques. However, stack-of-spirals breath-hold UTE was more susceptible to motion and aliasing artifacts. Mean FVSI was higher during breath hold than at free breathing (mean ± standard deviation in milliliters of gas per milliliters of parenchyma, 0.17 mL/mL ± 0.06 [minimum, 0.07; maximum, 0.34] vs 0.11 mL/mL ± 0.03 [minimum, 0.06; maximum, 0.17], P = .016). Mean FVSI and FVVol were in good agreement (mean difference: at breath hold, −0.008 [95% confidence interval {CI}: 0.007, −0.024]; ρ = 0.97 vs free breathing, −0.004 [95% CI: 0.007, −0.016]; ρ = 0.91). AVF correlated between both techniques (ρ = 0.94).
Conclusion
Breath-hold and self-navigated 3D UTE sequences yield proton density–weighted images of the lungs that are similar in quality, and both techniques are suitable for functional image analysis.
Supplemental material is available for this article.
© RSNA, 2020
Summary
Three-dimensional ultrashort echo time gradient-echo sequences are promising tools for acquisition of proton density–weighted lung MR images within a single breath hold or at free breathing, providing high spatial resolution and allowing for functional image analysis such as ventilation or air volume fraction.
Key Points
■ Performing imaging during breath-hold and self-navigated ultrashort echo time (UTE) at free breathing yields similar image quality; self-navigated UTE showed high robustness to motion artifacts, which occurred at breath-hold imaging owing to involuntary relaxation and insufficient breath hold.
■ Data from both acquisition during breath hold and at free breathing are suitable for the assessment of fractional ventilation (FV).
■ Mean FV as a global parameter for the whole lung is dependent on breathing depth; in contrast, the assessment of regional FV with corresponding color-coded FV maps appears more robust in detecting ventilation deficits.
Introduction
MRI of the lungs is technically challenging because of physical limitations such as inherently low proton density and intrinsically short T2* relaxation times, resulting in a low signal-to-noise ratio. Ultrashort echo time (UTE) sequences address these limitations with a minimized echo time (TE) (< 100 µsec) to accomplish the readout shortly after excitation (1–5).
Two three-dimensional (3D) UTE gradient-echo sequences have been proposed that allow for full 3D coverage of the lungs. Using a stack-of-spirals trajectory (6), Mugler et al introduced fast image acquisition within a single breath hold (7). Another approach, by Mendes Pereira et al (10), implemented a “Koosh ball” (a toy ball made of rubber filaments radiating from its center) trajectory (8,9) to a self-navigated 3D UTE sequence. Here, sampling of the k-space center signal (direct current [DC] signal) during each readout allows for k-space separation into different breathing states (11–13), enabling free-breathing imaging within a few minutes.
Recently, two studies explored functional lung imaging with UTE MRI, providing images with proton density–weighted contrast, high signal-to-noise ratio, and high spatial resolution, as well as simultaneous functional information (10,14). However, the literature regarding 3D UTE MRI is sparse, and the effect of different breathing maneuvers on functional image analyses has not been sufficiently investigated. Our hypothesis was that functional image analysis of the lung can be performed similarly when performing UTE sequences at single breath-hold and at free-breathing acquisition.
Therefore, the purpose of this study was to compare a 3D stack-of-spirals UTE sequence during breath hold and a self-navigated Koosh ball UTE sequence at free breathing to discern image quality and suitability for functional image analysis, such as fractional ventilation (FV) in patients with pulmonary disease.
Materials and Methods
Institutional Review
This study was approved by our institutional review board. Written informed consent was obtained from all participants or their legal guardians prior to the examinations.
Study Population
Fourteen consecutive patients with pulmonary disease were enrolled in this prospective single-center study. Of the initial 14 patients, two were excluded because of withdrawal prior to MRI. Two more patients were excluded because MRI was interrupted before the examination was completed. Between May 2018 and August 2019, 3D UTE MRI was performed successfully in 10 patients (mean age, 21 years; range, 5–58 years; five men) with pulmonary disease (cystic fibrosis, six; congenital emphysema, one; lung cancer, one; graft-versus-host disease, one; α1-antitrypsine deficiency, one) and 10 healthy control participants (mean age, 25 years; range, 10–39 years; five men). Inpatients and outpatients at the University Hospital Würzburg were included. Inclusion criteria for the patient group were findings of pulmonary disease at functional lung testing (ie, cystic fibrosis, α1-antitrypsine deficiency) or on CT images (ie, lung cancer, graft-versus-host disease) and the ability for independent breath holds. Exclusion criteria for the patient group were any contraindications to MRI. Control participants were nonsmokers and had no respiratory symptoms. Exclusion criteria for control participants were any known acute or chronic bronchopulmonary disease and any contraindications to MRI.
MRI Protocol
Lung MRI was performed with a 3.0-T MRI scanner (Magnetom Prisma; Siemens Healthcare, Erlangen, Germany) equipped with an 18-channel body and 32-channel spine coils.
Breath-hold technique.—Breath-hold imaging was performed with a prototypical UTE sequence employing a 3D stack-of-spirals trajectory (7) (work in progress package, provided by Siemens Healthcare; no control over study data by T.B. and J.P.). Sequence parameters were as follows: TE, 0.05 msec; repetition time, 2.35 msec; flip angle, 5°; in-plane resolution, 2.3 mm × 2.3 mm; slice thickness, 2.3 mm; and acquisition time per breathing state, 12.9 seconds ± 1.7. Details about the sequence parameters are provided in Table E1 (supplement). Aliasing was minimized by an extensively large field of view, individual coil selection, and acquisition in coronal orientation. Five separate breath-hold images were obtained, reflecting the residual volume (deep expiration), tidal volume (normal inspiration, normal expiration, intermediate), and total lung capacity (deep inspiration). Breathing maneuvers were trained prior to the examination. Manual voice commands were given through headphones.
Free-breathing technique.—A self-navigated (DC-gated) 3D UTE sequence with a Koosh ball trajectory (8,9) was performed at free breathing (10). Sequence parameters were as follows: TE, 0.03 msec; repetition time, 1.49 msec; flip angle, 2°; and total acquisition time, 8.7 minutes. According to the DC signal, data were binned into eight breathing states to achieve the necessary sampling density, and the k-space was separated into individual k-spaces (10–12).
Qualitative Assessment of Proton Density–weighted Images
Image sets of inspiration and expiration were reviewed separately by three radiologists (S.V., J.F.H., C.M.), with 7, 3, and 2 years of experience, respectively, according to a four-point Likert scale, as follows: depiction of pulmonary vasculature (1, main trunk; 2, lobar; 3, segmental branch; 4, subsegmental branch); airways (1, main trunk; 2, lobar; 3, segmental branch; 4, subsegmental branch); artifact severity (1, severe, nondiagnostic; 2, moderate, pathology might be masked; 3, slight, no effect on diagnosis; 4, no artifacts); and overall image quality (1, nondiagnostic; 2, acceptable; 3, good; 4, very good).
To assess the edge sharpness, a signal intensity (SI) profile was derived from image data at the lung-diaphragm interface (Fig 1a). After normalization, the mean slope of the signal change (from lung tissue to diaphragm and liver) between 25% and 75% was calculated. Edge sharpness is indicated as SI change per voxel (SI/voxel).
Figure 1a:
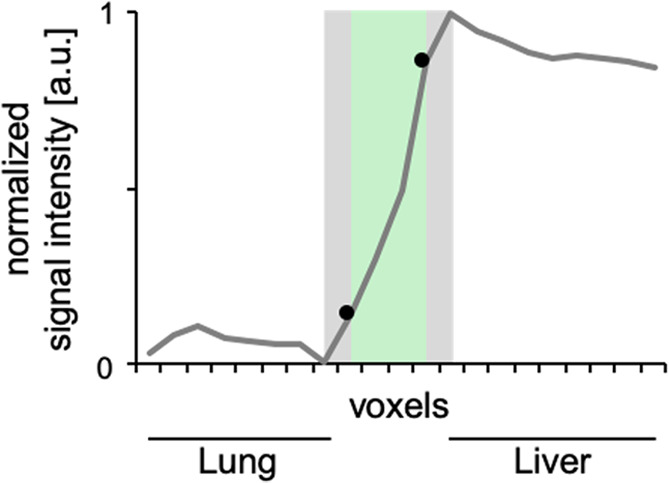
Edge sharpness as an objective criterion for image evaluation. (a) A signal intensity profile in the z-axis was derived at the right diaphragm. After normalization, the mean slope of the signal change between 25% and 75% (black dots) was calculated. (b) Edge sharpness was significantly higher during breath-hold acquisition in expiration. Data are expressed per participant with corresponding mean (dotted line). a.u. = arbitrary units.
Postprocessing
Fractional ventilation.—Lungs were segmented semiautomatically by using a supervised region-growing algorithm and, when necessary, the regions of interest (ROIs) were corrected manually. Lung volumes were derived from the sum of segmented ROIs and voxel size. Breathing depth was calculated as lung volume difference between inspiration and expiration (further details are provided in Appendix E1 [supplement]). Image sets were coregistered to the intermediate breathing state by using a deformable B-spline registration algorithm (Elastix, v4.8; University Medical Center, Utrecht, the Netherlands) (15). The SIs of each voxel at position x (hereafter indicated as  ) of all obtained breathing states were plotted, and a linear fit was applied to model the signal change from expiration to inspiration, considering all acquired data. Following Zapke et al (16), FV was calculated for each voxel , providing values in milliliter of gas per milliliter of lung parenchyma:
 . .
|
To reflect tidal breathing, FVSI() was calculated from the signal change between normal inspiration and normal expiration during breath-hold imaging and from the outermost states at free-breathing imaging. Color-coded FV maps were generated, and FVSI() was averaged to a mean FVSI. For comparison, FV can also be expressed as change of lung volumes over the breathing cycle (16):
 . .
|
Air volume fraction.—UTE-measured SIs are proportional to lung density and can be used to approximate the air volume fraction (AVF). To achieve an interindividual comparability, the measured SIs of the lung parenchyma were normalized. SIs of three consecutive ROIs (ascending and descending thoracic aorta and aortic arch; ROI voxel size, 3 × 3) were averaged to the mean SI of pure blood (SIp,blood) (17,18), and relative SI was calculated. SIp() denotes the SI of pulmonary parenchyma in voxel :
 . .
|
The AVF per voxel, or AVF (), can then be calculated as follows:
 . .
|
Details are provided in Appendix E1 (supplement). Postprocessing was done by using custom-made algorithms in Matlab (v2018b, MathWorks, Natick, Mass).
Statistical Analyses
Continuous variables are reported as mean ± standard deviation. Wilcoxon signed rank test was used for comparison of FV, AVF, and edge sharpness obtained with different techniques. A P value less than .05 was considered to indicate significant difference. Ordinal data of image quality assessment are presented as median and interquartile range (IQR). Percentage of agreement indicates the number of data sets with the same scoring by all three readers. For any investigated correlation throughout the study, Spearman rank correlation coefficient was used.
Results
Total acquisition time at breath-hold imaging was 1.7 minutes (65-second scan time + four pauses of 10 seconds each between measurements), compared with that of 8.7 minutes at free breathing.
Assessment of Proton Density–weighted Image Quality at Breath Hold and Free Breathing
All examinations were of diagnostic quality (Table E2 [supplement]). Both acquisition techniques resolved pulmonary vasculature up to subsegmental level with equal quality (median score of all data sets by three readers, 4; IQR at breath hold, 0; IQR at free breathing, 1). Airways were equivalently detectable up to the segmental branch level with both techniques (median, 3; IQR, 1).
Free-breathing acquisition was less prone to motion artifacts (number of data sets with presence of motion artifacts: seven in inspiration vs four in expiration, with a percentage of agreement between all readers of 75% vs 85%) compared with breath-hold UTE (16 data sets in inspiration vs 13 in expiration; percentage of agreement between all readers, 60% vs 75%). Images of breath-hold UTE exhibited considerable aliasing artifacts (16 data sets in inspiration and 17 in expiration; percentage of agreement between all readers, 70% vs 75%). Artifact severity was scored as “slight” in both techniques (median, 3; IQR, 0). This difference was not significant. Figure 2 shows exemplary coronal MR images of a healthy control participant in inspiration and expiration at breath-hold and free-breathing acquisitions.
Figure 2:

Proton density–weighted lung MRI with three-dimensional (3D) ultrashort echo time (UTE). Coronal non–contrast material–enhanced 3D UTE MR images obtained at, A, breath-hold, and, B, free-breathing, in expiration (left) and inspiration (right) are representative images in a healthy control participant (26-year-old woman). Note the difference in breathing depth between the breath-hold and free-breathing acquisition.
As expressed in mean ± standard deviation, edge sharpness was generally higher in expiration (breath hold, 0.28 SI/voxel ± 0.07; free breathing, 0.20 SI/voxel ± 0.03) compared with that of inspiration (breath hold, 0.21 SI/voxel ± 0.07; free breathing, 0.17 SI/voxel ± 0.04). The sharpness was highest in acquisitions at expiratory breath hold (P < .05; Fig 1b). Figure 3 shows exemplary proton density–weighted images of two patients: one with lung cancer and one with bronchiectasis and mucus plugging.
Figure 1b:
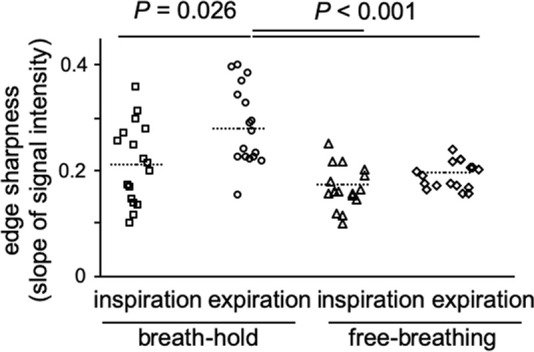
Edge sharpness as an objective criterion for image evaluation. (a) A signal intensity profile in the z-axis was derived at the right diaphragm. After normalization, the mean slope of the signal change between 25% and 75% (black dots) was calculated. (b) Edge sharpness was significantly higher during breath-hold acquisition in expiration. Data are expressed per participant with corresponding mean (dotted line). a.u. = arbitrary units.
Figure 3:

Pulmonary diseases at three-dimensional ultrashort echo time (UTE) MRI of the lung in two patients. Representative images of nonenhanced breath-hold and free-breathing UTE MRI in the coronal plane obtained at inspiration in, A, a 58-year-old man with central lung tumor and, B, a 14-year-old adolescent boy with bronchiectasis and mucus plugging. Arrowheads indicate the pathologic findings.
Functional Analysis
Functional analysis of breath-hold imaging yielded a significantly higher mean FVSI with 0.17 mL ± 0.06 (minimum, 0.07; maximum, 0.34) of gas per milliliter of parenchyma compared with 0.11 mL ± 0.03 (minimum, 0.06; maximum, 0.17) in free-breathing (P = .016). The dependency of mean FVSI on breathing depth is shown in Figure 4 (Spearman ρ = 0.79 and 0.73 for breath-hold and free-breathing acquisitions, respectively). Breathing depth was significantly higher with the breath-hold approach (0.64 L ± 0.28) compared with that of the free-breathing approach (0.37 L ± 0.18). For both sequences, concordance of SI-based mean FVSI and volume-based FV (FVVol) was high, and the difference was not significant. At breath holding the mean difference was −0.008 (95% confidence interval [CI]: 0.007, −0.024; ρ = 0.97), and at free breathing the mean difference was −0.004 (95% CI: 0.007, −0.016; ρ = 0.91; Fig 4, B). Color-coded FV maps of both imaging techniques showed inhomogeneous ventilation patterns in patients with pulmonary disease. Figure 5 compares representative images of a healthy control participant and a patient with cystic fibrosis.
Figure 4:

Scatterplots show good agreement between MRI-based and volume-based fractional ventilation (FV). A, Mean FV signal intensity (FVSI) showed high variability with strong dependence on the absolute breathing depth, with no correspondence between the two ultrashort echo time techniques. B, Good agreement was observed between mean FVSI and FV volume (FVVol), which reflects the relative breathing depth. Dashed line with slope = 1 indicates accordance in which FVSI = FVVol. Data are shown as mean value for each participant. L = liter.
Figure 5:

Fractional ventilation maps. Functional image analysis of MRI data in inspiration and expiration allows for the calculation of color-coded ventilation maps. When compared with respective maps of a healthy 25-year-old woman (left), ventilation maps of a 22-year-old woman with cystic fibrosis (CF) exhibit an inhomogeneous ventilation pattern (right).
AVF was systematically higher at breath-hold UTE sequence compared with that at free breathing (0.72 ± 0.06 vs 0.69 ± 0.07, respectively; P = .004), but a strong linear correlation was found (ρ = 0.88). Regional AVF () and color-coded AVF maps augmented the depiction of pathologic lung parenchyma (Fig E1 [supplement]).
Discussion
Our study compared functional image analyses of the lungs with proton-based nonenhanced UTE MRI at breath hold and at free breathing. Our results demonstrate that both techniques yield proton density–weighted images of similar quality and are suitable for analysis of FV and AVF.
The qualitative assessment of the proton density-weighted images demonstrated a similar quality for both 3D UTE techniques. Increased motion artifacts were observed at breath-hold UTE, predominantly as a result of insufficient breath-hold or involuntary relaxation. Free-breathing UTE was more robust to respiratory motion artifacts. However, inferior edge sharpness was observed. Because the data are acquired over multiple respiratory cycles and binned retrospectively, edge sharpness is determined by the binning width. Hence, narrowing of the gating width can enhance edge sharpness. However, doing so remarkably prolongs acquisition times.
Owing to undersampling, images obtained at breath hold showed increased aliasing artifacts. Increased numbers of spiral interleaves could minimize these artifacts. However, a further increase of the number of spiral interleaves might stretch acquisition time beyond 20 seconds, leading to impracticability of single-breath-hold acquisition for most patients.
After image coregistration, voxelwise calculation of the FV can be performed (16). Although the mean FVSI from free-breathing UTE was in good agreement with that described in the literature (10,19), the mean FVSI obtained during breath hold was significantly higher because the participants’ breathing depth was higher in this acquisition. The FV can also be expressed as the relative breathing depth, which is independent from the acquisition technique but lacks the ability to estimate regional ventilations per voxel. In both acquisition techniques, mean signal-derived and volume-derived ventilation showed high concordance, suggesting good comparability of both sequences regarding functional imaging.
Earlier studies (3) reported a lack of sensitivity of UTE MRI for pathologic conditions with rarefied pulmonary parenchyma, such as emphysema and bullae. In this study, we showed that lung density can be approximated by the AVF at breath-hold and at free-breathing UTE MRI (17). It is important to note that referencing the SI of the pulmonary parenchyma to the SI of aortic blood is only applicable with a nonselective excitation pulse, in which a signal loss due to inflow effects is inconsequential. Furthermore, without consideration of B1 inhomogeneity, the AVF can be estimated only as an approximation. Recently, other promising approaches for estimation of lung density with UTE MRI have been proposed (20,21). However, future studies will be necessary to evaluate the comparability and merits of these techniques.
One limitation of this study was that scan protocols were defined before the start of the study, and only the number of partitions was aligned. When optimizing the parameters individually, undersampling at breath-hold UTE could be minimized to improve image quality. Furthermore, this study lacked a standard of reference, such as CT or lung function test results. The purpose of this study was to examine the suitability of both breath-hold and free-breathing 3D UTE gradient-echo MRI for functional image analyses. Further studies with comparison to lung function test results are necessary to correlate pathologic findings with FVSI.
In conclusion, 3D UTE imaging is a promising technique for depiction of lung morphology, bearing the possibility for functional image analysis such as ventilation. The ability to perform functional 3D UTE imaging within a few short breath holds and at free breathing allows for individualized imaging protocols, which makes 3D UTE lung MRI a promising tool for future routine clinical application.
APPENDIX
SUPPLEMENTAL FIGURES
Supported by the German Research Foundation (DFG) (VE1008/1-1, KO 2938/5-1) and a research grant from Siemens Healthcare.
J.F.H. and S.V. contributed equally to this work.
Disclosures of Conflicts of Interest: J.F.H. disclosed no relevant relationships. S.V. disclosed no relevant relationships. C.M. disclosed no relevant relationships. L.M.P. disclosed no relevant relationships. T.B. Activities related to the present article: employed by Siemens Healthcare GmbH. Activities not related to the present article: disclosed no relevant relationships. Other relationships: disclosed no relevant relationships. J.P. Activities related to the present article: disclosed no relevant relationships. Activities not related to the present article: disclosed money paid to author from Siemens Healthcare. Other relationships: disclosed no relevant relationships. T.A.B. Activities related to the present article: disclosed no relevant relationships. Activities not related to the present article: disclosed consultancy fees from Roche/Chugai for membership on the Expert Panel for “Imaging in Giant Cell Arteritis” and from Novartis for in-house training for “Radiology in Oncological Studies;” grant pending from Deutsche Forschungsgemeinschaft for imaging giant cells in arteritis; payment for lectures about imaging in giant cell arteritis from Roche/Chugai. Other relationships: disclosed no relevant relationships. H.K. disclosed no relevant relationships. A.M.W. disclosed no relevant relationships.
Abbreviations:
- AVF
- air volume fraction
- FV
- fractional ventilation
- FVSI
- FV signal intensity
- IQR
- interquartile range
- ROI
- region of interest
- SI
- signal intensity
- TE
- echo time
- 3D
- three-dimensional
- UTE
- ultrashort echo time
References
- 1.Bergin CJ, Pauly JM, Macovski A. Lung parenchyma: projection reconstruction MR imaging. Radiology 1991;179(3):777–781. [DOI] [PubMed] [Google Scholar]
- 2.Schmidt MA, Yang GZ, Keegan J, et al. Non-breath-hold lung magnetic resonance imaging with real-time navigation. MAGMA 1997;5(2):123–128. [DOI] [PubMed] [Google Scholar]
- 3.Ohno Y, Koyama H, Yoshikawa T, et al. Pulmonary high-resolution ultrashort TE MR imaging: comparison with thin-section standard- and low-dose computed tomography for the assessment of pulmonary parenchyma diseases. J Magn Reson Imaging 2016;43(2):512–532. [DOI] [PubMed] [Google Scholar]
- 4.Bell LC, Johnson KM, Fain SB, et al. Simultaneous MRI of lung structure and perfusion in a single breathhold. J Magn Reson Imaging 2015;41(1):52–59. [DOI] [PMC free article] [PubMed] [Google Scholar]
- 5.Grodzki DM, Jakob PM, Heismann B. Ultrashort echo time imaging using pointwise encoding time reduction with radial acquisition (PETRA). Magn Reson Med 2012;67(2):510–518. [DOI] [PubMed] [Google Scholar]
- 6.Qian Y, Boada FE. Acquisition-weighted stack of spirals for fast high-resolution three-dimensional ultra-short echo time MR imaging. Magn Reson Med 2008;60(1):135–145. [DOI] [PMC free article] [PubMed] [Google Scholar]
- 7.Mugler JP, Meyer CH, Pfeuffer J, Stemmer A, Kiefer B. Accelerated stack-of-spirals breath-hold UTE lung imaging [abstr]. In: Proceedings of the Twenty-Fifth Meeting of the International Society for Magnetic Resonance in Medicine. Berkeley, Calif: International Society for Magnetic Resonance in Medicine, 2017; 4904. [Google Scholar]
- 8.Barger AV, Block WF, Toropov Y, Grist TM, Mistretta CA. Time-resolved contrast-enhanced imaging with isotropic resolution and broad coverage using an undersampled 3D projection trajectory. Magn Reson Med 2002;48(2):297–305. [DOI] [PubMed] [Google Scholar]
- 9.Johnson KM, Fain SB, Schiebler ML, Nagle S. Optimized 3D ultrashort echo time pulmonary MRI. Magn Reson Med 2013;70(5):1241–1250. [DOI] [PMC free article] [PubMed] [Google Scholar]
- 10.Mendes Pereira L, Wech T, Weng AM, et al. UTE-SENCEFUL: first results for 3D high-resolution lung ventilation imaging. Magn Reson Med 2019;81(4):2464–2473. [DOI] [PubMed] [Google Scholar]
- 11.Weick S, Breuer FA, Ehses P, et al. DC-gated high resolution three-dimensional lung imaging during free-breathing. J Magn Reson Imaging 2013;37(3):727–732. [DOI] [PubMed] [Google Scholar]
- 12.Fischer A, Weick S, Ritter CO, et al. SElf-gated Non-Contrast-Enhanced FUnctional Lung imaging (SENCEFUL) using a quasi-random fast low-angle shot (FLASH) sequence and proton MRI. NMR Biomed 2014;27(8):907–917. [DOI] [PubMed] [Google Scholar]
- 13.Higano NS, Hahn AD, Tkach JA, et al. Retrospective respiratory self-gating and removal of bulk motion in pulmonary UTE MRI of neonates and adults. Magn Reson Med 2017;77(3):1284–1295. [DOI] [PMC free article] [PubMed] [Google Scholar]
- 14.Feng L, Delacoste J, Smith D, et al. Simultaneous evaluation of lung anatomy and ventilation using 4D respiratory-motion-resolved ultrashort echo time sparse MRI. J Magn Reson Imaging 2019;49(2):411–422. [DOI] [PMC free article] [PubMed] [Google Scholar]
- 15.Klein S, Staring M, Murphy K, Viergever MA, Pluim JP. elastix: a toolbox for intensity-based medical image registration. IEEE Trans Med Imaging 2010;29(1):196–205. [DOI] [PubMed] [Google Scholar]
- 16.Zapke M, Topf H-G, Zenker M, et al. Magnetic resonance lung function--a breakthrough for lung imaging and functional assessment? a phantom study and clinical trial. Respir Res 2006;7(1):106. [DOI] [PMC free article] [PubMed] [Google Scholar]
- 17.Carinci F, Meyer C, Breuer FA, Jakob PM. In vivo imaging of the spectral line broadening of the human lung in a single breathhold. J Magn Reson Imaging 2016;44(3):745–757. [DOI] [PubMed] [Google Scholar]
- 18.Carinci F, Breuer FA, Jakob PM. On the estimation of the alveolar size in the human lungs using proton MRI [abstr]. In: Proceedings of the Twenty-Third Meeting of the International Society for Magnetic Resonance in Medicine. Berkeley, Calif: International Society for Magnetic Resonance in Medicine, 2015; 3975. [Google Scholar]
- 19.Veldhoen S, Weng AM, Knapp J, et al. Self-gated non-contrast-enhanced functional lung MR imaging for quantitative ventilation assessment in patients with cystic fibrosis. Radiology 2017;283(1):242–251. [DOI] [PubMed] [Google Scholar]
- 20.Higano NS, Fleck RJ, Spielberg DR, et al. Quantification of neonatal lung parenchymal density via ultrashort echo time MRI with comparison to CT. J Magn Reson Imaging 2017;46(4):992–1000. [DOI] [PMC free article] [PubMed] [Google Scholar]
- 21.Benlala I, Berger P, Girodet P-O, et al. Automated volumetric quantification of emphysema severity by using ultrashort echo time MRI: validation in participants with chronic obstructive pulmonary disease. Radiology 2019;292(1):216–225. [DOI] [PubMed] [Google Scholar]
Associated Data
This section collects any data citations, data availability statements, or supplementary materials included in this article.