Abstract
Purpose
To employ four-dimensional (4D) flow MRI to investigate associations between hemodynamic parameters with systolic anterior motion (SAM), mitral regurgitation (MR), stroke volume, and cardiac mass in patients with hypertrophic cardiomyopathy (HCM).
Materials and Methods
A total of 13 patients with HCM (51 years ± 16 [standard deviation]; 10 men) and 11 age-matched healthy control subjects (54 years ± 15; eight men) underwent cardiac 4D flow MRI data analysis including calculation of peak systolic and diastolic control-averaged left ventricular (LV) velocity maps to quantify volumes of elevated velocity (EVV) in the left ventricle. Standard-of-care cine imaging was performed in short-axis, LV outflow tract (LVOT), and two-, three-, and four-chamber views on which the presence of SAM, presence of MR, total stroke volume, and cardiac mass were assessed.
Results
Systolic EVV in patients with HCM was 7 mL ± 5, which was significantly associated with elevated aortic peak velocity (R = 0.87; P < .001), decreased LVOT diameter (R = 0.68; P = .01), and increased cardiac mass (R = 0.62; P = .02). In addition, EVV differed significantly between patients with and those without SAM (10 mL ± 4.7 vs 3 mL ± 2.3; P = .03) and those with and those without MR (9.9 mL ± 4.8 vs 4.0 mL ± 3.2; P < .05). In the atrial systolic phase, peak diastolic velocity in the LV correlated with septal thickness (R = 0.66; P = .01).
Conclusion
Quantification and visualization of EVV in the LV is feasible and may provide further insight into the clinical manifestations of altered hemodynamics in HCM.
© RSNA, 2020
Summary
In addition to conventional quantification of peak velocity over the aortic valve, mapping of elevated velocity volume provides unique, concise, and comprehensive visualization of the complex intraventricular blood flow interaction with the altered cardiac structure in hypertrophic cardiomyopathy.
Key Points
■ Four-dimensional flow MRI allows quantification and visualization of the volume of abnormally elevated velocity volume (EVV) in the left ventricle of patients with hypertrophic cardiomyopathy in the ventricular and atrial systolic cardiac phase.
■ EVV in the ventricular systolic phase correlated with the presence of systolic anterior motion and mitral regurgitation and greater cardiac mass and EVV in the atrial systolic phase correlated with septal thickness.
■ EVV mapping may prove useful in classifying the degree of systolic and diastolic dysfunction in hypertrophic cardiomyopathy.
Introduction
Hypertrophic cardiomyopathy (HCM) is a complex and heterogeneous disease defined by the presence of a maximal wall thickness of greater than or equal to 15 mm in one or more left ventricular (LV) myocardial segments that cannot be explained solely by loading conditions such as hypertension or aortic stenosis (1). A recent study suggests that the prevalence of HCM is 1:200 in the general population (2). The most common comorbidity of HCM is diastolic dysfunction (3). Furthermore, obstruction of the LV outflow tract (LVOT) and associated systolic anterior motion (SAM) of the mitral valve can lead to mitral regurgitation (MR), left atrial enlargement, and atrial fibrillation (1). To assess disease severity, peak velocity in the LVOT as a marker of subvalvular obstruction, SAM-associated MR, and impaired diastolic filling as measured by peak mitral inflow (E-wave) velocities are commonly evaluated, most often with echocardiography (4).
Patients with HCM are frequently referred for cardiac MRI for evaluation of the presence and severity of myocardial scar and fibrosis, which is emerging as an independent risk factor of arrhythmia and sudden cardiac death (5–7). During these examinations, patients frequently undergo two-dimensional phase-contrast imaging of the LVOT and the mitral valve to assess aortic obstruction and MR. Alternatively, four-dimensional (4D) flow MRI can provide a comprehensive quantitative measurement of healthy and pathophysiologic intracardiac blood flow patterns (8–11) and may therefore be a promising tool for the hemodynamic assessment of HCM severity (12).
Recently, techniques were developed to detect abnormal aortic three-dimensional (3D) blood flow velocities in patients relative to cohort-averaged data of a group of healthy subjects serving as a normal reference (13). The aim of this study was to explore a similar approach for intracardiac 3D blood flow in the LV. 4D flow MRI was used to identify regions with altered 3D LV velocities in patients with HCM when compared with a 3D cohort-averaged LV velocity map of a healthy control group. We hypothesized that LV velocities in patients with HCM are abnormally elevated during both ventricular ejection (owing to outflow obstruction and/or hyperdynamic function) and atrial systole (owing to diastolic dysfunction). We further hypothesized that these abnormalities are related to structural parameters of HCM such as septal thickness, free wall thickness, LVOT diameter, end-diastolic and end-systolic volume, stroke volume, ejection fraction, and presence of SAM and MR.
Materials and Methods
Subject Cohort
To reduce confounders in hemodynamic behavior, a homogeneous HCM cohort was established by including patients who had all been given a diagnosis of basal-septal HCM at echocardiography, defined as LV septal wall thickness of greater than 15 mm. Patients with any other HCM phenotype, as assessed at echocardiography, were excluded from the study. The included patients took part in two previous studies in which altered aortic flow patterns were related to LVOT gradient, SAM, and outflow geometry (14) and in which aortic energy losses were related to myocardial fibrosis (15). However, not all patient scans from these previous studies contained 4D flow MRI acquisitions enclosing the entire LV, limiting the cohort of the current study to 14 patients. These adult patients (≥18 years; mean age, 49 years ± 17 [standard deviation]; range, 18–71 years; 10 men) were enrolled following an indication for cardiac MRI as part of their clinical assessment.
In addition, 11 healthy control subjects with no history of cardiovascular disease were recruited to take part in a previously published test-retest study (16). These volunteers (mean age, 54 years ± 15; range, 20–74 years; eight men) underwent an additional whole-heart 4D flow MRI scan, which was not analyzed previously. All volunteers provided informed consent, and patients were included in accordance with an institutional review board protocol that permitted retrospective chart review. All research was conducted in accordance with the Helsinki declaration.
MRI Examinations
All subjects underwent an MRI examination on 1.5-T systems (Magnetom Avanto and Aera; Siemens, Erlangen, Germany) that included respiratory and electrocardiographically gated 4D flow MRI to measure time-resolved 3D blood flow velocities with full volumetric coverage of the LV. Pulse sequence parameters were as follows: spatial resolution, 2.9–4.0 × 2.1–2.8 × 2.8–3.2 mm3; temporal resolution, 37–40 msec; echo time, 2.2–2.5 msec; repetition time, 4.6–4.9 msec; flip angle, 7°–15°; and velocity sensitivity = 120–250 cm/sec. Furthermore, electrocardiographically gated cine steady-state free precession (SSFP) images were acquired for all patients in multiple orientations (short-axis, LVOT, and two-chamber, three-chamber, and four-chamber views). Sequence parameters for SSFP were as follows: spatial resolution, 1.5–1.8 × 1.5–1.8 × 6–8 mm3; temporal resolution, 35–45 msec; and echo time/repetition time/flip angle, 1.1 msec/39 msec/80°.
Data Analysis
End-diastolic and end-systolic volume, stroke volume, ejection fraction, and cardiac mass were measured on the cine SSFP images using cvi42 (Circle Cardiovascular Imaging, Calgary, Alberta, Canada). The cine SSFP images were further used for the quantitative assessment of septal thickness, free wall thickness, and LVOT diameter and the qualitative assessment of the presence of SAM and MR severity using the RadiAnt Digital Imaging and Communications in Medicine viewer (Medixant, Poznań, Poland, https://www.radiantviewer.com/). Identification of MR was based on retrograde spin dephasing through the mitral valve during the systole. The degree of MR was further subclassified using the signal intensity of the jet and degree of extension into the left atrium similar to the grading scheme described by Heitner et al (17).
4D flow MRI data preprocessing included correction for background phase offsets and velocity aliasing. 3D phase-contrast MR angiograms were created by multiplication of phase-contrast magnitude images with absolute velocity images, which were subsequently averaged over time (18). From these images, the LV was semiautomatically segmented by using commercial software (Mimics; Materialise, Leuven, Belgium). The ventricular and atrial systolic phases were defined as the cardiac time frame in the first and second half of the cardiac cycle with the highest averaged velocity in the LV, respectively. See Figure 1 for an overview of this processing workflow. Peak velocity was determined over the aortic valve for the ejection phase and over the mitral valve for the atrial systolic phase by using a method previously described (19).
Figure 1a:
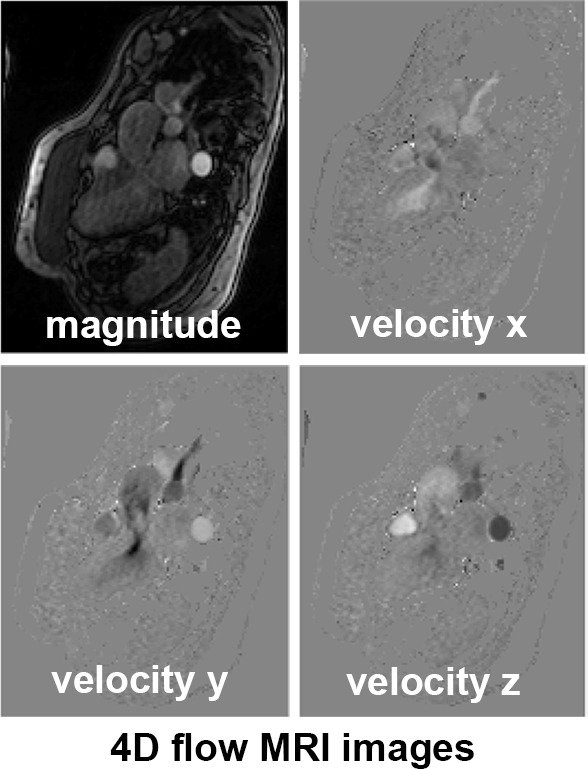
(a) Four-dimensional (4D) flow MR images acquired in a patient with hypertrophic cardiomyopathy, (b) a slice of the phase-contrast angiogram with (c) one slice of the segmentation, and (d) the three-dimensional (3D) segmentation. (e) The ventricular and atrial systolic time frames are defined by the maximum averaged velocity in the segmentation with the accompanying velocity vectors shown in (f).
Figure 1b:
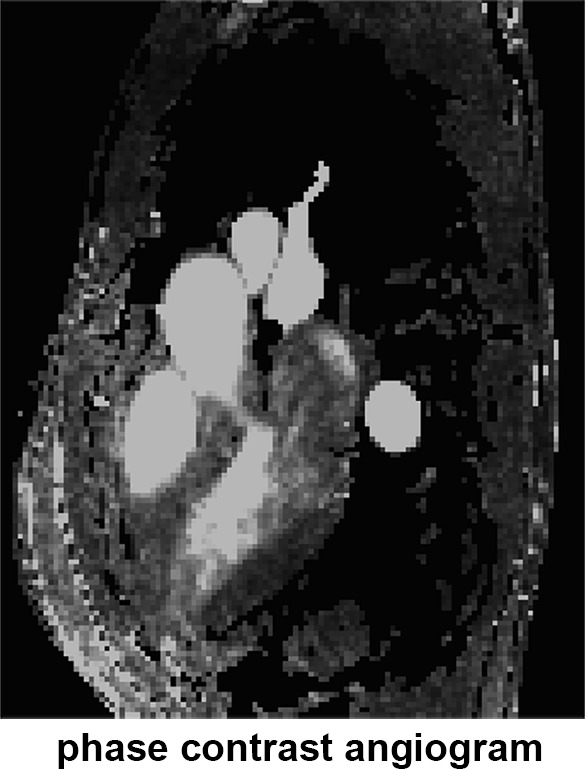
(a) Four-dimensional (4D) flow MR images acquired in a patient with hypertrophic cardiomyopathy, (b) a slice of the phase-contrast angiogram with (c) one slice of the segmentation, and (d) the three-dimensional (3D) segmentation. (e) The ventricular and atrial systolic time frames are defined by the maximum averaged velocity in the segmentation with the accompanying velocity vectors shown in (f).
Figure 1c:
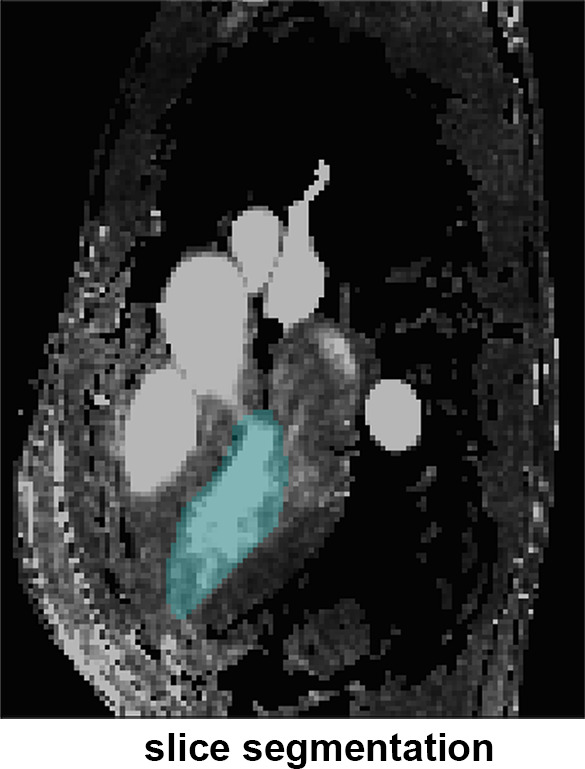
(a) Four-dimensional (4D) flow MR images acquired in a patient with hypertrophic cardiomyopathy, (b) a slice of the phase-contrast angiogram with (c) one slice of the segmentation, and (d) the three-dimensional (3D) segmentation. (e) The ventricular and atrial systolic time frames are defined by the maximum averaged velocity in the segmentation with the accompanying velocity vectors shown in (f).
Figure 1d:
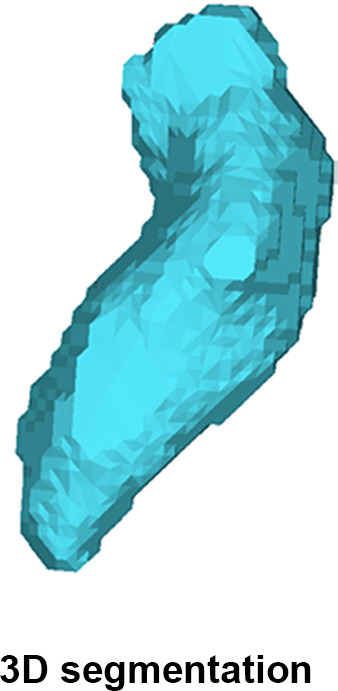
(a) Four-dimensional (4D) flow MR images acquired in a patient with hypertrophic cardiomyopathy, (b) a slice of the phase-contrast angiogram with (c) one slice of the segmentation, and (d) the three-dimensional (3D) segmentation. (e) The ventricular and atrial systolic time frames are defined by the maximum averaged velocity in the segmentation with the accompanying velocity vectors shown in (f).
Figure 1e:
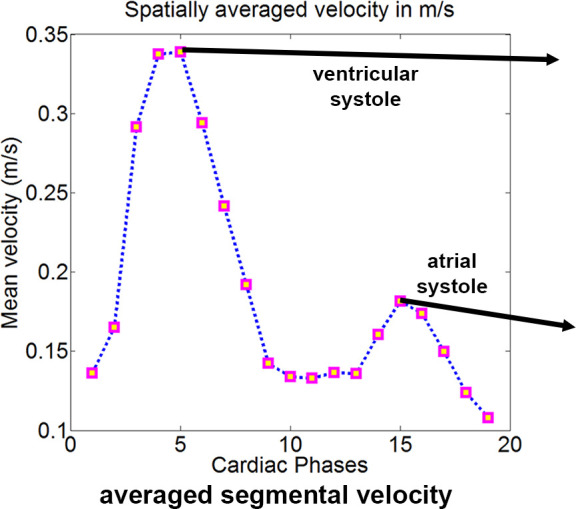
(a) Four-dimensional (4D) flow MR images acquired in a patient with hypertrophic cardiomyopathy, (b) a slice of the phase-contrast angiogram with (c) one slice of the segmentation, and (d) the three-dimensional (3D) segmentation. (e) The ventricular and atrial systolic time frames are defined by the maximum averaged velocity in the segmentation with the accompanying velocity vectors shown in (f).
Figure 1f:
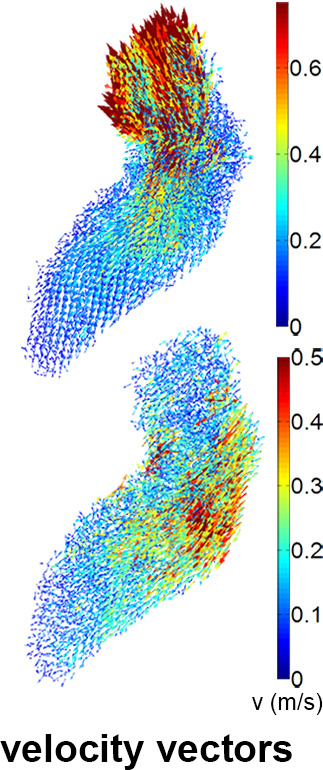
(a) Four-dimensional (4D) flow MR images acquired in a patient with hypertrophic cardiomyopathy, (b) a slice of the phase-contrast angiogram with (c) one slice of the segmentation, and (d) the three-dimensional (3D) segmentation. (e) The ventricular and atrial systolic time frames are defined by the maximum averaged velocity in the segmentation with the accompanying velocity vectors shown in (f).
Cohort Averaging and Elevated Velocity Volume
For the control cohort, a “shared” LV geometry was created based on a previously reported methodology (20,21). All LV segmentations in the control cohort were coregistered using rigid registration. By summing the registered masks, a 3D map that quantified the amount of geometry shared by all segmentations (“overlap map”) was created. All control subjects were again registered to the overlap map, and the number of shared voxels between a control-specific geometry and the overlap map varying at a multitude of thresholds was calculated. The threshold where the average number over the control cohort of shared voxels was highest was chosen as the “shared” geometry.
Subsequently, each individual geometry of the control cohort was registered with affine registration followed by nearest neighbor interpolation of the velocity values to the “shared geometry.” Two metrics to quantify the difference of velocity values before and after registration and interpolation from the control geometry to the “shared geometry” were calculated: (a) the number of voxels of the individual geometry not overlapping with the “shared” geometry as a percentage of the mean of all voxels, and (b) the difference of velocity values as a percentage of the mean velocity before and after interpolation in the apex, mid, and basal regions of the LV. The apex, mid, and basal region were selected as the lower third, the middle third, and the basal third of the LV geometry, respectively, with exclusion of the proximal aorta. After registration and interpolation of the velocity values of all the control subjects to the “shared” geometry, the voxel-by-voxel average and standard deviation of the velocity values over the control cohort were calculated to yield 3D control-averaged and standard deviation maps.
By adding 1.96 times the standard deviation map to average velocity map, a 3D map was created that delineated the upper threshold of the 95% confidence interval of normal physiologic LV velocities. Finally, regions with abnormally elevated LV velocities in the HCM cohort were identified by affine coregistration and nearest neighbor interpolation of the confidence interval map to the patient LV geometry. LV voxels in patients with HCM with a velocity magnitude outside the confidence interval map were labeled and visualized by 3D rendering techniques. Abnormally elevated velocity was expressed by the number of voxels with elevated velocity multiplied by voxel volume (in milliliters): elevated velocity volume (EVV). In Figure 2, example patient data are used to display the pipeline of EVV map creation.
Figure 2a:
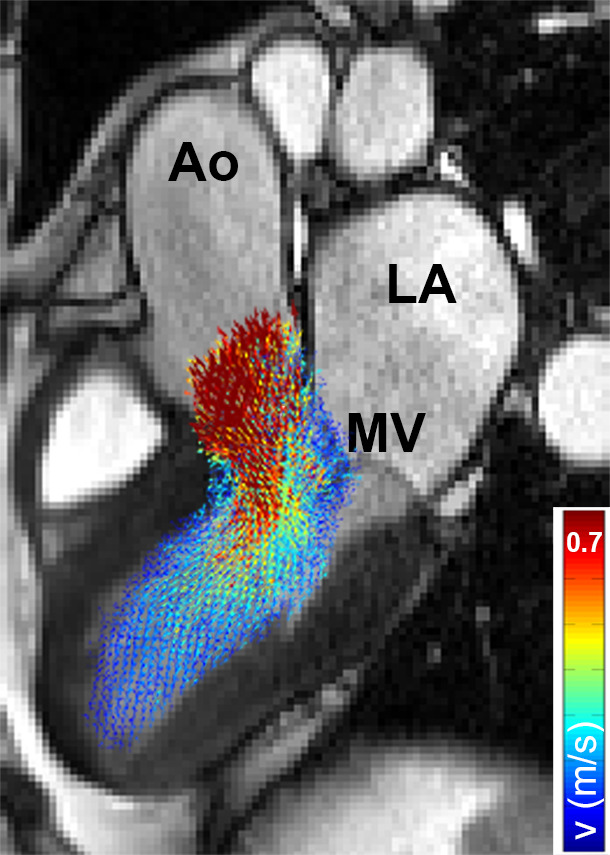
(a) Segmented velocity vectors of a data set of patients with hypertrophic cardiomyopathy mapped on a cine image at the ejection phase. (b) The left ventricular segmentation of the patient was coregistered to the control “shared” geometry and the difference in overlap, quantified. (c) The control-averaged velocity values were interpolated to the patient geometry and the differences in velocity, quantified. The standard deviation (SD) map of the control cohort was interpolated to the patient geometry as well to create a map of the upper limit of the 95% confidence interval shown in (d). By three-dimensional rendering of the voxels where the velocity values of the patient were higher than the mean + 1.96 SD map, elevated velocity was visualized. * indicates multiplication. Ao = aorta, LA = left atrium, MV = mitral valve.
Figure 2b:
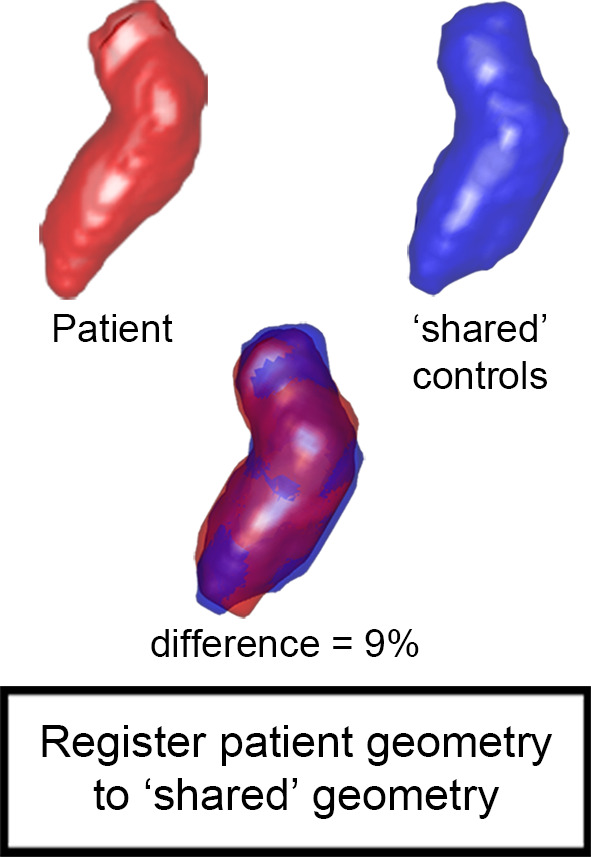
(a) Segmented velocity vectors of a data set of patients with hypertrophic cardiomyopathy mapped on a cine image at the ejection phase. (b) The left ventricular segmentation of the patient was coregistered to the control “shared” geometry and the difference in overlap, quantified. (c) The control-averaged velocity values were interpolated to the patient geometry and the differences in velocity, quantified. The standard deviation (SD) map of the control cohort was interpolated to the patient geometry as well to create a map of the upper limit of the 95% confidence interval shown in (d). By three-dimensional rendering of the voxels where the velocity values of the patient were higher than the mean + 1.96 SD map, elevated velocity was visualized. * indicates multiplication. Ao = aorta, LA = left atrium, MV = mitral valve.
Figure 2c:
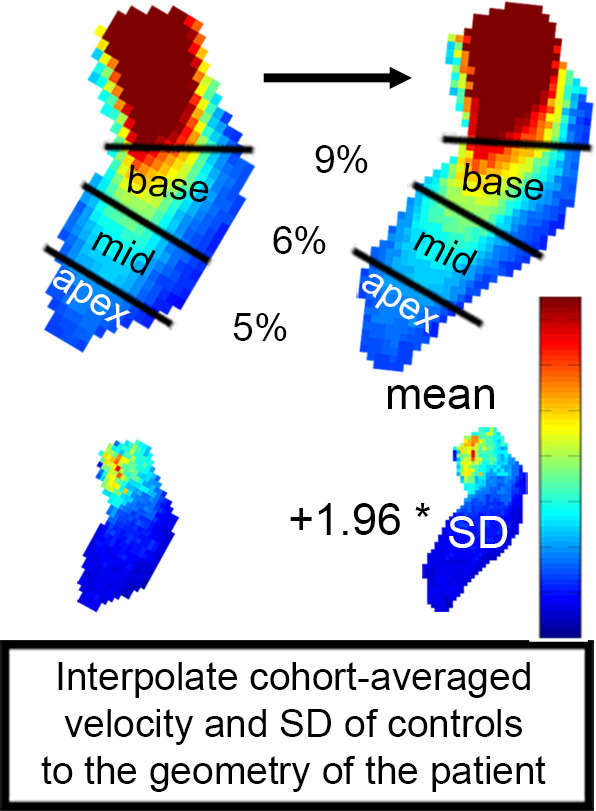
(a) Segmented velocity vectors of a data set of patients with hypertrophic cardiomyopathy mapped on a cine image at the ejection phase. (b) The left ventricular segmentation of the patient was coregistered to the control “shared” geometry and the difference in overlap, quantified. (c) The control-averaged velocity values were interpolated to the patient geometry and the differences in velocity, quantified. The standard deviation (SD) map of the control cohort was interpolated to the patient geometry as well to create a map of the upper limit of the 95% confidence interval shown in (d). By three-dimensional rendering of the voxels where the velocity values of the patient were higher than the mean + 1.96 SD map, elevated velocity was visualized. * indicates multiplication. Ao = aorta, LA = left atrium, MV = mitral valve.
Figure 2d:
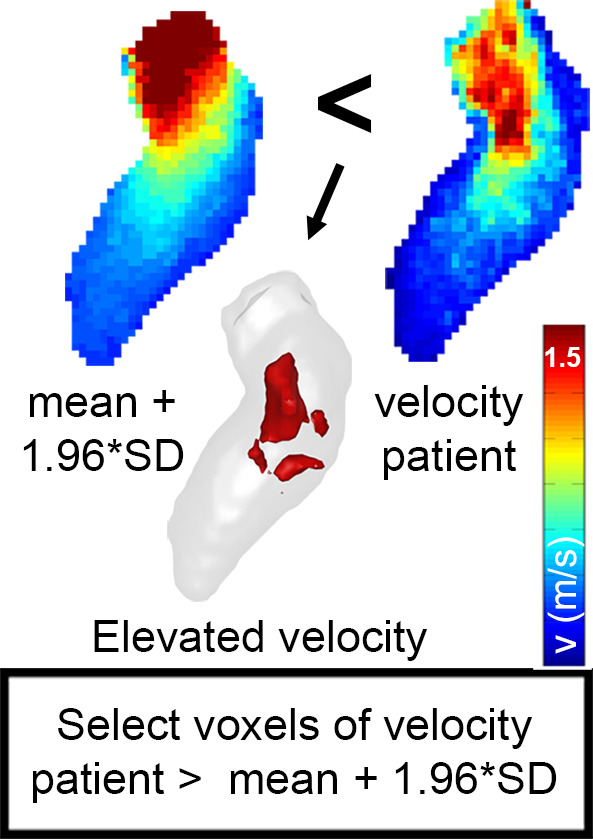
(a) Segmented velocity vectors of a data set of patients with hypertrophic cardiomyopathy mapped on a cine image at the ejection phase. (b) The left ventricular segmentation of the patient was coregistered to the control “shared” geometry and the difference in overlap, quantified. (c) The control-averaged velocity values were interpolated to the patient geometry and the differences in velocity, quantified. The standard deviation (SD) map of the control cohort was interpolated to the patient geometry as well to create a map of the upper limit of the 95% confidence interval shown in (d). By three-dimensional rendering of the voxels where the velocity values of the patient were higher than the mean + 1.96 SD map, elevated velocity was visualized. * indicates multiplication. Ao = aorta, LA = left atrium, MV = mitral valve.
Intra- and Interobserver Variability
To investigate the robustness of the methodology to create EVV maps, the LV segmentation process in the patient cohort was repeated by the first observer for intraobserver analysis and by a second observer blinded to the results of the first for interobserver analysis. The first observer had extensive experience with the segmentation software (approximately 1 year, albeit not for the LV), whereas the second observer had approximately 1 month of experience, but also not for the LV.
Statistical Analysis
Results were expressed as mean ± standard deviation. Differences between groups were assessed using a Wilcoxon rank sum test. Sex differences were assessed with a Fisher exact test. Linear regression was performed for EVV versus peak velocity, EVV versus all the cardiac parameters assessed on cine images, and peak velocity versus all the cardiac parameters assessed on cine images. Binary logistic regression between EVV and presence of SAM and presence of MR and between peak velocity and presence of SAM and presence of MR was used, and the odds for three characteristic values of EVV and peak velocity were calculated. P < .05 was considered statistically significant for all statistical analyses. To quantify intra- and interobserver variability, the intraclass correlation coefficient for EVV was used.
Results
Patient Characteristics
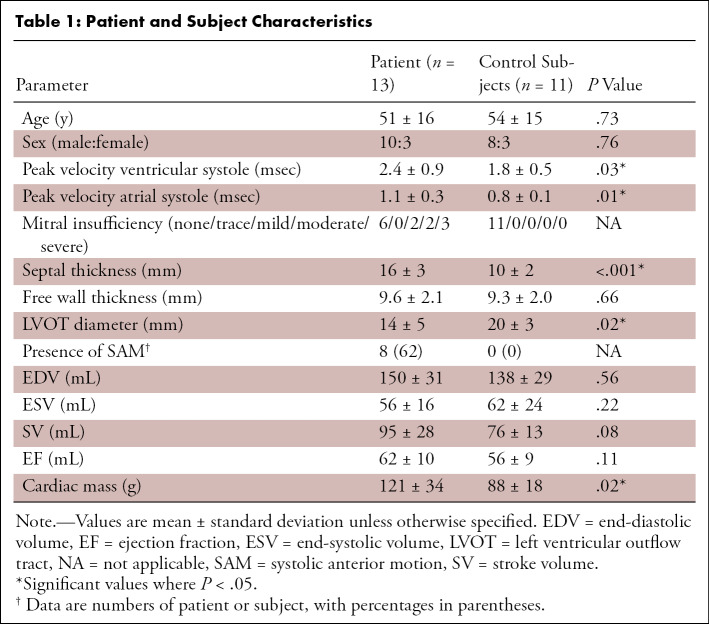
After assessment of HCM on cine images, one patient was excluded owing to midchamber HCM instead of basal-septal HCM. Characteristics for the remaining 13 patients with HCM and 11 control subjects are summarized in Table 1. The peak velocities at the aortic valve (during ventricular systole) and mitral valve (during atrial systole) were significantly higher for patients with HCM compared with control subjects. Furthermore, the septal thickness and cardiac mass were significantly higher for the patients, whereas the LVOT diameter was lower.
Table 1:
Patient and Subject Characteristics
Figure 3 shows example cine SSFP images in LVOT orientation and corresponding 4D flow MRI–derived maximum intensity projections of flow velocities during the ventricular (Fig 3a) and atrial (Fig 3b) systolic phase.
Figure 3a:
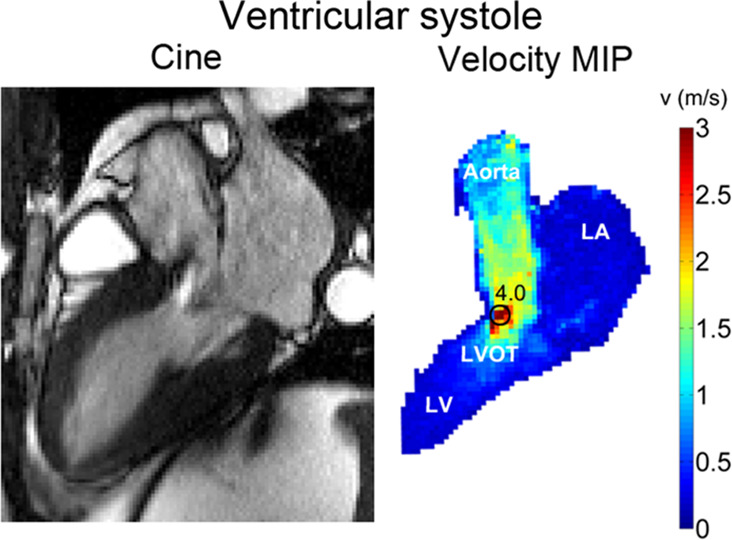
(a) Cine steady-state free precession (SSFP) image in a patient with hypertrophic cardiomyopathy with a bright signal in the left ventricular outflow tract (LVOT) indicating jet flow caused by LVOT obstruction during the ventricular systolic phase. Quantification of peak velocity based on the 4D flow–derived velocity maximum intensity projection (MIP) revealed a peak velocity of 4.0 msec in the LVOT. (b) Cine SSFP image during the atrial systolic phase. Quantification of peak velocity resulted in 0.8 msec in the LVOT. LA = left atrium, LV = left ventricle.
Figure 3b:
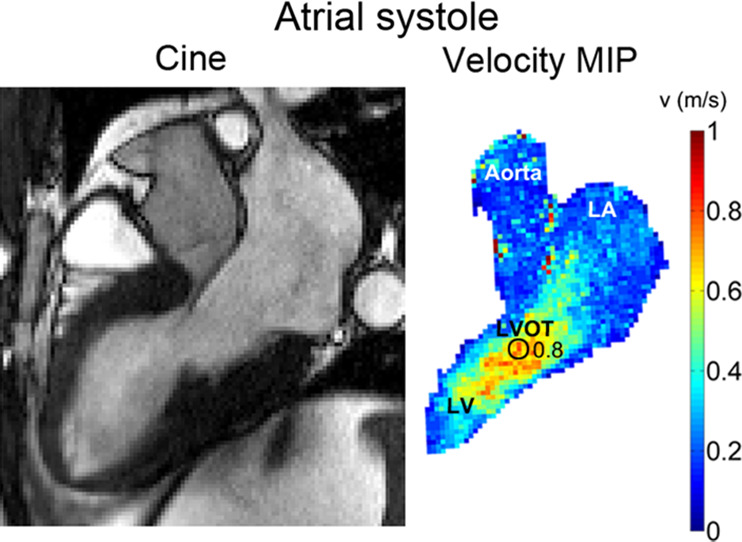
(a) Cine steady-state free precession (SSFP) image in a patient with hypertrophic cardiomyopathy with a bright signal in the left ventricular outflow tract (LVOT) indicating jet flow caused by LVOT obstruction during the ventricular systolic phase. Quantification of peak velocity based on the 4D flow–derived velocity maximum intensity projection (MIP) revealed a peak velocity of 4.0 msec in the LVOT. (b) Cine SSFP image during the atrial systolic phase. Quantification of peak velocity resulted in 0.8 msec in the LVOT. LA = left atrium, LV = left ventricle.
Cohort Averaging of Control Data
In Figure 4a, the overlap map with inclusion of every control subject is shown. The map where the average number of shared voxels of the control geometries with the thresholded geometry was highest is shown in Figure 4b (the “shared” geometry). Figure 4c and 4d display the cohort-averaged velocity vectors of the control cohort for the ventricular and atrial systolic phases, respectively.
Figure 4a:
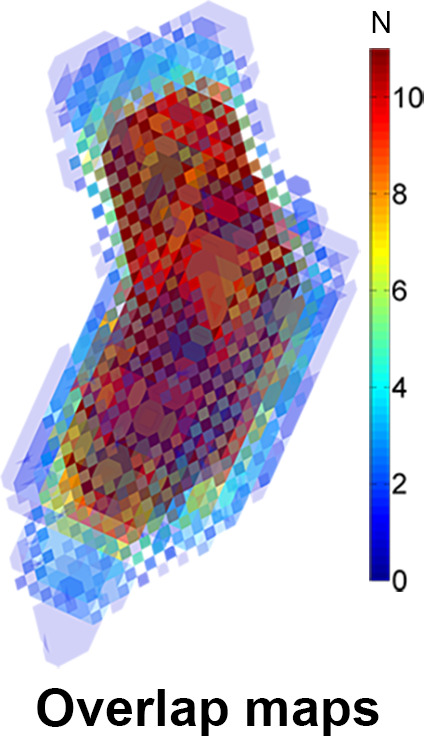
(a) A three-dimensional overlap map of the left ventricular (LV) geometries using all controls. (b) The “shared” geometry with anatomy indicated. (c,d) The control-averaged map in the (c) ventricular and (d) atrial systolic phase. Ao = aorta, LA = left atrium.
Figure 4b:
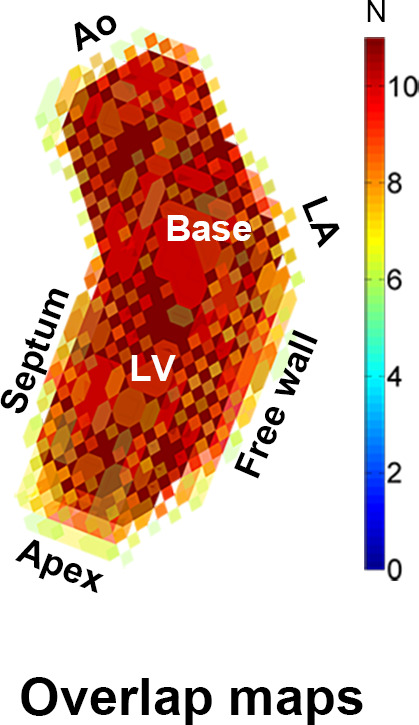
(a) A three-dimensional overlap map of the left ventricular (LV) geometries using all controls. (b) The “shared” geometry with anatomy indicated. (c,d) The control-averaged map in the (c) ventricular and (d) atrial systolic phase. Ao = aorta, LA = left atrium.
Figure 4c:
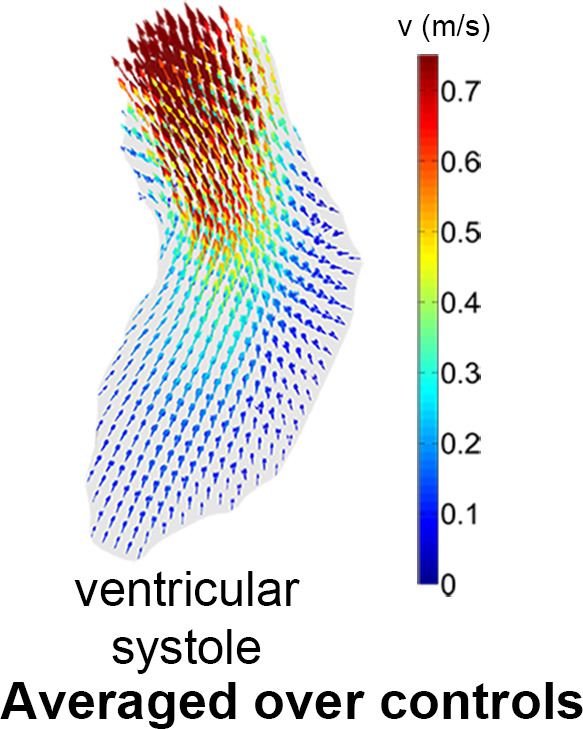
(a) A three-dimensional overlap map of the left ventricular (LV) geometries using all controls. (b) The “shared” geometry with anatomy indicated. (c,d) The control-averaged map in the (c) ventricular and (d) atrial systolic phase. Ao = aorta, LA = left atrium.
Figure 4d:
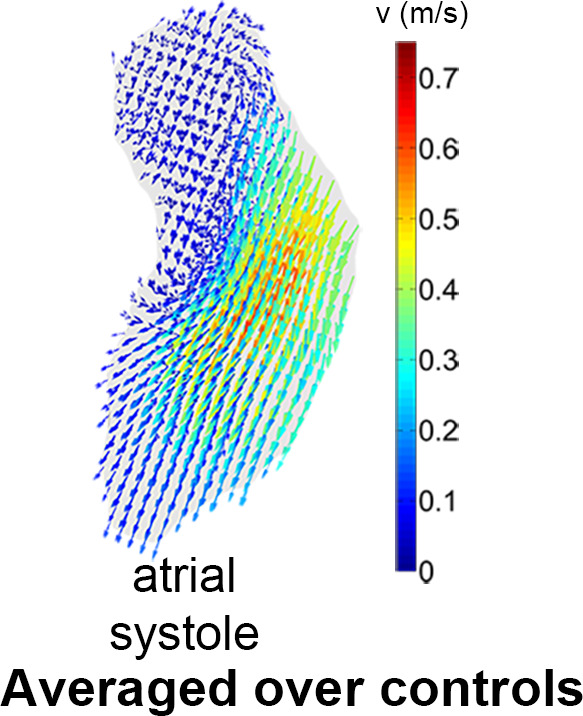
(a) A three-dimensional overlap map of the left ventricular (LV) geometries using all controls. (b) The “shared” geometry with anatomy indicated. (c,d) The control-averaged map in the (c) ventricular and (d) atrial systolic phase. Ao = aorta, LA = left atrium.
The mean number of voxels not shared by the individual control geometries and the “shared” control geometry was 11% ± 2 of the average number of voxels of the individual and shared geometry. For the controls in ventricular systole, the difference in apical, mid, and basal mean velocity before and after registration and interpolation was 4% ± 5, 5% ± 5, and 7% ± 4, respectively. For the controls in atrial systole, the difference in apical, mid, and basal mean velocity before and after registration and interpolation was 6% ± 4, 6% ± 4, and 4% ± 3, respectively.
Peak Velocity and EVV in Patients with HCM
In Figure 5, examples of EVV in the ventricular and atrial systolic phase are displayed for a patient with SAM. EVV in patients with HCM was 7 mL ± 5 for the ejection phase, ranging from 0 (no abnormally elevated velocity) to 19 mL. Four patients presented with an EVV of greater than 15 mL, and nine patients presented with an EVV of less than 10 mL. For the atrial systolic phase, EVV was 7 mL ± 6, ranging from 0 to 21 mL. Two patients presented with an EVV of greater than 13 mL, whereas 11 patients had an EVV of less than 9 mL.
Figure 5a:
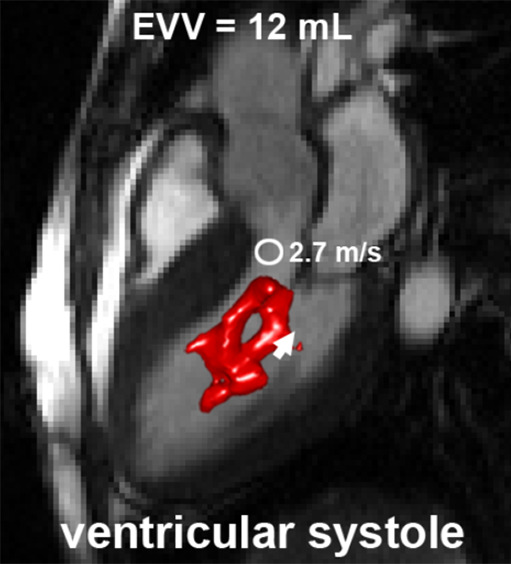
An example of elevated velocity volume (EVV) overlaid on cine images in a patient with HCM with systolic anterior motion (SAM) of the mitral valve apparatus obstructing the left ventricular outflow tract (long arrow in c) (a) Ventricular systole and (b) atrial systole. Short arrows indicate flow direction. The location and value of peak velocity is displayed as a white circle. Ao = aorta, LA = left atrium, LV = left ventricle.
Figure 5b:
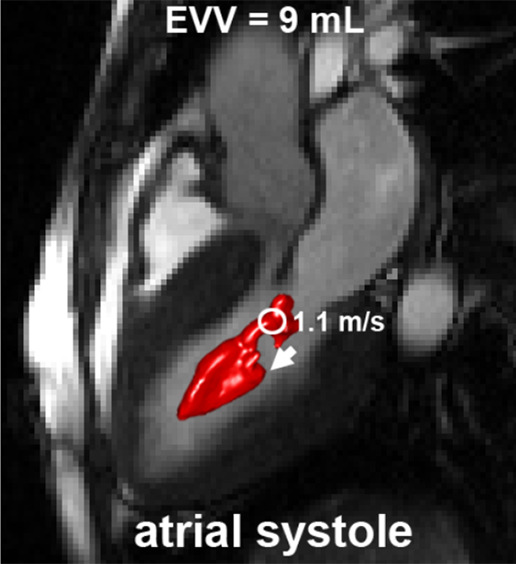
An example of elevated velocity volume (EVV) overlaid on cine images in a patient with HCM with systolic anterior motion (SAM) of the mitral valve apparatus obstructing the left ventricular outflow tract (long arrow in c) (a) Ventricular systole and (b) atrial systole. Short arrows indicate flow direction. The location and value of peak velocity is displayed as a white circle. Ao = aorta, LA = left atrium, LV = left ventricle.
Figure 5c:
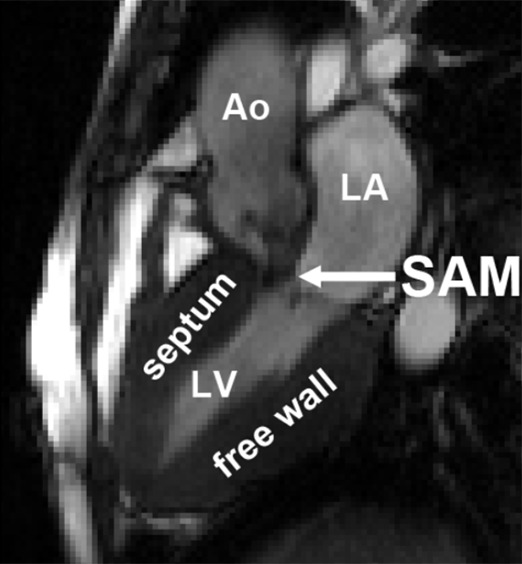
An example of elevated velocity volume (EVV) overlaid on cine images in a patient with HCM with systolic anterior motion (SAM) of the mitral valve apparatus obstructing the left ventricular outflow tract (long arrow in c) (a) Ventricular systole and (b) atrial systole. Short arrows indicate flow direction. The location and value of peak velocity is displayed as a white circle. Ao = aorta, LA = left atrium, LV = left ventricle.
Relationship between LV Velocity and Structural Parameters
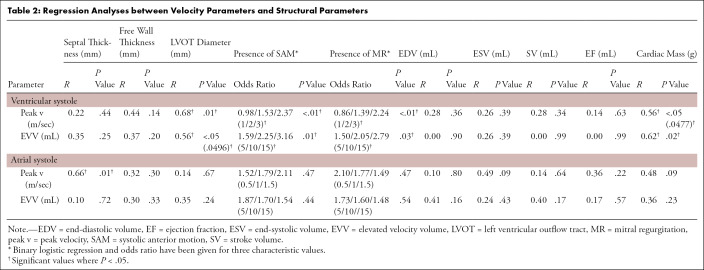
Increased EVV was closely associated with higher peak velocity in the ejection phase (R = 0.87; P < .001) and was significantly different between patients with and without SAM (10 mL ± 4.7 vs 3 mL ± 2.3; P = .03) and between patients with and without mitral insufficiency (9.9 mL ± 4.8 vs 4.0 mL ± 3.2; P = .049). In addition, peak velocity was significantly different in the ejection phase for patients with HCM with and without SAM (2.9 m/sec ± 0.75 vs 1.6 m/sec ± 0.05; P = .002) and with and without MR (3.1 m/sec ± 0.72 vs 1.7 m/sec ± 0.19; P = .001).
Further statistical results are given in Table 2. In the ejection phase, higher peak velocity and EVV were associated with a smaller LVOT diameter (R = 0.68; P = .01 and R = 0.56; P < .05) and a higher cardiac mass (R = 0.56; P < .05 and R = 0.62; P = .02). In the atrial systolic phase, a higher intraventricular peak velocity was associated with higher septal thickness (R = 0.66; P = .01). No relation between peak velocity and EVV was found in the atrial systolic phase.
Table 2:
Regression Analyses between Velocity Parameters and Structural Parameters
Inter- and Intraobserver Variability
The intraclass correlation coefficient for intraobserver variability of EVV was 0.83 for ventricular systole and 0.91 for atrial systole. The intraclass correlation coefficient for interobserver variability of EVV was 0.73 for ventricular systole and 0.91 for atrial systole, indicating overall good agreement between observer-dependent EVV maps.
Discussion
In this study, we found that elevated blood flow velocity, expressed as EVV, was present in the LV of patients with HCM during the ventricular and atrial systolic phase of the cardiac cycle. We showed that EVV in the ventricular systolic phase correlated with the presence of SAM and MR and greater cardiac mass. Additionally, using this technique, we were able to obtain unique, concise, and comprehensive visualization of the complex intraventricular blood flow interaction with the altered cardiac structure in HCM—in other words, to understand 3D renderings. Indeed, it is important to realize that these associations concern intraventricular hemodynamics, rather than the hemodynamics distal from the aortic valve. For the hemodynamics distal from the aortic valve, as expressed by the conventional metric peak velocity, significant associations with LVOT diameter, presence of SAM and MR, and cardiac mass were also found. Intra- and interobserver analysis showed that EVV could be robustly quantified.
SAM is a dynamic process associated with high velocity jets across the LVOT as a result of acute angulated bending of the distal portion of the anterior leaflet of the mitral valve with midsystolic contact or near contact with the ventricular septum (22). We found higher EVV in patients with SAM compared to patients without SAM, which implicates that SAM not only affects the blood flow distal to the aortic valve, but also in the LV. The association of EVV with MR supports this notion. EVV in the left ventricle can therefore potentially provide additional information about disease pathophysiology in patients with HCM.
Diastolic dysfunction is frequently observed in patients with HCM and is caused by an impaired LV relaxation (eg, increased myocardial stiffness and decreased chamber compliance) owing to interstitial fibrosis and an increased LV mass (23). LV filling pressure derived from LV mitral inflow is an important biomarker for diastolic dysfunction but cannot be determined precisely with echocardiography in patients with HCM (24). 4D flow MRI–derived elevated LV velocity maps in atrial systole can potentially be helpful in this evaluation, for example, as was previously shown in patients with thrombus formation in myocardial formation (25). There was no correlation between hemodynamic and structural parameters in the atrial systolic phase, except for peak velocity with septal thickness, which may be a result of increased stiffening of the LV in patients with HCM. Potentially, a threshold of the mean + 1.96 times the standard deviation is a threshold too strict for the detection of elevated velocity in the atrial systolic phase. Further study with varying thresholds could provide further insight into abnormal LV hemodynamics. A comparison with more advanced echocardiography-derived parameters for diastolic dysfunction such as mitral annular velocity is also warranted to provide more insight into the usefulness of elevated velocity maps in the atrial systolic phase. As hemodynamic abnormalities in the LV may be indicative of pressure overload and diastolic dysfunction in patients with HCM, these 4D flow MRI metrics may be complementary to the echocardiographic determination of peak velocity.
Previous studies on the hemodynamic assessment in patients with HCM with 4D flow MRI are scarce. Chu et al showed that LVOT pressure gradients were higher in patients with LVOT obstruction compared with those with nonobstruction (26) and that LVOT obstruction can be assessed with 4D flow MRI (27). Allen et al showed that deranged flow patterns exist in the ascending aorta as a result of structural parameters (12). In another study, it was shown that interstitial fibrosis was related to 4D flow MRI–derived viscous energy loss in the aorta (15). None of these studies investigated the hemodynamic behavior in the LV. By showing that EVV in the LV correlated with SAM, MR, and cardiac mass, we feel that an assessment of LV hemodynamics in HCM beyond the presence of LVOT obstruction has potential importance. Atlases of LV velocity have previously been developed in healthy volunteers (21), but heat maps have not yet been applied in patient cohorts.
In this exploratory study, the main limitation was that only 13 patients were included. Statistical results should therefore be interpreted with caution. Further research with greater population sizes and follow-up is needed to investigate the clinical value of elevated LV velocity in HCM and its relation to (pre-)syncope, arrhythmia, and other clinical outcomes. The relatively thin myocardial walls (16 mm) and high end-diastolic volume found in this patient cohort may be a result of the inclusion of a homogeneous cohort with basal-septal HCM.
Another limitation of this study was the use of time-averaged anatomic images for segmentation of the LV blood pool. The methodology of creating masks based on time-averaged phase-contrast MR angiography has been well-established for the aorta but not so for LVs. However, the use of the segmentation was limited to the time frame where the velocities in the LV were highest. As the LV phase-contrast MR angiographic signal consists mostly of signals from the absolute velocity, the segmentation matched best with these time frames. In contrast to previous studies where EVV was expressed as a percentage of the segmented aortic volume, EVV was directly quantified to minimize the influence of the LV segmentation. A recent study did not find significant differences in LV kinetic energy between time-averaged and time-resolved segmentations in patients with abnormal cardiac function (28), further supporting the application of time-averaged segmentations. Recent efforts have focused on automatic creation of time-resolved whole-heart segmentations, which would overcome intra- and interobserver differences in EVV quantification, but this technology is not widely available yet (29). The limited temporal resolution and the time-averaged segmentation may be reasons for the inability to distinguish between E- and A-waves in diastole. A more in-depth mitral flow analysis using valve tracking technology (30) is warranted to further elucidate diastolic blood flow behavior in HCM.
Test-retest investigation of EVV quantification was outside the scope of this study. It should be kept in mind that EVV is a parameter derived from volumetric velocity magnitude data and that the reproducibility of the derivations has been investigated previously. For example, Kamphuis et al showed good 4D flow MRI in-scan and strong rescan reproducibility of LV in- and outflow in healthy subjects (31). Uribe et al showed good reproducibility of 4D flow MRI–derived stroke volume in the aorta (32). Stoll et al showed stable and repeatable LV flow components and kinetic energy over time in healthy volunteers (33). Future studies are warranted to provide insights into reproducibility of LV 4D flow MRI in cardiac patients in general and patients with HCM in particular.
In practice, the technology to create 3D maps of EVV requires atlases of control data. Multicenter studies are needed to investigate whether atlases would present differences between centers or that data can be pooled to create robust atlases tailored for vendor, field strength, age, and sex. Initial results on these matters for aortic 4D flow MRI showed that a quantitative analysis between 1.5 T and 3 T was identical (34) and that age differences are present when creating atlases of different age categories (13). Furthermore, sex differences were found in peak systolic aortic velocity profiles (35). Thus, future studies are needed to investigate these differences in LV velocity profiles to establish optimized atlases that can be used by other centers.
Apart from the semiautomatic segmentation, the pipeline of creating the control atlas is fully automated and takes about 5 seconds per included subject (eg, 11 controls take approximately 55 seconds on a standard desktop computer). Note that the creation of the atlas has to be performed only once for repeated use but can be regenerated easily when more subjects are added. The creation of EVV maps is fully automated with a calculation time of about 5 seconds, which is important in clinical use. The minimal manual interaction in this pipeline ensures limited variability in atlas or EVV map shape or quantitative information, which is supported by the good intra- and interobserver intraclass correlation coefficients.
In conclusion, LV velocity heat maps provide hemodynamic information that correlates with structural and functional changes associated with HCM (respectively, LVOT diameter and the presence of SAM or MR). Overall, the approach provides unique, concise, and comprehensive information regarding LV velocity profiles that may prove useful in classifying the degree of systolic and diastolic dysfunction in HCM.
Disclosures of Conflicts of Interest: J.T.P. disclosed no relevant relationships. B.D.A. Activities related to the present article: disclosed no relevant relationships. Activities not related to the present article: consultant for Tempus; received grant funding from RSNA Resident Research Grant. Other relationships: disclosed no relevant relationships. A.J.B. disclosed no relevant relationships. R.O.B. Activities related to the present article: received grant funding from the National Institutes of Health. Activities not related to the present article: disclosed no relevant relationships. Other relationships: disclosed no relevant relationships. L.C. disclosed no relevant relationships. J.C.C. Activities related to the present article: disclosed no relevant relationships. Activities not related to the present article: consultant for Siemens, GE, Circle, Bayer, and Guerbet; received grant funding through Guerbet, Bayer, and Siemens; received payments for lectures from Circle, Guerbet, and Bayer. Other relationships: disclosed no relevant relationships. M.M. disclosed no relevant relationships. P.v.O. disclosed no relevant relationships.
Abbreviations:
- EVV
- elevated velocity volume
- 4D
- four-dimensional
- HCM
- hypertrophic cardiomyopathy
- LV
- left ventricle
- LVOT
- LV outflow tract
- MR
- mitral regurgitation
- SAM
- systolic anterior motion
- SSFP
- steady-state free precession
- 3D
- three-dimensional
References
- 1.Maron BJ, Maron MS. Hypertrophic cardiomyopathy. Lancet 2013;381(9862):242–255. [DOI] [PubMed] [Google Scholar]
- 2.Semsarian C, Ingles J, Maron MS, Maron BJ. New perspectives on the prevalence of hypertrophic cardiomyopathy. J Am Coll Cardiol 2015;65(12):1249–1254. [DOI] [PubMed] [Google Scholar]
- 3.Shah PM. Hypertrophic cardiomyopathy and diastolic dysfunction. J Am Coll Cardiol 2003;42(2):286–287. [DOI] [PubMed] [Google Scholar]
- 4.Nagueh SF, Smiseth OA, Appleton CP, et al. Recommendations for the evaluation of left ventricular diastolic function by echocardiography: an update from the American Society of Echocardiography and the European Association of Cardiovascular Imaging. Eur Heart J Cardiovasc Imaging 2016;17(12):1321–1360. [DOI] [PubMed] [Google Scholar]
- 5.Choudhury L, Mahrholdt H, Wagner A, et al. Myocardial scarring in asymptomatic or mildly symptomatic patients with hypertrophic cardiomyopathy. J Am Coll Cardiol 2002;40(12):2156–2164. [DOI] [PubMed] [Google Scholar]
- 6.Chan RH, Maron BJ, Olivotto I, et al. Prognostic value of quantitative contrast-enhanced cardiovascular magnetic resonance for the evaluation of sudden death risk in patients with hypertrophic cardiomyopathy. Circulation 2014;130(6):484–495. [DOI] [PubMed] [Google Scholar]
- 7.Weng Z, Yao J, Chan RH, et al. Prognostic Value of LGE-CMR in HCM: a meta-analysis. JACC Cardiovasc Imaging 2016;9(12):1392–1402. [DOI] [PubMed] [Google Scholar]
- 8.Töger J, Kanski M, Carlsson M, et al. Vortex ring formation in the left ventricle of the heart: analysis by 4D flow MRI and Lagrangian coherent structures. Ann Biomed Eng 2012;40(12):2652–2662. [DOI] [PubMed] [Google Scholar]
- 9.Jeong D, Anagnostopoulos PV, Roldan-Alzate A, et al. Ventricular kinetic energy may provide a novel noninvasive way to assess ventricular performance in patients with repaired tetralogy of Fallot. J Thorac Cardiovasc Surg 2015;149(5):1339–1347. [DOI] [PMC free article] [PubMed] [Google Scholar]
- 10.Eriksson J, Bolger AF, Ebbers T, Carlhäll CJ. Four-dimensional blood flow-specific markers of LV dysfunction in dilated cardiomyopathy. Eur Heart J Cardiovasc Imaging 2013;14(5):417–424. [DOI] [PMC free article] [PubMed] [Google Scholar]
- 11.Elbaz MSM, Calkoen EE, Westenberg JJM, Lelieveldt BPF, Roest AAW, van der Geest RJ. Vortex flow during early and late left ventricular filling in normal subjects: quantitative characterization using retrospectively-gated 4D flow cardiovascular magnetic resonance and three-dimensional vortex core analysis. J Cardiovasc Magn Reson 2014;16(1):78. [DOI] [PMC free article] [PubMed] [Google Scholar]
- 12.Allen BD, Choudhury L, Barker AJ, et al. Ascending aorta flow derangement is a marker of outflow obstruction in hypertrophic cardiomyopathy. J Cardiovasc Magn Reson 2014;16(Suppl 1):P293. [Google Scholar]
- 13.van Ooij P, Garcia J, Potters WV, et al. Age-related changes in aortic 3D blood flow velocities and wall shear stress: implications for the identification of altered hemodynamics in patients with aortic valve disease. J Magn Reson Imaging 2016;43(5):1239–1249. [DOI] [PMC free article] [PubMed] [Google Scholar]
- 14.Allen BD, Choudhury L, Barker AJ, et al. Three-dimensional haemodynamics in patients with obstructive and non-obstructive hypertrophic cardiomyopathy assessed by cardiac magnetic resonance. Eur Heart J Cardiovasc Imaging 2015;16(1):29–36. [DOI] [PMC free article] [PubMed] [Google Scholar]
- 15.van Ooij P, Allen BD, Contaldi C, et al. 4D flow MRI and T1-mapping: assessment of altered cardiac hemodynamics and extracellular volume fraction in hypertrophic cardiomyopathy. J Magn Reson Imaging 2016;43(1):107–114. [DOI] [PMC free article] [PubMed] [Google Scholar]
- 16.van Ooij P, Powell AL, Potters WV, Carr JC, Markl M, Barker AJ. Reproducibility and interobserver variability of systolic blood flow velocity and 3D wall shear stress derived from 4D flow MRI in the healthy aorta. J Magn Reson Imaging 2016;43(1):236–248. [DOI] [PMC free article] [PubMed] [Google Scholar]
- 17.Heitner J, Bhumireddy GP, Crowley AL, et al. Clinical application of cine-MRI in the visual assessment of mitral regurgitation compared to echocardiography and cardiac catheterization. PLoS One 2012;7(7):e40491. [DOI] [PMC free article] [PubMed] [Google Scholar]
- 18.Bock J, Kreher W, Hennig J, Markl M. Optimized pre-processing of time-resolved 2D and 3D phase contrast MRI data [abstr]. In: Proceedings of the Fifteenth Meeting of the International Society for Magnetic Resonance in Medicine. Berkeley, Calif: International Society for Magnetic Resonance in Medicine, 2007; 3138. [Google Scholar]
- 19.Rose MJ, Jarvis K, Chowdhary V, et al. Efficient method for volumetric assessment of peak blood flow velocity using 4D flow MRI. J Magn Reson Imaging 2016;44(6):1673–1682. [DOI] [PMC free article] [PubMed] [Google Scholar]
- 20.van Ooij P, Potters WV, Nederveen AJ, et al. A methodology to detect abnormal relative wall shear stress on the full surface of the thoracic aorta using four-dimensional flow MRI. Magn Reson Med 2015;73(3):1216–1227. [DOI] [PMC free article] [PubMed] [Google Scholar]
- 21.Cibis M, Bustamante M, Eriksson J, Carlhäll CJ, Ebbers T. Creating hemodynamic atlases of cardiac 4D flow MRI. J Magn Reson Imaging 2017;46(5):1389–1399. [DOI] [PMC free article] [PubMed] [Google Scholar]
- 22.Veselka J, Anavekar NS, Charron P. Hypertrophic obstructive cardiomyopathy. Lancet 2017;389(10075):1253–1267. [DOI] [PubMed] [Google Scholar]
- 23.Hensley N, Dietrich J, Nyhan D, Mitter N, Yee MS, Brady M. Hypertrophic cardiomyopathy: a review. Anesth Analg 2015;120(3):554–569. [DOI] [PubMed] [Google Scholar]
- 24.Geske JB, Sorajja P, Nishimura RA, Ommen SR. Evaluation of left ventricular filling pressures by Doppler echocardiography in patients with hypertrophic cardiomyopathy: correlation with direct left atrial pressure measurement at cardiac catheterization. Circulation 2007;116(23):2702–2708. [DOI] [PubMed] [Google Scholar]
- 25.Garg P, van der Geest RJ, Swoboda PP, et al. Left ventricular thrombus formation in myocardial infarction is associated with altered left ventricular blood flow energetics. Eur Heart J Cardiovasc Imaging 2019;20(1):108–117. [DOI] [PMC free article] [PubMed] [Google Scholar]
- 26.Chu L, Corona-Villalobos CP, Gulsun MA, et al. Evaluation of left ventricular outflow tract obstruction with 4D phase contrast in patients with hypertrophic cardiomyopathy. J Cardiovasc Magn Reson 2014;16(S1):P312. [Google Scholar]
- 27.Chu LC, Porter KK, Corona-Villalobos CP, et al. Evaluation of left ventricular outflow tract obstruction with four-dimensional phase contrast magnetic resonance imaging in patients with hypertrophic cardiomyopathy-a pilot study. J Comput Assist Tomogr 2016;40(6):937–940. [DOI] [PubMed] [Google Scholar]
- 28.Hussaini SF, Rutkowski DR, Roldán-Alzate A, François CJ. Left and right ventricular kinetic energy using time-resolved versus time-average ventricular volumes. J Magn Reson Imaging 2017;45(3):821–828. [DOI] [PubMed] [Google Scholar]
- 29.Bustamante M, Gupta V, Carlhäll CJ, Ebbers T. Improving visualization of 4D flow cardiovascular magnetic resonance with four-dimensional angiographic data: generation of a 4D phase-contrast magnetic resonance CardioAngiography (4D PC-MRCA). J Cardiovasc Magn Reson 2017;19(1):47. [DOI] [PMC free article] [PubMed] [Google Scholar]
- 30.Westenberg JJM, Roes SD, Ajmone Marsan N, et al. Mitral valve and tricuspid valve blood flow: accurate quantification with 3D velocity-encoded MR imaging with retrospective valve tracking. Radiology 2008;249(3):792–800. [DOI] [PubMed] [Google Scholar]
- 31.Kamphuis VP, van der Palen RLF, de Koning PJH, et al. In-scan and scan-rescan assessment of LV in- and outflow volumes by 4D flow MRI versus 2D planimetry. J Magn Reson Imaging 2018;47(2):511–522. [DOI] [PMC free article] [PubMed] [Google Scholar]
- 32.Uribe S, Beerbaum P, Sørensen TS, Rasmusson A, Razavi R, Schaeffter T. Four-dimensional (4D) flow of the whole heart and great vessels using real-time respiratory self-gating. Magn Reson Med 2009;62(4):984–992. [DOI] [PubMed] [Google Scholar]
- 33.Stoll VM, Loudon M, Eriksson J, et al. Test-retest variability of left ventricular 4D flow cardiovascular magnetic resonance measurements in healthy subjects. J Cardiovasc Magn Reson 2018;20(1):15. [DOI] [PMC free article] [PubMed] [Google Scholar]
- 34.Strecker C, Harloff A, Wallis W, Markl M. Flow-sensitive 4D MRI of the thoracic aorta: comparison of image quality, quantitative flow, and wall parameters at 1.5 T and 3 T. J Magn Reson Imaging 2012;36(5):1097–1103. [DOI] [PubMed] [Google Scholar]
- 35.Garcia J, van der Palen RLF, Bollache E, et al. Distribution of blood flow velocity in the normal aorta: effect of age and gender. J Magn Reson Imaging 2018;47(2):487–498. [DOI] [PMC free article] [PubMed] [Google Scholar]


