

Abstract
Several studies investigated the appearance of intrapulmonary lymph nodes (IPLNs) at CT with pathologic correlation. IPLNs are benign lesions and do not require follow-up after initial detection. There are indications that IPLNs represent a considerable portion of incidentally found pulmonary nodules seen at high-resolution CT. The reliable and accurate identification of IPLNs as benign nodules may substantially reduce the number of unnecessary follow-up CT examinations. Typical CT features of IPLNs are a noncalcified solid nodule with sharp margins; a round, oval, or polygonal shape; distanced 15 mm or less from the pleura; and most being located below the level of the carina. The term perifissural nodule (PFN) was coined based on some of these characteristics. Standardization of those CT criteria are a prerequisite for accurate nodule classification. However, four different definitions of PFNs can currently be found in the literature. Furthermore, there is considerable variation in the reported interobserver agreement, malignancy rate, and prevalence of PFNs. The purpose of this review was to provide an overview of what is known about PFNs. In addition, knowledge gaps in defining PFNs will be discussed. A decision tree to guide clinicians in classifying nodules as PFNs is provided.
Supplemental material is available for this article.
© RSNA, 2020
See also the commentary by White and Rubin in this issue.
Summary
Nonuniform literature descriptions of what defines an intrapulmonary lymph node currently contribute to observer variability and risk of misclassification; the high prevalence of intrapulmonary lymph nodes as cause of nodules incidentally seen at chest CT makes them an important and an attractive subject to reduce follow-up CT studies, provided a safe definition is uniformly applied.
Essentials
■ The authors provide an overview of perifissural nodules (PFNs) and discuss the gaps in knowledge in defining PFNs.
■ Intrapulmonary lymph nodes (IPLNs) are more common than previously thought and can be morphologically distinguished from malignancies on CT.
■ IPLNs are generally characterized on CT as noncalcified solid nodules with sharp margins; a round, oval, or polygonal shape; distanced 15 mm or less from the pleura; and a diameter of 12 mm or less.
■ The term perifissural nodule has a short history with four varying definitions based on different combinations of typical IPLN CT features.
■ All recommendations for classification and management of PFNs are presented in a decision tree.
Introduction
The lungs consist of an extensive lymphatic network to remain dry and healthy (1). Intrapulmonary lymph nodes (IPLNs) are located within the lung parenchyma, thus excluding peribronchial nodes and nodes in the mediastinum. Although IPLNs likely do not represent the majority of benign nodules (2–4), radiopathologic studies have consistently recorded several morphologic characteristics, which enables the accurate identification of these nodules (2,3,5–14). Ahn et al (15) coined the term perifissural nodule (PFN) to represent the CT presentation of IPLNs and were the first to show that nodules classified as PFNs were never malignant. Exempting such nodules from extra follow-up could reduce the number of unnecessary follow-up CT scans.
The recommendation to not further investigate PFNs is given by latest nodule management guidelines from the British Thoracic Society (16), Fleischner Society (17), and American College of Radiology (18), but there is no mention of PFNs in the American College of Chest Physicians (19) or National Comprehensive Cancer Network guidelines (20). To provide a comprehensive overview of the literature concerning PFNs, we reviewed the reasoning behind the definition of a PFN, the performance of radiologists classifying nodules as PFNs, and the reported prevalence of PFNs.
Radiopathologic Correlation of IPLNs
Summary Points
1. Eleven studies, nine of which were published before 2008, investigated the CT features of pathologically confirmed IPLNs.
2. IPLNs are predominantly well-defined noncalcified solid nodules up to 12 mm in diameter located in the middle or lower lobes.
3. Almost all IPLNs were within 15 mm of the pleura, half of which were attached; most studies did not explicitly mention fissures.
4. Lack of arterial attachment may be used to distinguish IPLNs from adenocarcinomas.
Although all lung lymphatics ultimately drain to the hilar lymph nodes, the flow occurs in two opposite directions: While the central lymph drainage follows arteries and airways toward the larger bronchi bifurcations, the peripheral lymph drainage accompanies the interlobular septa toward the visceral pleura (Fig 1) (21–23). It has been observed that the pulmonary lymphatic drainage rate is higher toward the periphery and lower lobes due to respiration movements and gravity, respectively (22,24). Whereas bronchopulmonary lymph nodes are common down to the third or fourth generation of bronchi, pathology textbooks note that IPLNs are rarely found (22–27).
Figure 1:
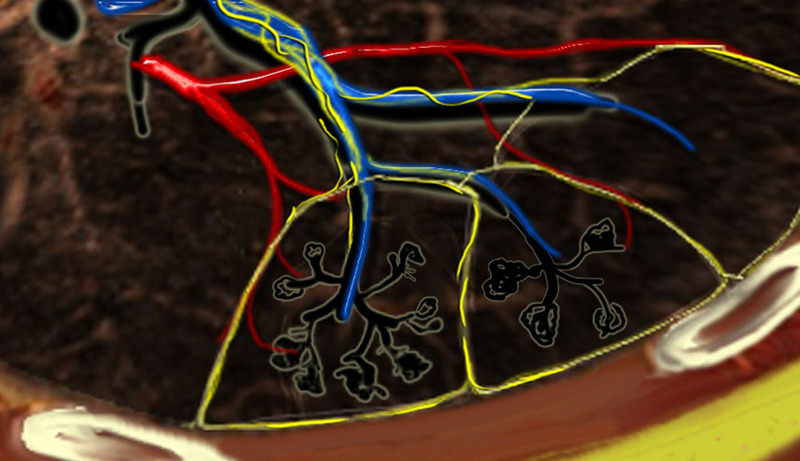
Secondary lobules. The centrilobular artery (blue) and the terminal bronchiole run in the center. Lymphatics (yellow) and veins (red) run within the interlobular septa. (Reprinted, with permission, from reference 23.)
Several radiopathologic studies on IPLNs have been published (largest sample size = 62) (Table E1 [supplement]) (2,3,5–14). The pooled results reveal that the majority of IPLNs are located in the middle or lower lobes (86% [247 of 287]), have a solid attenuation (99% [198 of 200]), and have sharp borders (98% [193 of 197]). Sizes larger than 15 mm have been described, but the majority are not larger than 12 mm. The shape of IPLNs is usually identified from the transverse CT images and can be grouped into three similarly sized categories: round, oval, and angular (or polygonal).
Studies indicate that roughly half of IPLNs are attached to the visceral pleura (Table E1 [supplement]). The distance of the lesion from the pleura is reported to be within 15 mm from the pleura for 96% (259 of 271) to 99% (267 of 271) of IPLNs and to be within 10 mm for 88% (238 of 271) to 94% (255 of 271). Different descriptions for “pleura” were likely used: Only two studies explicitly mentioned IPLNs attached to major fissures as separate from those attached to the pleura (8,10).
Extending linear densities from the lesion to the pleura have been described as early as 1985 (5), but there is a discrepancy on what linear densities represent anatomically (thickened interlobular septa, ectatic lymph channels, or veins). This may have led to the large variance in observed frequencies of concomitant linear densities (5%–100%). The most recent and largest CT study on IPLNs did not explicitly use the term linear density but included an image showing such a structure attached to an IPLN (14).
Classification of a PFN at CT
Summary Points
1. The term perifissural nodule was coined in 2010 and originally required the nodule to be distanced no more than 5 mm from a fissure.
2. In total, four PFN criteria have been described from seven studies in which criteria were reported.
3. All studies agreed that only noncalcified solid nodules with sharp borders and a regular shape may be considered PFNs.
4. The three newer criteria allow PFNs to be located more than 5 mm from a fissure; the two most recent criteria consider distance from the pleura instead of the fissure.
5. Maximum nodule size or lobe location have not been included in PFN criteria.
PFNs are the CT representation of IPLNs. Review of the literature shows that CT features used to classify opacities as PFNs vary considerably across studies (Table 1). The first study to define PFNs (15) discussed that benign noncalcified nodules were more likely to be solid (28), polygonally shaped (28), have a long- to short-axis diameter ratio (aspect ratio) of greater than 1.78 (28), be in a subpleural location (28), do not grow (29–31), have smooth margins (31), and have vascular, fissure, or pleural attachments (31). The authors subsequently defined PFNs as “a subset of [non-calcified lung nodules] that were solid, well circumscribed, smoothly marginated, and either in contact with or within 5 mm of a major, minor, or accessory fissure” (Table 1) (15). The reason for omitting most of the benign characteristics from their definition was justified by the focus of the study: to investigate the malignancy potential of nodules adjacent to fissures. With the option to consult another radiologist when in doubt, one radiologist classified 234 of 837 noncalcified nodules as PFNs (28%) (15); none of the nodules classified as PFNs were found to be malignant within the 7.5-year follow-up period.
Table 1:
Perifissural Nodule Definitions across Studies

de Hoop et al (32) validated this finding in the Dutch-Belgian Randomized Lung Cancer Screening Trial (NELSON) and additionally investigated the natural course of PFNs (33). A new definition that distinguished between typical and atypical PFNs was introduced, the latter being less narrowly defined by adding shape limitations and removing fissure dependency (Table 1, Fig 2). In this study, 4026 noncalcified nodules were independently evaluated by two blinded independent groups of three trained medical students each. Disagreements were arbitrated by a radiology researcher, necessary in 5% of the nodules (200 of 4026). A total of 20% (794 of 4026) were classified as typical PFNs and 3% (125 of 4026) as atypical PFNs, of which one-third (42 of 125) were not attached to a fissure. Six percent of the fissure-attached nodules (230 of 4026) were classified as non-PFN. Despite 16% of the typical PFNs (123 of 794) and atypical PFNs (20 of 125) showing growth, none developed into a malignancy within 5.5 years.
Figure 2:
![Visual guidelines on classifying a nodule as a PFN according to de Hoop et al (32). A typical PFN was defined as “[a] fissure-attached, homogeneous, solid nodule that had smooth margins and an oval, lentiform, or triangular shape.” Atypical PFNs “either met all [typical PFN] features but were not attached to a fissure or were fissure-attached nodules, convex on one side and rounded on the other.” (Reprinted, with permission, from reference 32). PFN = perifissural nodule.](https://cdn.ncbi.nlm.nih.gov/pmc/blobs/2bea/7978000/0964b3f36ecd/ryct.2020190159.fig2.jpg)
Visual guidelines on classifying a nodule as a PFN according to de Hoop et al (32). A typical PFN was defined as “[a] fissure-attached, homogeneous, solid nodule that had smooth margins and an oval, lentiform, or triangular shape.” Atypical PFNs “either met all [typical PFN] features but were not attached to a fissure or were fissure-attached nodules, convex on one side and rounded on the other.” (Reprinted, with permission, from reference 32). PFN = perifissural nodule.
A subsequent study used scans from the second, third, and final NELSON screening rounds to investigate the number of PFNs among new nodules (34). Two radiologists independently classified all included nodules as PFN or non-PFN using the criteria by de Hoop et al (32). Only fissure-attached nodules were included in their study, which excluded 93% (1377 of 1484) of new solid nodules. Of the 97 included nodules, 58 (60%) were classified as PFNs; none of the 10 malignancies were classified as PFNs.
The study by Mets et al (35) concluded that findings from PFN morphology and prevalence from screening cohorts could be applied to the clinic. They used a nested cohort containing all 228 patients with incident lung cancer and 684 randomly selected controls. Their PFN definition combined criteria from the two previous studies: eligible lesions were those distanced within 15 mm of the pleura or fissure and had an oval or triangular shape (Table 1). As defined by a single trained reader, 21% (262 of 1278) were classified as PFNs (12% [69 of 599] among the patients with lung cancer; 28% [193 of 679] among the controls). For those with follow-up scans, growth was observed in 21% (six of 28). No PFN was linked to a registered lung cancer within the median follow-up period of 53 months.
From the studies described to this point (15,32,34,35), six components were used to define a nodule as a PFN: attenuation, consistency, borders, shape, relation to a fissure, and relation to the pleura. All studies agree that prerequisites for PFNs are noncalcified solid nodules with sharp borders and a regular shape. Most PFN shapes were found to be triangular (44% [102 of 234]) or ovoid (42% [98 of 234]), while a minority were round (8% [18 of 234]), rectangular (6% [13 of 234]), or dumbbell shaped (1% [three of 234]) (15). There is no agreement regarding the maximum allowed distance from a fissure: Han et al applied 0 mm (34), Ahn et al applied 5 mm (15), Mets et al 15 mm (35), and de Hoop et al any distance (atypical PFNs) (32). Only Mets et al (35) included the relationship to the pleura in their definition. Nodule growth was not considered an exclusion criterion for PFNs (assuming all criteria continue to be met) (32,35).
PFNs: Surely Benign?
Summary Points
1. Most studies concluded that none of the nodules classified as PFNs turned out to become malignant; these studies included a very small sample of malignant nodules and did not investigate variability between expert readers.
2. One study from 2018 showed that agreement between experienced radiologists is fair to moderate and that there is a small chance of misclassifying cancers as PFNs.
3. Most misclassified cancer nodules were located in the upper lobes (11 of 13, 85%) and classified as atypical PFNs (16 of 21, 76%).
4. It was estimated that 0%–0.43% of cancers would be misclassified as PFNs in a lung cancer screening setting.
Despite the different definitions, Ahn et al (15), de Hoop et al (32), and Han et al (34) reported that none of the nodules classified as PFNs turned out to be cancer. However, the percentage of malignancies were 1% (10 of 837), approximately 2% (exact frequencies not reported), and 10% (10 of 97), respectively. This means that the probability of classifying cancers as PFNs was small, simply because they were rare. Mets et al (35) used a nested cohort where 27% of the included patients (186 of 697) were incidentally diagnosed with lung cancer; however, the number of annotated nodules at CT traceable to a registered lung cancer was not reported. Only two studies applied more than one observer (32,34).
Schreuder et al (36) quantified both the interobserver agreement and the risk of misclassifying small solid malignant nodules as PFNs. They showed that the agreement among experienced radiologists is fair to moderate and that the chance of a PFN turning out to be cancer is small, but not zero. All solid lung cancer nodules with a diameter between 5 and 10 mm (n = 81) and 278 randomly selected benign nodules from the National Lung Screening Trial (NLST) were included (36). Six experienced chest radiologists were instructed to distinguish between PFNs and non-PFNs (Table 1). Morphologic definitions were provided but not individually documented because observers used their “intuition” throughout the reading to approximate the clinical routine. Each observer’s performance is shown in Figure 3. Nineteen percent of the cancers (13 of 70) were misclassified by at least one reader as a PFN, and two cancers (two of 70, 3%) were misclassified by three readers. The cancer misclassification rate ranged from 0% (0 of 125) to 5% (eight of 163). The main limitation of that study was that most CT studies were obtained with 2-mm slice thickness, preventing proper assessment of the coronal and sagittal planes.
Figure 3:

Results of six readers who participated in the study by Schreuder et al (36). Readers classified a set of preselected nodules as either PFN or non-PFN while blinded to whether the nodule was benign or malignant. Reader E classified 155 of 246 (63%) benign nodules and eight of 70 (11%) cancers as PFNs; Reader F classified 125 of 246 (51%) benign nodules as PFNs without misclassifying any cancers. (Reprinted, with permission, from reference 36). PFN = perifissural nodule.
Furthermore, that study showed that all but two of the 13 nodules misclassified at least once were located in the upper lobes, and the error rate was smaller for typical PFNs compared with atypical PFNs (0%–4% vs 0%–9%) (36). Combining all readings, less than 1% (five of 533) of all typical PFNs were malignancies, whereas this proportion was 4.8% (16 of 332) among atypical PFNs. It was estimated that the proportion of cancers diagnosed among nodules classified as PFNs in the NLST CT cohort would range from 0% to 0.43% (Equation E1 [supplement]).
How Often Do We See PFNs?
Summary Points
1. The prevalence of PFNs ranges from 1% to 66% of all nodules according to the literature.
2. Studies that primarily focused on PFNs identified proportionally more PFNs (≥23%) compared with studies in which this was a secondary objective (≤10%).
3. It was estimated that 24%–44% of noncalcified nodules would be classified as PFNs in a lung cancer screening setting.
To gauge the impact of including PFNs into nodule management guidelines, the final section of this review attempts to estimate the prevalence of PFNs. Numbers for prevalence of PFNs reported in the literature vary from 1% to 66% due to differing cohorts and methods (Table 2). Whereas only 1% of the nodules in the Pan-Canadian Early Detection of Lung Cancer Study (70 of 7008) were classified as PFNs, the British Columbia Cancer Agency study found a proportion of approximately 10% (501 of 5021) (38). The 10-fold difference in PFN prevalence was in the recognition that these nodules are likely benign, resulting in the reader’s reluctance to document their presence. Winkler Wille et al (39) classified 10% of the nodules (114 of 1152) in the Danish Lung Cancer Screening Trial CT cohort as PFNs (40), of which one turned out to be a lung cancer. Both studies did not provide methods used for identifying PFNs.
Table 2:
Summary of Studies Reporting Perifissural Nodule Prevalence

Two studies report the prevalence of PFNs in children younger than 13 years: Samim et al (41) used the PFN definition from de Hoop et al (32) but grouped typical and atypical PFNs together. A consensus reading classified 66% of the nodules (39 of 59) as PFNs. Verhagen et al (42) included children with extrathoracic malignancies in their study. A nodule was only considered a PFN if all four readers classified it as such. By using the definition from Mets et al (35), a PFN prevalence of 35% (36 of 103) was found. The authors concluded that PFNs are common in children and comparable in prevalence between those with and without known malignancies, and that extra caution should be taken to avoid labeling metastases as PFN.
In summary, Ahn et al (15) reported a higher prevalence (28% [234 of 837]) than de Hoop et al (32) (23% [919 of 4026]) (Table 2). The three cohorts that did not report their methods revealed the lowest PFN prevalence rates (10% [114 of 1152], 1% [70 of 7008], and 10% [501 of 5021]) (38,39). Among adult nested case-control studies (which tend to overestimate prevalence), Mets et al (35) reported a PFN prevalence rate of 44% (262 of 599) and Schreuder et al (36) 50% (159 of 316). Note that this finding by Schreuder et al (36) was based on agreement among at least three of the six readers; unanimous agreement would have resulted in 18% prevalence (56 of 316). Han et al (34) reported 4% (58 of 1484) among fissure-attached new solid nodules. Pooling the studies resulted in a PFN prevalence estimate of 12% (2392 of 20 605) (Table 2).
For completion, another estimation calculation was performed using the Schreuder et al (36) results. Considering the range of performances from six radiologists, the minimum and maximum prevalence of PFNs in the NLST was estimated to lie between 24% and 44% among all noncalcified nodules (Equation E2 [supplement]). The range of uncertainty reflects the observer variability of what is considered a PFN.
What We Know and What We Don’t
Summary Points
1. Whether a nodule is classified as a PFN or not depends on the PFN definition used and the observer.
2. The risk of misclassifying PFNs as malignancies can be minimized by limiting candidates to only well-defined solid nodules not attached to arteries and no larger than 12 mm; PFNs should display a typical shape in at least two orthogonal views and be fissure-attached or located in the middle or lower lobes within 15 mm of the pleura.
3. Recommendations for standardizing the classification of nodules as PFNs based on the current evidence were incorporated into a decision tree.
The morphologic criteria and the observer determine whether a nodule is classified as a PFN or not. Misclassifying a cancer as a PFN is likely to lead to a delay in diagnosis, and misclassifications are unavoidable on a large scale. The goal is to find a balance between correctly identifying as many benign PFNs as possible while keeping the probability of misclassifying malignancies as low as reasonably possible. In this section, we discuss the various gaps in knowledge and provide recommendations for clinicians based on the available evidence.
All PFN definitions agree that only noncalcified solid nodules with sharp borders and regular shapes may be considered for classification as PFNs (15,32,35,36). Besides those features, shape is the most important determinant of a PFN. While oval, triangular, and polygonal shapes are highly suggestive for IPLNs, roughly one-third are round (Table E1 [supplement]). However, both benign and malignant nodules may have round shapes due to unrestricted three-dimensional growth (2,9,14,28,29,31). Forbidding round nodules from being classified as PFNs may therefore increase interrater agreement and reduce false-positive PFN classifications.
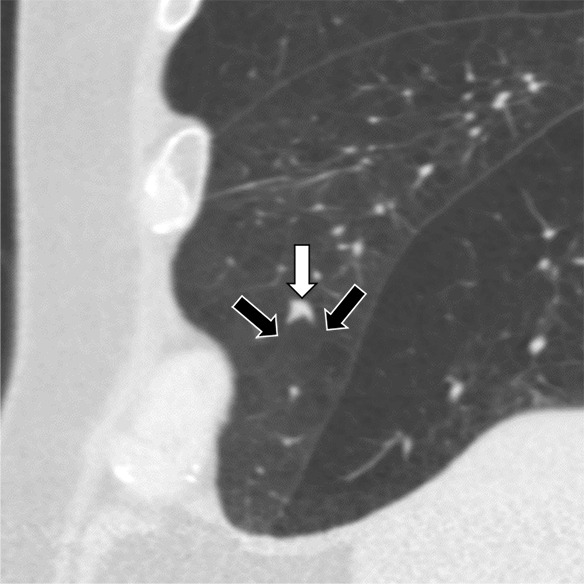
A limitation across all included studies was that only the two-dimensional nodule shape in one of the orthogonal planes was described, which can be an inaccurate representation of the nodule as a whole (Figs 4–6). No study has investigated the difference in classification performance in thin- versus thick-slice CT, nor the consequences of a protocol that mandates the assessment in all three orthogonal planes. However, such studies may be unnecessary now that it is common practice to obtain thin-slice CT (≤ 1.25 mm). Figures 4b, 5c, and 6a are examples of nodule cross-sections that may not be considered typical PFN shapes. We hereby advocate that a fissure-attached PFN should display a lentiform or polygonal shape in at least two orthogonal planes. For IPLNs that are not fissure-attached (juxtapleural), the nodules are unrestricted on all sides and are therefore hypothesized to be ovular in shape in all three orthogonal planes.
Figure 4a:
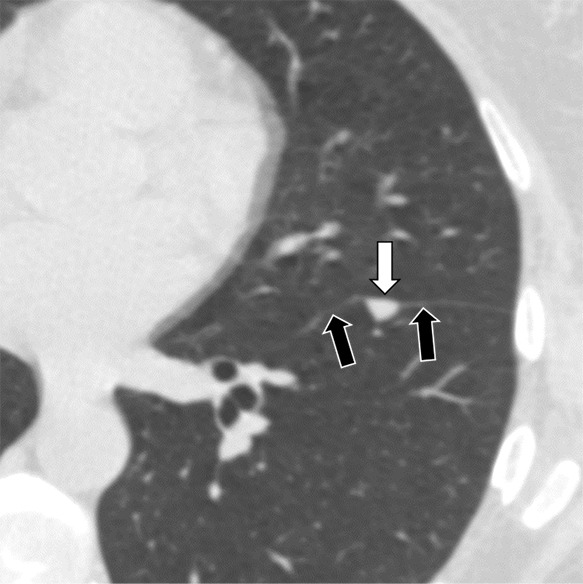
Three CT views of a nodule classified as a perifissural nodule. The shape is triangular in the (a) axial plane, triangular and/or round in the (b) coronal plane, and oval and/or lentiform in the (c) sagittal plane. The major fissure is not influenced by the nodule. The white arrows point at the nodule; the black arrows point at the attached fissure.
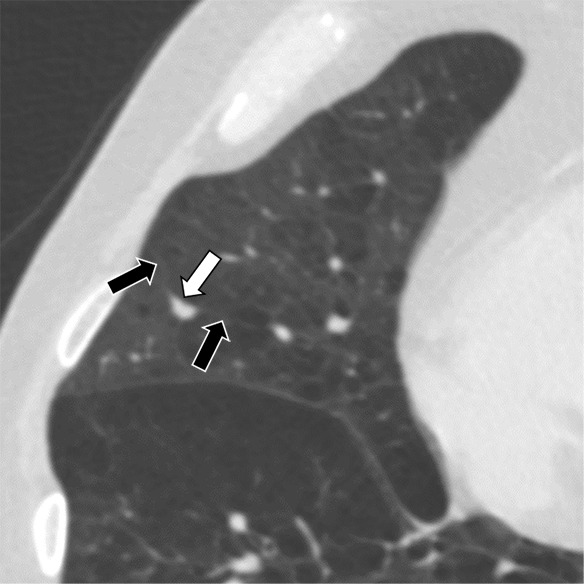
Figure 6a:
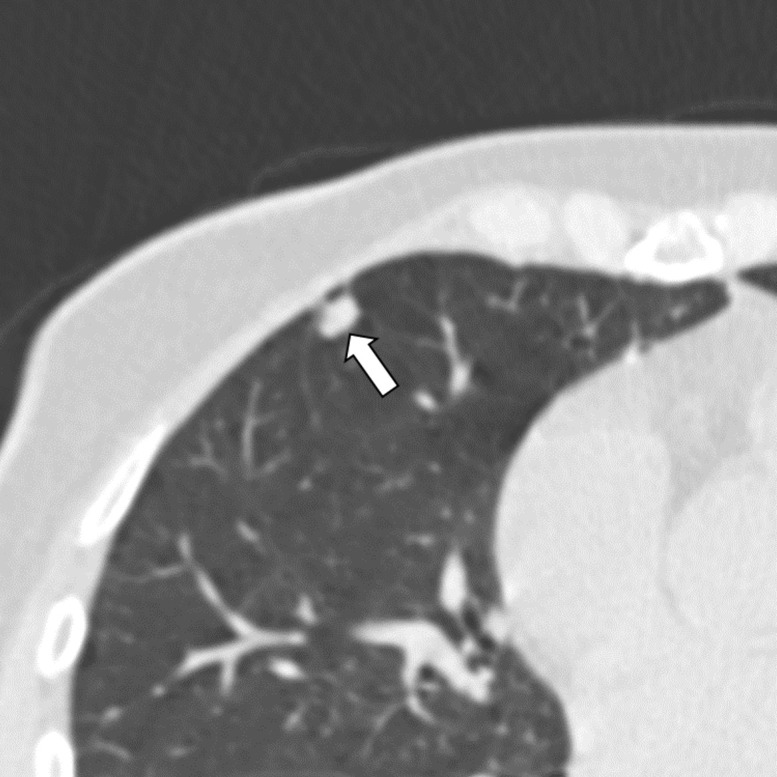
Three CT views of a nodule classified as a perifissural nodule. The shape is oval and/or polygonal, lentiform, and triangular in the (a) axial, (b) coronal, and (c) sagittal planes, respectively. It is located juxtapleurally but not perifissurally; this is a limitation to the term perifissural nodule. The white arrows point at the nodule.
Figure 4b:
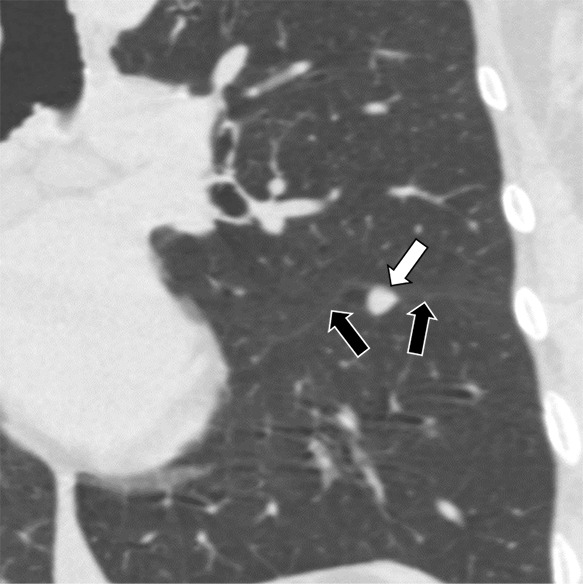
Three CT views of a nodule classified as a perifissural nodule. The shape is triangular in the (a) axial plane, triangular and/or round in the (b) coronal plane, and oval and/or lentiform in the (c) sagittal plane. The major fissure is not influenced by the nodule. The white arrows point at the nodule; the black arrows point at the attached fissure.
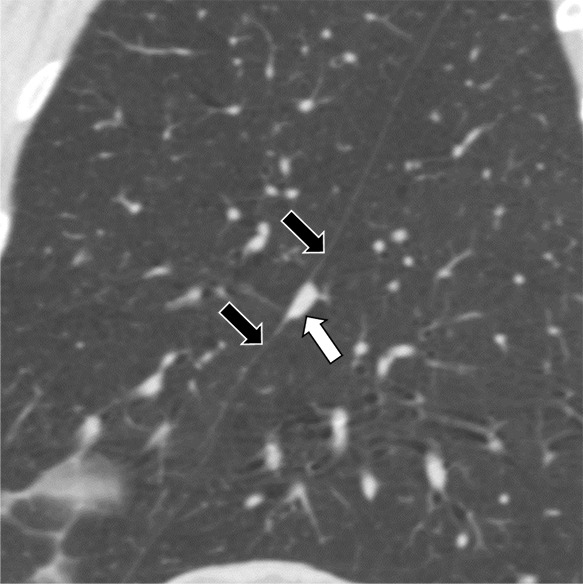
Figure 5c:
Three CT views of a nodule classified as a perifissural nodule. The shape is flat and/or oval in the (a) axial and (b) coronal planes and polygonal in the (c) sagittal plane. The nodule curves with the minor or accessory fissure. The white arrows point at the nodule; the black arrows point at the attached fissure.
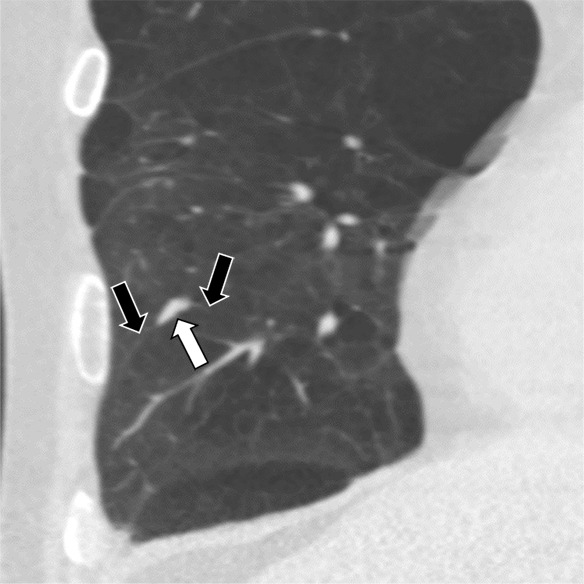
Figure 4c:
Three CT views of a nodule classified as a perifissural nodule. The shape is triangular in the (a) axial plane, triangular and/or round in the (b) coronal plane, and oval and/or lentiform in the (c) sagittal plane. The major fissure is not influenced by the nodule. The white arrows point at the nodule; the black arrows point at the attached fissure.
Figure 5a:
Three CT views of a nodule classified as a perifissural nodule. The shape is flat and/or oval in the (a) axial and (b) coronal planes and polygonal in the (c) sagittal plane. The nodule curves with the minor or accessory fissure. The white arrows point at the nodule; the black arrows point at the attached fissure.
Figure 5b:
Three CT views of a nodule classified as a perifissural nodule. The shape is flat and/or oval in the (a) axial and (b) coronal planes and polygonal in the (c) sagittal plane. The nodule curves with the minor or accessory fissure. The white arrows point at the nodule; the black arrows point at the attached fissure.
Figure 6b:
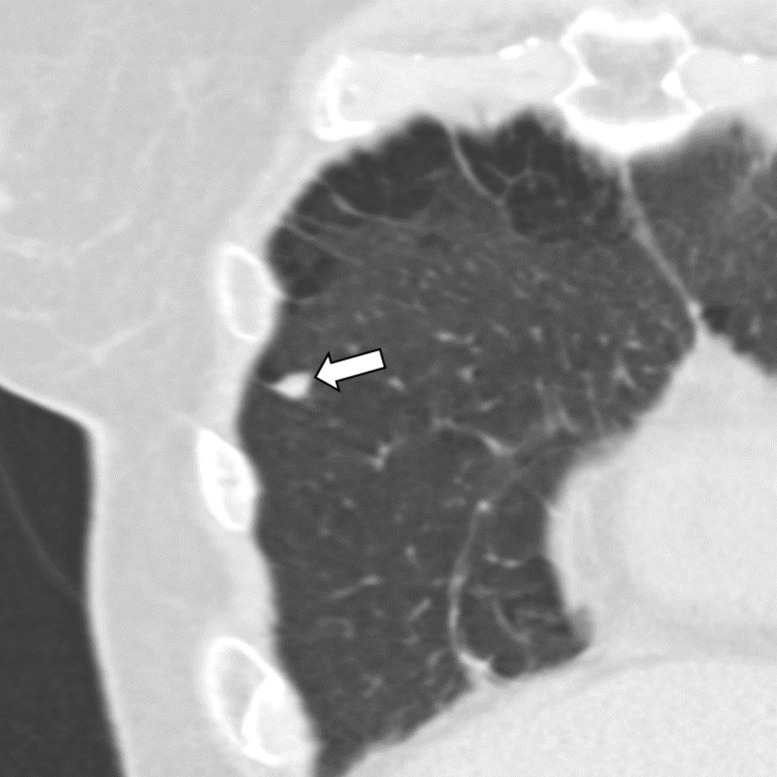
Three CT views of a nodule classified as a perifissural nodule. The shape is oval and/or polygonal, lentiform, and triangular in the (a) axial, (b) coronal, and (c) sagittal planes, respectively. It is located juxtapleurally but not perifissurally; this is a limitation to the term perifissural nodule. The white arrows point at the nodule.
Figure 6c:
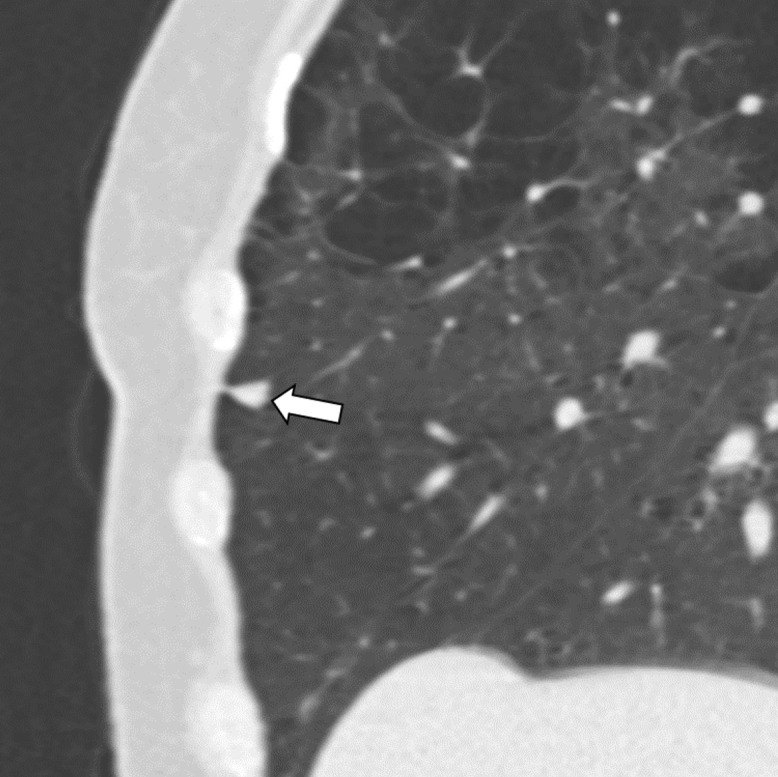
Three CT views of a nodule classified as a perifissural nodule. The shape is oval and/or polygonal, lentiform, and triangular in the (a) axial, (b) coronal, and (c) sagittal planes, respectively. It is located juxtapleurally but not perifissurally; this is a limitation to the term perifissural nodule. The white arrows point at the nodule.
No diameter restrictions have yet been applied for PFNs. There is a downward trend in the average IPLN size in the past 15 years which may reflect improvements in CT resolution (2,11–14). PFN studies using nonnested adult cohorts reported mean diameters no greater than 4.7 mm (15,32), which is less than the 6- or 8-mm threshold at which nodule guidelines begin to advise caution (16–20). We support the recommendation from two guidelines to exempt PFNs up to 10 mm in mean diameter (average diameter from two perpendicular measurements) from additional follow-up (16,18). Because a volume measurement is required to be able to calculate the mean diameter, we suggest a practical equivalent of 12 mm in maximum diameter using electronic calipers.
Extending linear densities was described as a reliable sign of benignity in two studies (2,9), but this finding was not consistently reproduced (Table E1 [supplement]). There is still no description of what extending linear densities are radiologically or what they represent pathologically. The extent that this feature influenced the radiologists’ decision in classifying nodules as PFNs remains unknown (36).
Among other structures, linear densities may represent vessels. Kawaguchi et al (13) and Barnett et al (14) described that adjacency or termination of one or multiple veins (and no arteries) was more common in IPLNs (50% and 94%, respectively) than malignancies (21% and 21%, respectively). The additional finding that 98% of adenocarcinomas were attached to some vessel (artery and/or vein) (14) suggests that linear densities may not be sufficiently discriminatory and should therefore not be used as a PFN criterion. The lack of an arterial attachment appears to be a very promising CT biomarker for distinguishing PFNs from malignancies, though perhaps not from metastases (14).
Two of the four definitions divided PFNs into “typical” from “atypical” subcategories (32,36). One did not result in any cancer misclassifications (32), while the other found that atypical PFNs had a fivefold higher risk of being a malignancy compared with typical PFNs (36). Subgrouping PFNs may provide the option to personalize follow-up recommendations or customize classification criteria.
Almost all included studies report the majority of IPLNs being in the middle or lower lobes or below the level of the carina (Table E1 [supplement]). The finding that 85% of the cancers misclassified as PFNs (11 of 13) were located in the upper lobes warrants caution, especially among atypical PFNs (36). Regarding pleural distance, the overwhelming majority of IPLNs (96%–99%) were within 15 mm of the visceral pleura (Table E1 [supplement]). The literature did not specify whether the pleura included fissures. This missing detail is important in retrospect because the fissure is key to the original definition of a PFN (15,32,34). Later definitions broadened the “fissure” criterion to include all visceral pleural surfaces (35,36) (Table 1). We acknowledge that non–fissure-attached IPLNs remain more difficult to distinguish from non-IPLNs due to their less-than-typical shape, for which we advise more stringent assessment criteria.
Literally, a “PFN” that is not close to a fissure is a misnomer (35,36). Juxtapleural nodule with benign features would be a more accurate term for nodules close to any pleural surface (43). However, introducing a new term at this point may only generate more confusion. Rather, it is vital that future studies should specify which PFN criteria were used. We condensed all the recommendations discussed above into a decision tree to determine whether a CT-detected nodule should be considered a PFN (Fig 7). Among eligible nodules, different criteria apply depending on whether the nodule is fissure-attached or juxtapleural. No special treatment is required for new nodules (34).
Figure 7:
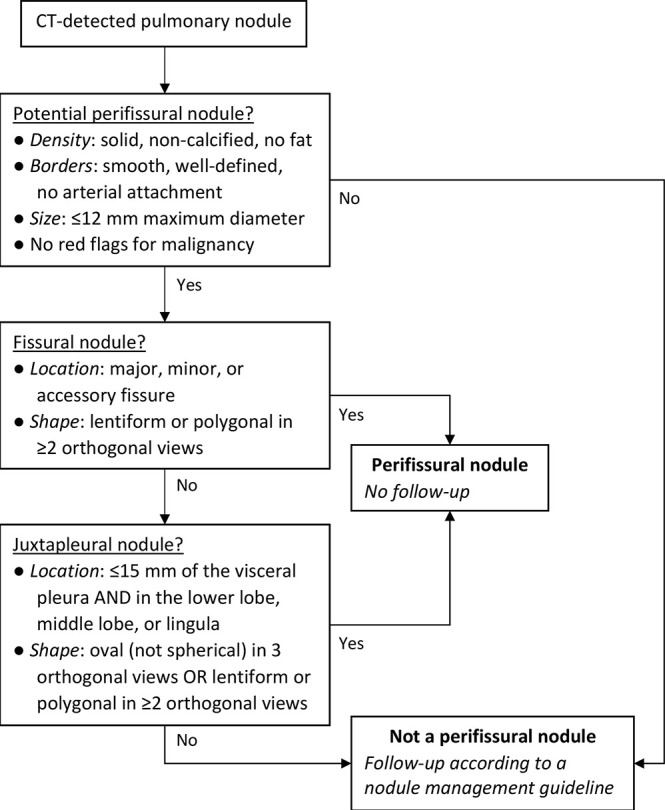
Decision tree for classifying a pulmonary nodule as a PFN. Different criteria apply depending on whether nodules are fissural or juxtapleural. We recommend no follow-up for PFNs. Red flags for malignancy include but are not limited to spiculation, retraction of the pleura or fissure, and appearing not to be influenced by other structures. PFN = perifissural nodule.
The evidence supporting the decision tree is limited and is largely based on expert opinion; a revision will likely be required in several years. Another way to improve the accuracy of classifying nodules as PFNs is with the support of computer algorithms. One study developed a network that achieved a PFN classification performance close to that of human observers (based on the definition by de Hoop et al [32]) (44).
The consensus is that IPLNs are often identifiable at CT as a subset of noncalcified solid nodules with sharp margins; a round, oval, or polygonal shape; and distanced within 15 mm from the pleura. Most are located in the middle or lower lobes and attached to veins but not arteries. Among the four existing definitions for classifying nodules as PFNs, there is disagreement on the inclusion of round nodules and distance from the fissure; limitations on size and lung lobe location were yet to be applied. Being a rare occurrence, there are gaps in knowledge on the causes of malignancies being misclassified as PFNs. After reviewing the available evidence, we developed a decision tree to provide clinicians with safe and structured guidance when classifying CT-detected nodules as PFNs that should subsequently be exempted from follow-up. We expect that this protocol would considerably decrease the number of unnecessary follow-up examinations while minimizing the risk of delaying the diagnosis of malignancies.
EQUATIONS AND TABLES
Disclosures of Conflicts of Interest: A.S. disclosed no relevant relationships. C.J. Activities related to the present article: disclosed no relevant relationships. Activities not related to the present article: institution received research grant from MeVis Medical Solutions and royalties from MeVis Medical Solutions for development of Veolity, a dedicated lung cancer screening workstation. Other relationships: disclosed no relevant relationships. E.T.S. disclosed no relevant relationships. B.v.G. disclosed no relevant relationships. C.M.S.P. Activities related to the present article: institution received grant from Durch Cancer Society (KWF); author receives royalties from Soringer, Elsevier, and Thieme for books. Activities not related to the present article: disclosed no relevant relationships. Other relationships: disclosed no relevant relationships. M.P. Activities related to the present article: disclosed no relevant relationships. Activities not related to the present article: institution receives grants from Canon Medical Systems and Siemens Healthineers; institution receives payment for lecture from Bracco, Bayer, and Siemens Healthineers. Other relationships: disclosed no relevant relationships.
Abbreviations:
- IPLN
- intrapulmonary lymph node
- NELSON
- Dutch-Belgian Randomized Lung Cancer Screening Trial
- NLST
- National Lung Screening Trial
- PFN
- perifissural nodule
References
- 1.Brotons ML, Bolca C, Fréchette E, Deslauriers J. Anatomy and physiology of the thoracic lymphatic system. Thorac Surg Clin 2012;22(2):139–153. [DOI] [PubMed] [Google Scholar]
- 2.Hyodo T, Kanazawa S, Dendo S, et al. Intrapulmonary lymph nodes: thin-section CT findings, pathological findings, and CT differential diagnosis from pulmonary metastatic nodules. Acta Med Okayama 2004;58(5):235–240. [DOI] [PubMed] [Google Scholar]
- 3.Yokomise H, Mizuno H, Ike O, Wada H, Hitomi S, Itoh H. Importance of intrapulmonary lymph nodes in the differential diagnosis of small pulmonary nodular shadows. Chest 1998;113(3):703–706. [DOI] [PubMed] [Google Scholar]
- 4.Honma K, Nelson G, Murray J. Intrapulmonary lymph nodes in South African miners--an autopsy survey. Am J Ind Med 2007;50(4):261–264. [DOI] [PubMed] [Google Scholar]
- 5.Kradin RL, Spirn PW, Mark EJ. Intrapulmonary lymph nodes. Clinical, radiologic, and pathologic features. Chest 1985;87(5):662–667. [DOI] [PubMed] [Google Scholar]
- 6.Bankoff MS, McEniff NJ, Bhadelia RA, Garcia-Moliner M, Daly BD. Prevalence of pathologically proven intrapulmonary lymph nodes and their appearance on CT. AJR Am J Roentgenol 1996;167(3):629–630. [DOI] [PubMed] [Google Scholar]
- 7.Miyake H, Yamada Y, Kawagoe T, Hori Y, Mori H, Yokoyama S. Intrapulmonary lymph nodes: CT and pathological features. Clin Radiol 1999;54(10):640–643. [DOI] [PubMed] [Google Scholar]
- 8.Matsuki M, Noma S, Kuroda Y, Oida K, Shindo T, Kobashi Y. Thin-section CT features of intrapulmonary lymph nodes. J Comput Assist Tomogr 2001;25(5):753–756. [DOI] [PubMed] [Google Scholar]
- 9.Sykes AM, Swensen SJ, Tazelaar HD, Jung SH. Computed tomography of benign intrapulmonary lymph nodes: retrospective comparison with sarcoma metastases. Mayo Clin Proc 2002;77(4):329–333. [DOI] [PubMed] [Google Scholar]
- 10.Oshiro Y, Kusumoto M, Moriyama N, et al. Intrapulmonary lymph nodes: thin-section CT features of 19 nodules. J Comput Assist Tomogr 2002;26(4):553–557. [DOI] [PubMed] [Google Scholar]
- 11.Ishikawa H, Koizumi N, Morita T, Tsuchida M, Umezu H, Sasai K. Ultrasmall intrapulmonary lymph node: usual high-resolution computed tomographic findings with histopathologic correlation. J Comput Assist Tomogr 2007;31(3):409–413. [DOI] [PubMed] [Google Scholar]
- 12.Wang CW, Teng YH, Huang CC, Wu YC, Chao YK, Wu CT. Intrapulmonary lymph nodes: computed tomography findings with histopathologic correlations. Clin Imaging 2013;37(3):487–492. [DOI] [PubMed] [Google Scholar]
- 13.Kawaguchi T, Sawabata N, Nakai T, et al. Clinical and pathological characteristics of surgically resected intrapulmonary lymph nodes: Can they be differentiated from other malignant nodules? Respir Investig 2018;56(6):473–479. [DOI] [PubMed] [Google Scholar]
- 14.Barnett J, Pulzato I, Wilson R, Padley S, Nicholson AG, Devaraj A. Perinodular Vascularity Distinguishes Benign Intrapulmonary Lymph Nodes From Lung Cancer on Computed Tomography. J Thorac Imaging 2019;34(5):326–328. [DOI] [PubMed] [Google Scholar]
- 15.Ahn MI, Gleeson TG, Chan IH, et al. Perifissural nodules seen at CT screening for lung cancer. Radiology 2010;254(3):949–956. [DOI] [PubMed] [Google Scholar]
- 16.Callister MEJ, Baldwin DR, Akram AR, et al. British Thoracic Society guidelines for the investigation and management of pulmonary nodules. Thorax 2015;70(Suppl 2):ii1–ii54 [Published correction appears in Thorax 2015;70(12):1188.]. [DOI] [PubMed] [Google Scholar]
- 17.MacMahon H, Naidich DP, Goo JM, et al. Guidelines for management of incidental pulmonary nodules detected on CT images: from the Fleischner Society 2017. Radiology 2017;284(1):228–243. [DOI] [PubMed] [Google Scholar]
- 18.Lung imaging reporting and data system (Lung-RADS). American College of Radiology. https://www.acr.org/Quality-Safety/Resources/LungRADS. Published 2019. Accessed August 6, 2019. [Google Scholar]
- 19.Gould MK, Donington J, Lynch WR, et al. Evaluation of individuals with pulmonary nodules: when is it lung cancer? Diagnosis and management of lung cancer, 3rd ed: American College of Chest Physicians evidence-based clinical practice guidelines. Chest 2013;143(5 Suppl):e93S–e120S. [DOI] [PMC free article] [PubMed] [Google Scholar]
- 20.Wood DE, Kazerooni EA, Baum SL, et al. Lung cancer screening, version 3.2018, NCCN Clinical Practice Guidelines in Oncology. J Natl Compr Canc Netw 2018;16(4):412–441. [DOI] [PMC free article] [PubMed] [Google Scholar]
- 21.Ellis H. Lungs: blood supply, lymphatic drainage and nerve supply. Anaesth Intensive Care 2008;9(11):462–463. [Google Scholar]
- 22.Schraufnagel DE. Lung lymphatic anatomy and correlates. Pathophysiology 2010;17(4):337–343. [DOI] [PubMed] [Google Scholar]
- 23.Smithuis R, van Delden O, Schaefer-Prokop C. Lung - HRCT Basic Interpretation. Radiology Assistant educational site. http://www.radiologyassistant.nl/en/p42d94cd0c326b/lung-hrct-basic-interpretation.html. Published December 24, 2006. Accessed January 8, 2019.
- 24.Fleischner FG. The butterfly pattern of acute pulmonary edema. Am J Cardiol 1967;20(1):39–46. [DOI] [PubMed] [Google Scholar]
- 25.Corrin B. The structure of the normal lungs. In: Corrin B, Symmers WStC, eds. Systemic pathology: Vol 5: the lungs. Oxford, England: Pergamon, 1990;22. [Google Scholar]
- 26.Corrin B. Normal lung structure. Pathology of the lungs. London, England: Churchill Livingstone, 1999; 25. [Google Scholar]
- 27.Travis WD, Colby TV, Koss MN, et al. Reactive lymphoid lesions. Non-neoplastic disorders of the lower respiratory tract. Washington, DC: American Registry of Pathology, 2002; 283–284. [Google Scholar]
- 28.Takashima S, Sone S, Li F, et al. Small solitary pulmonary nodules (< or =1 cm) detected at population-based CT screening for lung cancer: Reliable high-resolution CT features of benign lesions. AJR Am J Roentgenol 2003;180(4):955–964. [DOI] [PubMed] [Google Scholar]
- 29.Takashima S, Sone S, Li F, Maruyama Y, Hasegawa M, Kadoya M. Indeterminate solitary pulmonary nodules revealed at population-based CT screening of the lung: using first follow-up diagnostic CT to differentiate benign and malignant lesions. AJR Am J Roentgenol 2003;180(5):1255–1263. [DOI] [PubMed] [Google Scholar]
- 30.Benjamin MS, Drucker EA, McLoud TC, Shepard J-AO. Small pulmonary nodules: detection at chest CT and outcome. Radiology 2003;226(2):489–493. [DOI] [PubMed] [Google Scholar]
- 31.Xu DM, van der Zaag-Loonen HJ, Oudkerk M, et al. Smooth or attached solid indeterminate nodules detected at baseline CT screening in the NELSON study: cancer risk during 1 year of follow-up. Radiology 2009;250(1):264–272. [DOI] [PubMed] [Google Scholar]
- 32.de Hoop B, van Ginneken B, Gietema H, Prokop M. Pulmonary perifissural nodules on CT scans: rapid growth is not a predictor of malignancy. Radiology 2012;265(2):611–616. [DOI] [PubMed] [Google Scholar]
- 33.Horeweg N, van Rosmalen J, Heuvelmans MA, et al. Lung cancer probability in patients with CT-detected pulmonary nodules: a prespecified analysis of data from the NELSON trial of low-dose CT screening. Lancet Oncol 2014;15(12):1332–1341. [DOI] [PubMed] [Google Scholar]
- 34.Han D, Heuvelmans MA, van der Aalst CM, et al. New Fissure-Attached Nodules in Lung Cancer Screening: A Brief Report From The NELSON Study. J Thorac Oncol 2020;15(1):125–129. [DOI] [PubMed] [Google Scholar]
- 35.Mets OM, Chung K, Scholten ET, et al. Incidental perifissural nodules on routine chest computed tomography: lung cancer or not? Eur Radiol 2018;28(3):1095–1101. [DOI] [PMC free article] [PubMed] [Google Scholar]
- 36.Schreuder A, van Ginneken B, Scholten ET, et al. Classification of CT pulmonary opacities as perifissural nodules: reader variability. Radiology 2018;288(3):867–875. [DOI] [PubMed] [Google Scholar]
- 37.National Lung Screening Trial Research Team , Aberle DR, Adams AM, et al. Reduced lung-cancer mortality with low-dose computed tomographic screening. N Engl J Med 2011;365(5):395–409. [DOI] [PMC free article] [PubMed] [Google Scholar]
- 38.McWilliams A, Tammemagi MC, Mayo JR, et al. Probability of cancer in pulmonary nodules detected on first screening CT. N Engl J Med 2013;369(10):910–919. [DOI] [PMC free article] [PubMed] [Google Scholar]
- 39.Winkler Wille MM, van Riel SJ, Saghir Z, et al. Predictive accuracy of the PanCan lung cancer risk prediction model -external validation based on CT from the Danish lung cancer screening trial. Eur Radiol 2015;25(10):3093–3099. [DOI] [PubMed] [Google Scholar]
- 40.Pedersen JH, Ashraf H, Dirksen A, et al. The Danish randomized lung cancer CT screening trial--overall design and results of the prevalence round. J Thorac Oncol 2009;4(5):608–614. [DOI] [PubMed] [Google Scholar]
- 41.Samim A, Littooij AS, van den Heuvel-Eibrink MM, Wessels FJ, Nievelstein RAJ, de Jong PA. Frequency and characteristics of pulmonary nodules in children at computed tomography. Pediatr Radiol 2017;47(13):1751–1758. [DOI] [PMC free article] [PubMed] [Google Scholar]
- 42.Verhagen MV, Smets AMJB, van Schuppen J, Deurloo EE, Schaefer-Prokop C. The impact of reconstruction techniques on observer performance for the detection and characterization of small pulmonary nodules in chest CT of children under 13 years. Eur J Radiol 2018;100:142–146. [DOI] [PubMed] [Google Scholar]
- 43.Goo JM. Juxtapleural (perifissural) nodules: does location mean a benign lesion? Radiology 2018;288(3):876–877. [DOI] [PubMed] [Google Scholar]
- 44.Ciompi F, de Hoop B, van Riel SJ, et al. Automatic classification of pulmonary peri-fissural nodules in computed tomography using an ensemble of 2D views and a convolutional neural network out-of-the-box. Med Image Anal 2015;26(1):195–202. [DOI] [PubMed] [Google Scholar]
Associated Data
This section collects any data citations, data availability statements, or supplementary materials included in this article.