

Abstract
Purpose
To explore stress echocardiographic findings among patients with pectus excavatum (PEX) and their relationship with malformation severity.
Materials and Methods
A prospective registry involving consecutive patients with a diagnosis of isolated PEX referred to undergo chest CT and stress echocardiography to evaluate surgical candidacy and/or to define treatment strategies was developed. Malformation indexes were evaluated using chest CT.
Results
This study included 269 patients with PEX (19.7 years ± 7.8 [standard deviation]; 245 men) and 35 healthy volunteers (20.7 years ± 6.1; 21 men). Patients with PEX achieved a lower maximal workload (PEX group, 8.2 metabolic equivalents ± 1.7; control group, 11.8 metabolic equivalents ± 5.5; P < .0001). This study identified evidence of abnormal right ventricular diastolic function in 29% of patients with PEX and identified no evidence of this among those in the control group (P < .0001). Healthy controls showed a 37% increment in the tricuspid area during exercise, compared with 4% in patients with PEX (P = .002). Right ventricular systolic function was significantly lower in patients with PEX than in controls, both measured using tricuspid annulus plane systolic excursion (stress, 25.0 mm ± 5.5 vs 35.4 mm ± 3.7; P < .0001), and the tricuspid systolic wave was also smaller (stress, 16.9 cm/sec ± 4.5 vs 20.5 cm/sec ± 3.9; P < .0001). During stress, significant associations were detected between malformation indexes with right ventricular systolic and diastolic findings (P < .05 for all).
Conclusion
This study identified evidence of diverse adverse functional and morphologic cardiac manifestations in PEX, involving signs of abnormal diastolic and systolic right ventricular function and compression of the atrioventricular groove, which worsened during stress and were related to malformation severity.
© RSNA, 2020
An earlier incorrect version of this article appeared online. This article was corrected on October 19, 2020.
Summary
Patients with pectus excavatum showed evidence of right ventricular diastolic (29%) and systolic (16%) dysfunction and compression of the atrioventricular groove, which worsened during stress and were related to malformation severity.
Key Points
■ This study examined a series of patients with pectus excavatum (PEX) evaluated with stress echocardiography.
■ Abnormal right ventricular diastolic function during exercise was shown in 29% of patients with PEX, along with a lower ejection fraction (P < .0001).
■ Patients with PEX showed a fixed (4% change) tricuspid area during exercise, and a significant relationship was identified between chest indexes and stress right ventricular findings (P < .05 for all).
Introduction
Until quite recently, pectus excavatum (PEX) was deemed an aesthetic alteration of the thoracic wall, with patients generally left untreated unless there was evidence of substantial loss in quality of life related to the psychosocial impact (1–3). However, aside from shifting respiratory biomechanics and promoting a restrictive pulmonary function pattern in some cases, this thoracic wall malformation can exert direct compression of the underlying right cardiac chambers, causing various morphologic and functional cardiac alterations (4,5). Such alterations have been documented in a few small studies using echocardiography and cardiac MRI, revealing the presence of diverse manifestations mostly related to exercise, inspiration, and diastolic function (6,7). Indeed, a large proportion of patients with significant sternal depression can manifest exercise intolerance, with unclear underlying pathophysiologic mechanisms that might involve both pulmonary and cardiac impairment. Surgical correction of PEX has been shown to improve the quality of life of these patients (8). However, given the youth of the population involved, demonstration of cardiac involvement supports the surgical indication. At our institution, preoperative imaging of patients with PEX involves chest CT, exercise stress echocardiography, and in some cases MRI (9). In particular, stress echocardiography emerges as an appropriate imaging tool in PEX, as it enables comprehensive and radiation-free assessment of the functional capacity, the systolic and diastolic function, and the extent of compression of the atrioventricular (AV) groove. However, studies evaluating stress echocardiographic findings among patients with PEX are scarce, and whether it relates to chest-malformation indexes remains mostly unknown. We therefore sought to explore the patterns, prevalence, and characteristics of stress echocardiographic findings among patients referred for evaluation of surgical candidacy for PEX and sought to explore the relationship with the severity and characteristics of the chest wall malformation.
Materials and Methods
Study Population
Since 2012, our institution has specialized in chest-malformation surgery (Department of Pediatric Surgery, Fundación Hospitalaria Children’s Hospital, Buenos Aires, Argentina) and adopted the strategy of performing chest CT and stress echocardiography for all patients with a diagnosis of PEX to evaluate surgical candidacy and/or to define treatment strategies. Therefore, the present study was a prospective registry developed between August 2012 and May 2018 involving 326 consecutive patients with a diagnosis of PEX as an isolated chest malformation referred to undergo chest CT and stress echocardiography for evaluation of surgical candidacy and/or for definition of treatment strategies. We excluded 57 patients from the analysis because they had pectus carinatum, underwent follow-up imaging after bar placement, or did not undergo chest CT. The control group, who underwent only stress echocardiography, comprised 35 healthy young participants regularly performing noncompetitive exercise, without a history of cardiovascular or pulmonary disease. These participants did not have chest wall abnormalities and had a normal baseline echocardiogram. All patients had to be able to undergo a stress test on a bicycle in a supine position.
Seventy-seven of the 304 patients included have been previously reported (10). This prior article dealt with the relationship between the site of maximal compression and MRI, CT, and echocardiographic findings and the effect of breathing, whereas in this study we evaluated stress echocardiographic findings and their relationship with malformation severity.
Stress Echocardiography
Stress echocardiography was performed in all cases by using supine bicycle exercise and a modified Astrand protocol, including 3-minute stages and 150-kgm increments. All measurements were performed by a cardiologist (I.M.R., >15 years’ experience) blinded to the clinical history and any other imaging findings (although obviously not blinded to the external severity of chest compression) using an iE33 xMATRIX US system (Philips, Cleveland, Ohio). Baseline and stress echocardiogram measurements included assessment of systolic and diastolic function and involvement of the AV groove, as previously reported (10). Diastolic function refers to mechanical properties of both ventricles, involving relaxation, filling patterns, and distensibility. The most common approach to assessing the diastolic function of the left and right ventricles comprises evaluation of the transmitral and transtricuspid flow curves using Doppler imaging. Such curves are composed of the waves corresponding to rapid filling at early diastole (E) and late filling at end-diastole (A). Both are influenced by the pressure gradient between the atria and ventricles, as well as by ventricular relaxation and stiffness.
The tricuspid area was calculated by means of the continuity equation, using the right ventricular outflow tract as reference. Using an apical four-chamber view, the following measurements were performed: mean and peak tricuspid diastolic gradient (using continuous-wave Doppler imaging); E and A waves of the tricuspid and mitral valves using pulsed-wave Doppler imaging; and tricuspid early diastolic velocity (e) and late diastolic velocity (a) waves through color tissue Doppler imaging at the level of the tricuspid annulus and the interventricular septum. Doppler measurements were evaluated off-line using a sweep rate of 75 mm/sec, which was adjusted if necessary. During exercise, aside from peak stress, images were also obtained at exercise onset when the heart rate was between 100 and 110 beats per minute and E and A waves were still discernible, thus enabling discrimination between E and A waves. If still indiscernible, images were also captured during recovery. Tissue Doppler imaging studies were performed using the same approach. Right ventricular systolic function was evaluated using the systolic wave (S wave) of the lateral tricuspid annulus at tissue Doppler imaging and by means of tricuspid annulus plane systolic excursion (TAPSE), whereas left ventricular systolic function was assessed by calculating the ejection fraction (Simpson biplane method).
Definitions
We assessed the presence of any of the following findings aimed at assessment of the right ventricular diastolic function: e/a ratio less than 0.6 and E/A ratio less than 0.8. According to these parameters based on recommendations of the American Society of Echocardiography, the presence of abnormal right ventricular diastolic function required both criteria (11–13). The presence of abnormal right ventricular systolic function was defined using the mean values minus 2 standard deviations of our control group, namely an S wave lower than 7.7 cm/sec during rest and lower than 12.7 cm/sec during stress. Finally, the presence of abnormal septal motion (septal bounce), assessed using M-mode imaging, was defined as paradoxical bouncing motion of the septal wall initially directed toward and then away from the left ventricle during early diastole. For validation purposes, we also assessed the presence of signs of abnormal right ventricular systolic function on the basis of recommendations of the American Society of Echocardiography (TAPSE < 17 mm or pulsed Doppler S wave < 10 cm/sec) (14).
Chest CT Image Acquisition and Analysis
CT images were acquired at end-expiration using 64– and 256–detector-row CT scanners (Brilliance and ICT; Philips) and 16-slice and high-definition CT scanners (Discovery STE and Discovery HD 750, GE Healthcare, Milwaukee, Wis), as previously reported (8). Measurements were performed, using axial views, by an experienced radiologist (C.C., >15 years’ experience) blinded to the clinical data and to the stress echocardiographic findings. The following measurements were performed at the site of maximum sternum or chondral depression: minimum anteroposterior distance, maximum transverse distance, and maximum distance between the line placed on the anterior spine and the inner margin of the most anterior portion of the chest. Using these variables, the Haller index (HI) and the correction index (CI) were calculated as previously reported (Fig 1) (9). The HI is the most commonly used index to establish PEX severity, being that a cutoff value greater than 3.25 is generally employed to establish surgical candidacy. The CI corresponds to the depth of the anterior wall depression independently of the width of the inner ribcage, reflecting the percentage of the sternal depression that should be corrected with surgery. A CI larger than 10% identifies patients with PEX, and a CI larger than 20% identifies those with surgical indication.
Figure 1a:

Pectus excavatum in a 25-year-old man. (a–c) The severe depression of the anterior chest wall compresses the atrioventricular groove (arrow in a), leading to incremented tricuspid gradients (in b; mean, 8 mm Hg; peak, 14 mm Hg). Abnormal septal motion is also noted using M-mode US (in c). (d–f) Chest CT (axial views in d and e and volume-rendered views in f) reveals a severe chest malformation (arrow), with a Haller index of 12.6 and a correction index of 73%. Note the presence of mild pericardial effusion (* in d). Note in d the measurements performed to calculate chest malformation indexes. Using these, the Haller index is calculated as the ratio between the maximum transverse distance (a) and the minimum anteroposterior distance (b), whereas the correction index is defined as the difference between the maximum distance (c) between the anterior spine and the most anterior portion of the chest, and (b) divided by (c); (c − b/c) × 100.
Figure 1b:

Pectus excavatum in a 25-year-old man. (a–c) The severe depression of the anterior chest wall compresses the atrioventricular groove (arrow in a), leading to incremented tricuspid gradients (in b; mean, 8 mm Hg; peak, 14 mm Hg). Abnormal septal motion is also noted using M-mode US (in c). (d–f) Chest CT (axial views in d and e and volume-rendered views in f) reveals a severe chest malformation (arrow), with a Haller index of 12.6 and a correction index of 73%. Note the presence of mild pericardial effusion (* in d). Note in d the measurements performed to calculate chest malformation indexes. Using these, the Haller index is calculated as the ratio between the maximum transverse distance (a) and the minimum anteroposterior distance (b), whereas the correction index is defined as the difference between the maximum distance (c) between the anterior spine and the most anterior portion of the chest, and (b) divided by (c); (c − b/c) × 100.
Figure 1c:

Pectus excavatum in a 25-year-old man. (a–c) The severe depression of the anterior chest wall compresses the atrioventricular groove (arrow in a), leading to incremented tricuspid gradients (in b; mean, 8 mm Hg; peak, 14 mm Hg). Abnormal septal motion is also noted using M-mode US (in c). (d–f) Chest CT (axial views in d and e and volume-rendered views in f) reveals a severe chest malformation (arrow), with a Haller index of 12.6 and a correction index of 73%. Note the presence of mild pericardial effusion (* in d). Note in d the measurements performed to calculate chest malformation indexes. Using these, the Haller index is calculated as the ratio between the maximum transverse distance (a) and the minimum anteroposterior distance (b), whereas the correction index is defined as the difference between the maximum distance (c) between the anterior spine and the most anterior portion of the chest, and (b) divided by (c); (c − b/c) × 100.
Figure 1d:

Pectus excavatum in a 25-year-old man. (a–c) The severe depression of the anterior chest wall compresses the atrioventricular groove (arrow in a), leading to incremented tricuspid gradients (in b; mean, 8 mm Hg; peak, 14 mm Hg). Abnormal septal motion is also noted using M-mode US (in c). (d–f) Chest CT (axial views in d and e and volume-rendered views in f) reveals a severe chest malformation (arrow), with a Haller index of 12.6 and a correction index of 73%. Note the presence of mild pericardial effusion (* in d). Note in d the measurements performed to calculate chest malformation indexes. Using these, the Haller index is calculated as the ratio between the maximum transverse distance (a) and the minimum anteroposterior distance (b), whereas the correction index is defined as the difference between the maximum distance (c) between the anterior spine and the most anterior portion of the chest, and (b) divided by (c); (c − b/c) × 100.
Figure 1e:

Pectus excavatum in a 25-year-old man. (a–c) The severe depression of the anterior chest wall compresses the atrioventricular groove (arrow in a), leading to incremented tricuspid gradients (in b; mean, 8 mm Hg; peak, 14 mm Hg). Abnormal septal motion is also noted using M-mode US (in c). (d–f) Chest CT (axial views in d and e and volume-rendered views in f) reveals a severe chest malformation (arrow), with a Haller index of 12.6 and a correction index of 73%. Note the presence of mild pericardial effusion (* in d). Note in d the measurements performed to calculate chest malformation indexes. Using these, the Haller index is calculated as the ratio between the maximum transverse distance (a) and the minimum anteroposterior distance (b), whereas the correction index is defined as the difference between the maximum distance (c) between the anterior spine and the most anterior portion of the chest, and (b) divided by (c); (c − b/c) × 100.
Figure 1f:

Pectus excavatum in a 25-year-old man. (a–c) The severe depression of the anterior chest wall compresses the atrioventricular groove (arrow in a), leading to incremented tricuspid gradients (in b; mean, 8 mm Hg; peak, 14 mm Hg). Abnormal septal motion is also noted using M-mode US (in c). (d–f) Chest CT (axial views in d and e and volume-rendered views in f) reveals a severe chest malformation (arrow), with a Haller index of 12.6 and a correction index of 73%. Note the presence of mild pericardial effusion (* in d). Note in d the measurements performed to calculate chest malformation indexes. Using these, the Haller index is calculated as the ratio between the maximum transverse distance (a) and the minimum anteroposterior distance (b), whereas the correction index is defined as the difference between the maximum distance (c) between the anterior spine and the most anterior portion of the chest, and (b) divided by (c); (c − b/c) × 100.
All procedures performed were in accordance with the ethical standards of the institutional research committee and with the 1964 Helsinki declaration and its later amendments. A habeas data waive was obtained from the institutional-review-board committee on the basis of the fact that this observational study involved procedures routinely performed in this patient population (patients with PEX) as part of surgical-candidacy evaluation. Control patients, who did not undergo CT, provided informed written consent to allow anonymous use of stress echocardiographic images.
Statistical Analysis
Continuous variables were reported as means ± standard deviations and medians (interquartile ranges), and categorical variables were reported as counts and percentages. Differences between groups were assessed using one-way analysis of variance and independent-sample t tests for continuous variables and χ2 tests for categorical variables. Differences between groups with nonparametric distribution were evaluated using Mann-Whitney U tests. Univariate analysis was performed to identify predictors of surgical repair, including the following variables in the model: sex, age, effort symptoms, HI, CI, metabolic equivalents, incomplete right bundle-branch block (defined on the basis of rSr' morphologic characteristics in V1–V2 leads with QRS duration <120 msec), abnormal septal motion, rest and stress left ventricular E/e ratio, rest and stress tricuspid area and mean and peak gradient, rest and stress TAPSE, rest and stress right ventricular E/e ratio and S wave, and left atrium area. All variables with a P value less than .05 were included in the model for further logistic regression analysis (Forward-Wald method). A two-sided P value of less than .05 indicated statistical significance. Statistical analyses were performed using SPSS software, version 22.0 (IBM SPSS Statistics for Windows, Armonk, NY).
Results
We included 269 patients with PEX (19.7 years ± 7.8; 245 men) and 35 healthy volunteers (20.7 years ± 6.1; 21 men). There were no differences between groups regarding age (P = .47) or body surface area (1.73 m2 ± 0.4 vs 1.78 m2 ± 0.3; P = .49), whereas we identified that the PEX group showed a larger percentage of men (P < .0001).
Patients with PEX had a mean HI of 5.5 ± 3.8 (median, 4.5 [interquartile range, 4.0–6.0]) and a mean CI of 34.9% ± 16.2 (median, 33.0% [interquartile range, 23.5%–43.0%]). Data regarding clinical symptoms were available from 230 (86%) cases, of which 89 (39%) had effort-related symptoms (dyspnea and exercise intolerance). Incomplete right bundle-branch block was identified in 166 patients with PEX (62%) and 10 patients in the control group (29%) (P < .0001).
Stress Echocardiographic Differences between Patients with PEX and Healthy Volunteers
All patients achieved the age-predicted maximum heart rate, with no differences between groups (PEX, 167.1 beats per minute ± 12.0; control, 163.8 beats per minute ± 10.9; P = .12). Compared with the control group, patients with PEX achieved a lower maximal workload (8.2 metabolic equivalents ± 1.7 vs 11.8 metabolic equivalents ± 5.5; P < .0001). A detailed description of mean echocardiographic findings among patients with PEX and control patients is provided in Table 1. Patients with PEX showed a smaller left atrium (5.8 cm2/m2 ± 1.8 vs 7.7 cm2/m2 ± 1.7; P < .0001), and pericardial effusion (mild in all cases) was identified in 25 patients with PEX (9%), whereas it was not detected in the control group (P = .060).
Table 1:
Stress Echocardiographic Findings: Comparison with Control Group

Effect of PEX on Diastolic Function
Patients with PEX showed altered left ventricular and right ventricular filling patterns, which mostly affected the right ventricle and were more visible during stress (Table 1, Fig 2). In particular, patients with PEX showed lower right ventricular E/A ratio (1.00 ± 0.7 vs 1.22 ± 0.4; P = .006), e/a ratio (1.12 ± 0.9 vs 1.60 ± 1.0; P = .003), and e wave (16.5 cm/sec ± 7.3 vs 26.4 cm/sec ± 9.2; P < .0001) than controls during stress. Forty percent of patients with PEX had an inverted left ventricular E/A ratio (E/A ratio < 1.0; Fig 1) at stress, compared with only one patient (3%) in the control group (P < .0001). One hundred sixty-five patients with PEX (63%) had an inverted right ventricular E/A ratio during stress (Fig 2), compared with six control patients (17%) (P < .0001), with evidence of abnormal right ventricular diastolic function in 76 patients with PEX (29%) and no evidence of this among those in the control group (P < .0001). Abnormal septal motion (Figs 1, 2) was detected in 64% of patients with PEX, whereas it was not identified in the control group (P = .024).
Figure 2a:

(a–b) Severe pectus excavatum (arrow; Haller index of 8.0; correction index of 55%) in a 15-year-old male patient. (c–h) Stress echocardiograms reveal diverse abnormal findings, including abnormal septal motion (in c), incremented tricuspid gradient during stress (in d), and left ventricular E/A (e, rest; f, stress) and e/a (g, rest; h, stress) wave inversion during stress. e/a = ratio of early diastolic velocity to late diastolic velocity, E/A = ratio of rapid filling at early diastole to late filling at end-diastole.
Figure 2b:

(a–b) Severe pectus excavatum (arrow; Haller index of 8.0; correction index of 55%) in a 15-year-old male patient. (c–h) Stress echocardiograms reveal diverse abnormal findings, including abnormal septal motion (in c), incremented tricuspid gradient during stress (in d), and left ventricular E/A (e, rest; f, stress) and e/a (g, rest; h, stress) wave inversion during stress. e/a = ratio of early diastolic velocity to late diastolic velocity, E/A = ratio of rapid filling at early diastole to late filling at end-diastole.
Figure 2c:

(a–b) Severe pectus excavatum (arrow; Haller index of 8.0; correction index of 55%) in a 15-year-old male patient. (c–h) Stress echocardiograms reveal diverse abnormal findings, including abnormal septal motion (in c), incremented tricuspid gradient during stress (in d), and left ventricular E/A (e, rest; f, stress) and e/a (g, rest; h, stress) wave inversion during stress. e/a = ratio of early diastolic velocity to late diastolic velocity, E/A = ratio of rapid filling at early diastole to late filling at end-diastole.
Figure 2d:

(a–b) Severe pectus excavatum (arrow; Haller index of 8.0; correction index of 55%) in a 15-year-old male patient. (c–h) Stress echocardiograms reveal diverse abnormal findings, including abnormal septal motion (in c), incremented tricuspid gradient during stress (in d), and left ventricular E/A (e, rest; f, stress) and e/a (g, rest; h, stress) wave inversion during stress. e/a = ratio of early diastolic velocity to late diastolic velocity, E/A = ratio of rapid filling at early diastole to late filling at end-diastole.
Figure 2e:

(a–b) Severe pectus excavatum (arrow; Haller index of 8.0; correction index of 55%) in a 15-year-old male patient. (c–h) Stress echocardiograms reveal diverse abnormal findings, including abnormal septal motion (in c), incremented tricuspid gradient during stress (in d), and left ventricular E/A (e, rest; f, stress) and e/a (g, rest; h, stress) wave inversion during stress. e/a = ratio of early diastolic velocity to late diastolic velocity, E/A = ratio of rapid filling at early diastole to late filling at end-diastole.
Figure 2f:

(a–b) Severe pectus excavatum (arrow; Haller index of 8.0; correction index of 55%) in a 15-year-old male patient. (c–h) Stress echocardiograms reveal diverse abnormal findings, including abnormal septal motion (in c), incremented tricuspid gradient during stress (in d), and left ventricular E/A (e, rest; f, stress) and e/a (g, rest; h, stress) wave inversion during stress. e/a = ratio of early diastolic velocity to late diastolic velocity, E/A = ratio of rapid filling at early diastole to late filling at end-diastole.
Figure 2g:

(a–b) Severe pectus excavatum (arrow; Haller index of 8.0; correction index of 55%) in a 15-year-old male patient. (c–h) Stress echocardiograms reveal diverse abnormal findings, including abnormal septal motion (in c), incremented tricuspid gradient during stress (in d), and left ventricular E/A (e, rest; f, stress) and e/a (g, rest; h, stress) wave inversion during stress. e/a = ratio of early diastolic velocity to late diastolic velocity, E/A = ratio of rapid filling at early diastole to late filling at end-diastole.
Figure 2h:
(a–b) Severe pectus excavatum (arrow; Haller index of 8.0; correction index of 55%) in a 15-year-old male patient. (c–h) Stress echocardiograms reveal diverse abnormal findings, including abnormal septal motion (in c), incremented tricuspid gradient during stress (in d), and left ventricular E/A (e, rest; f, stress) and e/a (g, rest; h, stress) wave inversion during stress. e/a = ratio of early diastolic velocity to late diastolic velocity, E/A = ratio of rapid filling at early diastole to late filling at end-diastole.
Effect of PEX on the AV Groove
At rest, no significant differences were detected between patients with PEX and healthy controls regarding tricuspid annulus area or tricuspid gradient (Table 1). During stress, patients with PEX showed a smaller tricuspid area (1.74 cm2/m2 ± 0.7 vs 2.32 cm2/m2 ± 0.9; P < .0001) and higher peak (10.2 mm Hg ± 4.3 vs 7.4 mm Hg ± 2.2; P < .0001) and mean (6.2 mm Hg ± 2.6 vs 4.8 mm Hg ± 1.2; P = .003) tricuspid gradients (Figs 1, 2). The median change in tricuspid area between stress and rest was 0.06 (interquartile range, −0.26 to 0.43) cm2/m2 in patients with PEX (median relative difference of 3.6%) and 0.40 (interquartile range, −0.10 to 1.03) cm2/m2 (median relative difference of 37.2%) in healthy controls (P = .002).
Effect of PEX on Systolic Function
At rest, patients with PEX had a left ventricular ejection fraction comparable to that of the control group (66.2% ± 5.9 vs 67.8% ± 6.1; P = .14), whereas significant differences were identified in the right ventricle, both regarding TAPSE (20.7 mm ± 4.7 vs 24.2 mm ± 3.6; P < .0001) and the S wave (10.6 cm/sec ± 2.7 vs 11.5 cm/sec ± 1.9; P = .047). During stress, such right ventricular differences were larger for both TAPSE (25.0 mm ± 5.5 vs 35.4 mm ± 3.7; P < .0001) and the S wave (16.9 cm/sec ± 4.5 vs 20.5 cm/sec ± 3.9; P < .0001) (Fig 3). Using threshold levels defined as an S wave lower than the mean minus 2 standard deviations of the control group, a total of 36 patients with PEX (14%) had evidence of abnormal right ventricular systolic function at rest, and 40 patients (16%) had such evidence during stress. According to the right ventricular guidelines of the American Society of Echocardiography using a threshold of 10 cm/sec, abnormal resting right ventricular systolic function was more prevalent in patients with PEX than in controls (128 [47%] vs 7 [20%]; P = .002], with nonsignificant differences at stress (seven [3%] vs 0 [0%]; P = .31) (12).
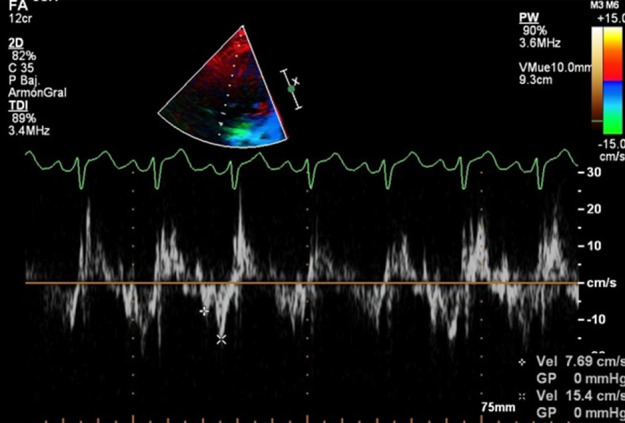
Figure 3a:

Findings in a 13-year-old boy with exercise intolerance. (a) Chest CT shows pectus excavatum (arrow) with a Haller index of 5.0 and a correction index of 41%. (b–d) Echocardiography reveals diverse abnormal findings at rest, including reduced right ventricular systolic function (tricuspid annulus plane systolic excursion of 13 mm in b; systolic wave of 7.9 cm/sec in c) and e/a inversion at tissue Doppler imaging (in d). e/a = ratio of early diastolic velocity to late diastolic velocity.
Figure 3b:

Findings in a 13-year-old boy with exercise intolerance. (a) Chest CT shows pectus excavatum (arrow) with a Haller index of 5.0 and a correction index of 41%. (b–d) Echocardiography reveals diverse abnormal findings at rest, including reduced right ventricular systolic function (tricuspid annulus plane systolic excursion of 13 mm in b; systolic wave of 7.9 cm/sec in c) and e/a inversion at tissue Doppler imaging (in d). e/a = ratio of early diastolic velocity to late diastolic velocity.
Figure 3c:

Findings in a 13-year-old boy with exercise intolerance. (a) Chest CT shows pectus excavatum (arrow) with a Haller index of 5.0 and a correction index of 41%. (b–d) Echocardiography reveals diverse abnormal findings at rest, including reduced right ventricular systolic function (tricuspid annulus plane systolic excursion of 13 mm in b; systolic wave of 7.9 cm/sec in c) and e/a inversion at tissue Doppler imaging (in d). e/a = ratio of early diastolic velocity to late diastolic velocity.
Figure 3d:

Findings in a 13-year-old boy with exercise intolerance. (a) Chest CT shows pectus excavatum (arrow) with a Haller index of 5.0 and a correction index of 41%. (b–d) Echocardiography reveals diverse abnormal findings at rest, including reduced right ventricular systolic function (tricuspid annulus plane systolic excursion of 13 mm in b; systolic wave of 7.9 cm/sec in c) and e/a inversion at tissue Doppler imaging (in d). e/a = ratio of early diastolic velocity to late diastolic velocity.
Relationship between Malformation Severity and Echocardiographic Findings
Chest-malformation severity (Tables 2, 3) was not associated with the presence of stress-related symptoms. Patients at the upper tertiles of chest-malformation indexes displayed distinctively worse rest right ventricular findings, including lower TAPSE (HI, P = .01; CI, P < .0001), lower e waves (HI, P = .009; CI, P = .004), and higher tricuspid gradients (HI, P < .0001; CI, P < .0001). At stress imaging, significant associations were detected between the HI and right ventricular systolic and diastolic findings (Tables 2, 3), including worsening systolic function (TAPSE, P = .003; S wave, P = .007) and higher tricuspid gradients (peak, P < .0001; mean, P < .0001). Similarly, significant associations between the CI and right ventricular systolic and diastolic findings were detected, including lower TAPSE (P = .019) and higher tricuspid gradients (peak, P < .0001; mean, P < .0001).
Table 2:
Stress Echocardiographic Findings in Patients with PEX according to the Haller Index Tertiles

Table 3:
Stress Echocardiographic Findings in Patients with PEX according to the Correction Index Tertiles

Predictors of Surgical Repair
After a median follow-up of 3.2 (interquartile range, 1.8–5.1) years, 89 patients (33%) underwent surgery. Patients who underwent surgery were significantly younger than those who did not (17.3 years ± 4.7 vs 20.9 years ± 8.7; P < .0001), and a larger percentage of these showed effort-related symptoms (surgery, 48%; nonsurgery, 33%; P = .022). Furthermore, patients who underwent surgery had worse chest-malformation indexes and displayed worse echocardiographic findings, particularly during stress, including larger tricuspid mean gradient (surgery, 7.0 mm Hg ± 2.9; nonsurgery, 5.8 mm Hg ± 2.3; P < .0001) and E/e ratio (5.75 ± 2.8 vs 4.84 ± 1.9; P = .002) and lower TAPSE (19.3 mm ± 4.5 vs 21.2 mm ± 4.9; P < .0001). At multivariate analysis, only age (hazard ratio, 0.92 [95% confidence interval: 0.88, 0.96]; P < .0001) and the CI (hazard ratio, 1.05 [95% confidence interval: 1.03, 1.07]; P < .0001) were independent predictors of surgery.
Discussion
Studies exploring stress echocardiographic findings in PEX are scarce, involving small populations and/or focusing on anatomic manifestations (10,15). Our study comprises, to our knowledge, the largest series of patients with PEX evaluated with stress echocardiography and provides detailed evidence of diverse adverse functional and morphologic cardiac manifestations in PEX. In brief, a fraction of patients with PEX showed exercise-related symptoms (39%), mild pericardial effusion (9%), stress-related signs of abnormal diastolic (29%) and systolic (16%) function more commonly affecting the right ventricle, and signs of compression of the AV groove reflected by the presence of incremented tricuspid gradients (peak gradient, 10.2 mm Hg ± 4.3). Furthermore, the extent of right ventricular alterations was related to chest-malformation severity indexes.
Clinical and Echocardiographic Findings, Exercise Capacity, and Left Atrium Size
Despite our population being composed of those with relatively severe chest malformations (median HI and CI of 4.5 and 35%, respectively), only 39% of patients had effort-related symptoms, a markedly lower figure than the previously reported figures ranging from 68% to 86% (8,15). In part, such a difference might be attributed to the fact that effort-related symptoms among adolescents and very young adults can be subjective. Patients with PEX achieved a significantly lower maximal workload than controls, although we did not identify a relationship between metabolic equivalents and malformation indexes, nor did we identify differences among patients who ultimately underwent surgery. Interestingly, given the unsophisticated evaluation, the size of the left atrium emerged as a potentially useful marker of severity.
Effect of PEX on Diastolic Function and Compression of the AV Groove
Patients with PEX showed evidence of abnormal ventricular filling patterns, mostly affecting the right ventricle and particularly worsening during exercise. Such distinctive signs, including a 29% rate of stress-related abnormal right ventricular diastolic function and a 63% rate of E/A wave inversion, were associated with chest-malformation indexes. Likewise, patients with PEX showed a significantly smaller tricuspid area and higher tricuspid gradients than the control group, which worsened during exercise and were related to both the HI and CI. Notably, patients with PEX exhibited a fixed tricuspid area (inability to increase during stress) and a barely 4% increase during stress, compared with a 37% increase in healthy controls.
Hence, ventricular filling in this population might be affected by either or both mechanisms, including compression of the AV groove (and consequently the tricuspid valve) and inability of the right ventricle to achieve normal expansion within a reduced thoracic cage. The former phenomenon is manifested as an increased tricuspid gradient, whereas the latter (impaired right ventricular filling) is expressed by the presence of an inverted E/A wave ratio.
These results are in line with those of previous studies using cardiac MRI, showing signs of diastolic dysfunction and an exaggerated interventricular dependence in patients with PEX, particularly among those displaying compression of the AV groove (10,16). Indeed, using free-breathing cardiac MRI, it was recently demonstrated that up to one-third of patients with PEX have inspiratory septal flattening, commonly observed in patients with significantly incremented right ventricular filling pressures (17). In addition, the presence of an increased tricuspid gradient, reflecting AV groove compression, was also reported as a possible contributing factor to the cardiopulmonary manifestations observed in patients with PEX (2,4). The present study expands these results in a substantially larger population and through a more detailed echocardiographic analysis, not only showing distinctive patterns but also displaying a significant relationship to the severity of chest-malformation indexes.
Additional Cardiac Manifestations and Potential Clinical Implications
A number of studies including intraoperative transesophageal echocardiography with strain imaging have reported evidence of improvement in systolic function after PEX repair (6,17,18). However, the relevance of those data is still under debate. For instance, in a previous small study using MRI, we did not identify a significant relationship between chest-malformation indexes and right ventricular ejection fraction (10). The current study demonstrated signs of impaired right ventricular systolic function worsening during stress, including a 16% rate of abnormal right ventricular systolic function. Finally, patients with PEX had a higher incidence of pericardial effusion. Although mild and probably multifactorial, the mechanisms involved in this finding are not fully elucidated (19).
After a median follow-up of 3.2 years, 33% of patients underwent surgery. Notably, only (younger) age and the CI were identified as independent predictors of surgery, confirming that even in centers specialized in this pathologic condition, the decision to undergo surgery is still based on the severity of the chest malformation.
Our findings do not offer conclusive cause-effect relationships to explain the symptoms in this population because the mechanisms involving clinical symptoms might be multifactorial. However, although the diastolic and systolic impairments observed were mild, the significant differences identified not only when making comparisons with the control group but also, and more importantly, when assessing the association with worsening chest malformation might provide further mechanistic explanations aimed at explaining the still unraveled etiology of exercise intolerance in these patients. Moreover, findings in these patients are multiple and usually concurrent, including signs of impaired ventricular filling and systolic function, pericardial effusion, abnormal septal motion, incremented tricuspid gradient, and anatomic alterations.
Limitations
The size of the control group was small, given the difficulties with enrolling healthy volunteers in such a young population, with a larger percentage of males in the PEX cohort. Accordingly, sex differences in exercise testing parameters might have influenced the results in the control group. The right ventricular function measurements performed are dependent on apical displacement of the right ventricle; therefore, they might not fully represent global measures of function. Furthermore, additional measures—including fractional area change, myocardial performance index, strain imaging (which might have provided a more detailed analysis regarding underlying mechanisms of the mechanical impairment), and three-dimensional measures—were not assessed, given the complex scenario involving transthoracic stress imaging in the presence of greatly distorted chest anatomy.
Although all patients achieved the maximum heart rate, exercise capacity might have been higher using treadmill exercise. However, supine bicycle stress is favored in these patients because it enables more accurate intraeffort Doppler measurements (9). It is noteworthy that thresholds for definition of right ventricular diastolic dysfunction during stress have not been established and probably deserve further investigation. Moreover, definitions of diastolic dysfunction are based mostly on guidelines involving older populations. Left atrial volume measurements are cumbersome in these patients, given the acoustic-window limitations that preclude accurate measurements using the two-chamber view; therefore, only the four-chamber area was evaluated. Furthermore, potential inadequacy of alignment might have influenced Doppler measurements, particularly regarding tricuspid S-wave measurements. In this regard, the cardiologist involved in image acquisition (I.M.R.) was highly experienced in PEX; therefore, extrapolation of our findings by less experienced groups should be undertaken with caution. Finally, findings regarding surgical predictors should be viewed cautiously, as the decision to undergo surgery depends on several factors, including psychosocial aspects and insurance coverage. Follow-up stress echocardiography after bar removal was not available in this series of patients.
In conclusion, our study provides evidence of diverse adverse functional and morphologic cardiac manifestations in PEX, involving signs of abnormal diastolic and systolic right ventricular function and compression of the AV groove, which worsened during stress and were related to malformation severity.
Disclosures of Conflicts of Interest: I.M.R. disclosed no relevant relationships. M.M.F. disclosed no relevant relationships. G.B.M. disclosed no relevant relationships. C.C. disclosed no relevant relationships. M.M. disclosed no relevant relationships. L.T. disclosed no relevant relationships. P.C. disclosed no relevant relationships. G.A.R.G. disclosed no relevant relationships.
Current address: Instituto Médico ENERI, Clínica La Sagrada Familia, Buenos Aires, Argentina
Abbreviations:
- a
- late diastolic velocity
- A
- late filling at end-diastole
- AV
- atrioventricular
- CI
- correction index
- e
- early diastolic velocity
- E
- rapid filling at early diastole
- HI
- Haller index
- PEX
- pectus excavatum
- S wave
- systolic wave
- TAPSE
- tricuspid annulus plane systolic excursion
References
- 1.Kelly RE Jr, Obermeyer RJ, Nuss D. Diminished pulmonary function in pectus excavatum: from denying the problem to finding the mechanism. Ann Cardiothorac Surg 2016;5(5):466–475. [DOI] [PMC free article] [PubMed] [Google Scholar]
- 2.Obermeyer RJ, Cohen NS, Jaroszewski DE. The physiologic impact of pectus excavatum repair. Semin Pediatr Surg 2018;27(3):127–132. [DOI] [PubMed] [Google Scholar]
- 3.Maagaard M, Heiberg J. Improved cardiac function and exercise capacity following correction of pectus excavatum: a review of current literature. Ann Cardiothorac Surg 2016;5(5):485–492. [DOI] [PMC free article] [PubMed] [Google Scholar]
- 4.Abu-Tair T, Turial S, Hess M, et al. Impact of pectus excavatum on cardiopulmonary function. Ann Thorac Surg 2018;105(2):455–460. [DOI] [PubMed] [Google Scholar]
- 5.Jaroszewski DE, Velazco CS, Pulivarthi VSKK, Arsanjani R, Obermeyer RJ. Cardiopulmonary function in thoracic wall deformities: what do we really know? Eur J Pediatr Surg 2018;28(4):327–346. [DOI] [PubMed] [Google Scholar]
- 6.Töpper A, Polleichtner S, Zagrosek A, et al. Impact of surgical correction of pectus excavatum on cardiac function: insights on the right ventricle—a cardiovascular magnetic resonance study. Interact Cardiovasc Thorac Surg 2016;22(1):38–46. [DOI] [PubMed] [Google Scholar]
- 7.Gürkan U, Aydemir B, Aksoy S, et al. Echocardiographic assessment of right ventricular function before and after surgery in patients with pectus excavatum and right ventricular compression. Thorac Cardiovasc Surg 2014;62(3):231–235. [DOI] [PubMed] [Google Scholar]
- 8.Kelly RE Jr, Cash TF, Shamberger RC, et al. Surgical repair of pectus excavatum markedly improves body image and perceived ability for physical activity: multicenter study. Pediatrics 2008;122(6):1218–1222. [DOI] [PubMed] [Google Scholar]
- 9.Rodríguez-Granillo GA, Martínez-Ferro M, Capuñay C, et al. Preoperative multimodality imaging of pectus excavatum: state of the art review and call for standardization. Eur J Radiol 2019;117:140–148. [DOI] [PubMed] [Google Scholar]
- 10.Rodriguez-Granillo GA, Raggio IM, Deviggiano A, et al. Impact of pectus excavatum on cardiac morphology and function according to the site of maximum compression: effect of physical exertion and respiratory cycle. Eur Heart J Cardiovasc Imaging 2020;21(1):77–84. [DOI] [PubMed] [Google Scholar]
- 11.Nagueh SF, Smiseth OA, Appleton CP, et al. Recommendations for the evaluation of left ventricular diastolic function by echocardiography: an update from the American Society of Echocardiography and the European Association of Cardiovascular Imaging. J Am Soc Echocardiogr 2016;29(4):277–314. [DOI] [PubMed] [Google Scholar]
- 12.Rudski LG, Lai WW, Afilalo J, et al. Guidelines for the echocardiographic assessment of the right heart in adults: a report from the American Society of Echocardiography endorsed by the European Association of Echocardiography, a registered branch of the European Society of Cardiology, and the Canadian Society of Echocardiography. J Am Soc Echocardiogr 2010;23(7):685–713; quiz 786–788. [DOI] [PubMed] [Google Scholar]
- 13.Nagueh SF, Appleton CP, Gillebert TC, et al. Recommendations for the evaluation of left ventricular diastolic function by echocardiography. J Am Soc Echocardiogr 2009;22(2):107–133. [DOI] [PubMed] [Google Scholar]
- 14.Lang RM, Badano LP, Mor-Avi V, et al. Recommendations for cardiac chamber quantification by echocardiography in adults: an update from the American Society of Echocardiography and the European Association of Cardiovascular Imaging. Eur Heart J Cardiovasc Imaging 2015;16(3):233–270. [DOI] [PubMed] [Google Scholar]
- 15.Coln E, Carrasco J, Coln D. Demonstrating relief of cardiac compression with the Nuss minimally invasive repair for pectus excavatum. J Pediatr Surg 2006;41(4):683–686; discussion 683–686. [DOI] [PubMed] [Google Scholar]
- 16.Deviggiano A, Vallejos J, Vina N, et al. Exaggerated interventricular dependence among patients with pectus excavatum: combined assessment with cardiac MRI and chest CT. AJR Am J Roentgenol 2017;208(4):854–861. [DOI] [PubMed] [Google Scholar]
- 17.Chao CJ, Jaroszewski D, Gotway M, et al. Effects of pectus excavatum repair on right and left ventricular strain. Ann Thorac Surg 2018;105(1):294–301. [DOI] [PubMed] [Google Scholar]
- 18.Chao CJ, Jaroszewski DE, Kumar PN, et al. Surgical repair of pectus excavatum relieves right heart chamber compression and improves cardiac output in adult patients: an intraoperative transesophageal echocardiographic study. Am J Surg 2015;210(6):1118–1124; discussion 1124–1125. [DOI] [PubMed] [Google Scholar]
- 19.Oezcan S, Attenhofer Jost CH, Pfyffer M, et al. Pectus excavatum: echocardiography and cardiac MRI reveal frequent pericardial effusion and right-sided heart anomalies. Eur Heart J Cardiovasc Imaging 2012;13(8):673–679. [DOI] [PubMed] [Google Scholar]