

Abstract
Advances in molecular positron emission tomography (PET) have enabled anatomic tracking of brain pathology in longitudinal studies of normal aging and dementia, including assessment of the central model of Alzheimer’s disease (AD) pathogenesis, that TAU pathology begins focally but expands catastrophically under the influence of amyloid-beta (Aβ) pathology to mediate neurodegeneration and cognitive decline. Initial TAU deposition occurs many years prior to Aβ in a specific area of the medial temporal lobe. Building on recent work that enabled focus of molecular PET measurements on specific TAU-vulnerable convolutional temporal lobe anatomy, we applied an automated anatomic sampling method to quantify TAU PET signal in 443 adult participants from several observational studies of aging and AD, spanning a wide range of ages, Aβ burdens, and degrees of clinical impairment. We detected initial cortical emergence of tauopathy near the rhinal sulcus in clinically normal people and, in a subset with longitudinal two-year follow-up data (n=104), tracked Aβ-associated spread of TAU from this site first to nearby neocortex of the temporal lobe and then to extra-temporal regions. Greater rate of TAU spread was associated with baseline measures of both global Aβ burden and medial temporal lobe TAU. These findings are consistent with clinicopathological correlation studies of Alzheimer’s tauopathy and enable precise tracking of AD-related TAU progression for natural history studies and prevention therapeutic trials.
One Sentence Summary:
An automated method to quantify TAU PET detected initial cortical tauopathy in Alzheimer’s disease and tracked subsequent amyloid-related TAU spread.
Introduction
Medial temporal lobe (MTL) deposition of paired helical filament (PHF) TAU pathology is reported at autopsy as early as age 20 and is found in nearly all individuals by age 75 (1–4). In some individuals, TAU pathology has apparently spread from the MTL to nearby temporal neocortex and, subsequently, to parietal, occipital and frontal cortices, according to an ordinal staging scheme (1, 5, 6). When PHF TAU has spread to neocortex, it is commonly associated with amyloid-β (Aβ), and a widely investigated hypothesis posits an Aβ-TAU interaction that links these pathologies to the neuronal dysfunction and degeneration of Alzheimer’s disease (AD) (7–9).
Attempts to interrupt this process medically have so far failed, possibly because interventions took place after the stage at which TAU spread was already catastrophic (10, 11). Imaging of AD-related tauopathy is now possible with TAU positron emission tomography (PET) (12–15) and longitudinal change in TAU has been demonstrated in vulnerable populations (16–22). What remains to be identified, however, are the in vivo features of spatiotemporal progression based on anatomically defined TAU PET measures with which a tauopathy prevention strategy may be efficiently tested. Here, we report the in vivo MTL cortical origin and initial longitudinal spread of PHF tauopathy identified with TAU PET tracked over a two-year period, and relate these observations to age, apolipoprotein E (APOE) genotype, cortical burden of fibrillar Aβ, and subsequent TAU spread.
Identification of a cortical origin of tauopathy with PET has been challenging because initial deposition occurs focally within a gyral anatomy that normally varies between individuals (1, 5, 23). By identifying this anatomy in each individual participant, we located the expected site of initial TAU vulnerability described in autopsy studies. We then assessed statistical elevations in regional TAU PET signal in relation to global Aβ burden in a sample of 443 individuals. We found that MTL TAU PET signal initially emerges independently of Aβ, that temporal neocortex TAU elevations emerge subsequently in relation to Aβ increases, and that rates of neocortical TAU increase are related to baseline TAU burden particularly in MTL. Rather than reflecting only an age-related accumulation, we show that MTL TAU PET signal at baseline was associated with subsequent TAU spread into neocortex. Our findings raise the possibility that intervention against any of these links, including MTL TAU, could be effective in halting progression of AD pathology.
Results
Initial cortical TAU PET signal is detected in the collateral sulcus independently of Aβ
We aimed to determine whether the site of initial cortical PHF TAU deposition as identified in the neuropathology literature (1) could also be identified with TAU PET. To achieve this, we used an automated procedure to define sulcal and gyral anatomy on each of 443 participants (24), using magnetic resonance imaging (MRI) to locate and identify the region between peri-allocortex and neocortex that corresponds to the “trans-entorhinal” or perirhinal cortex identified postmortem (5, 25) (Fig. 1). Given the known limitations of PET spatial resolution, we designed this procedure with PET-compatible size constraints such that the resulting region-of-interest (ROI), which we term “rhinal cortex” (RC), captured Brodmann Area (BA) 35 in all cases, as well as portions of BA36 and lateral entorhinal in some cases (Methods, Fig. S1, Fig. S2). We hypothesized that RC would enable detection of initial cortical PHF tauopathy.
Fig. 1. Rhinal cortex identification method.
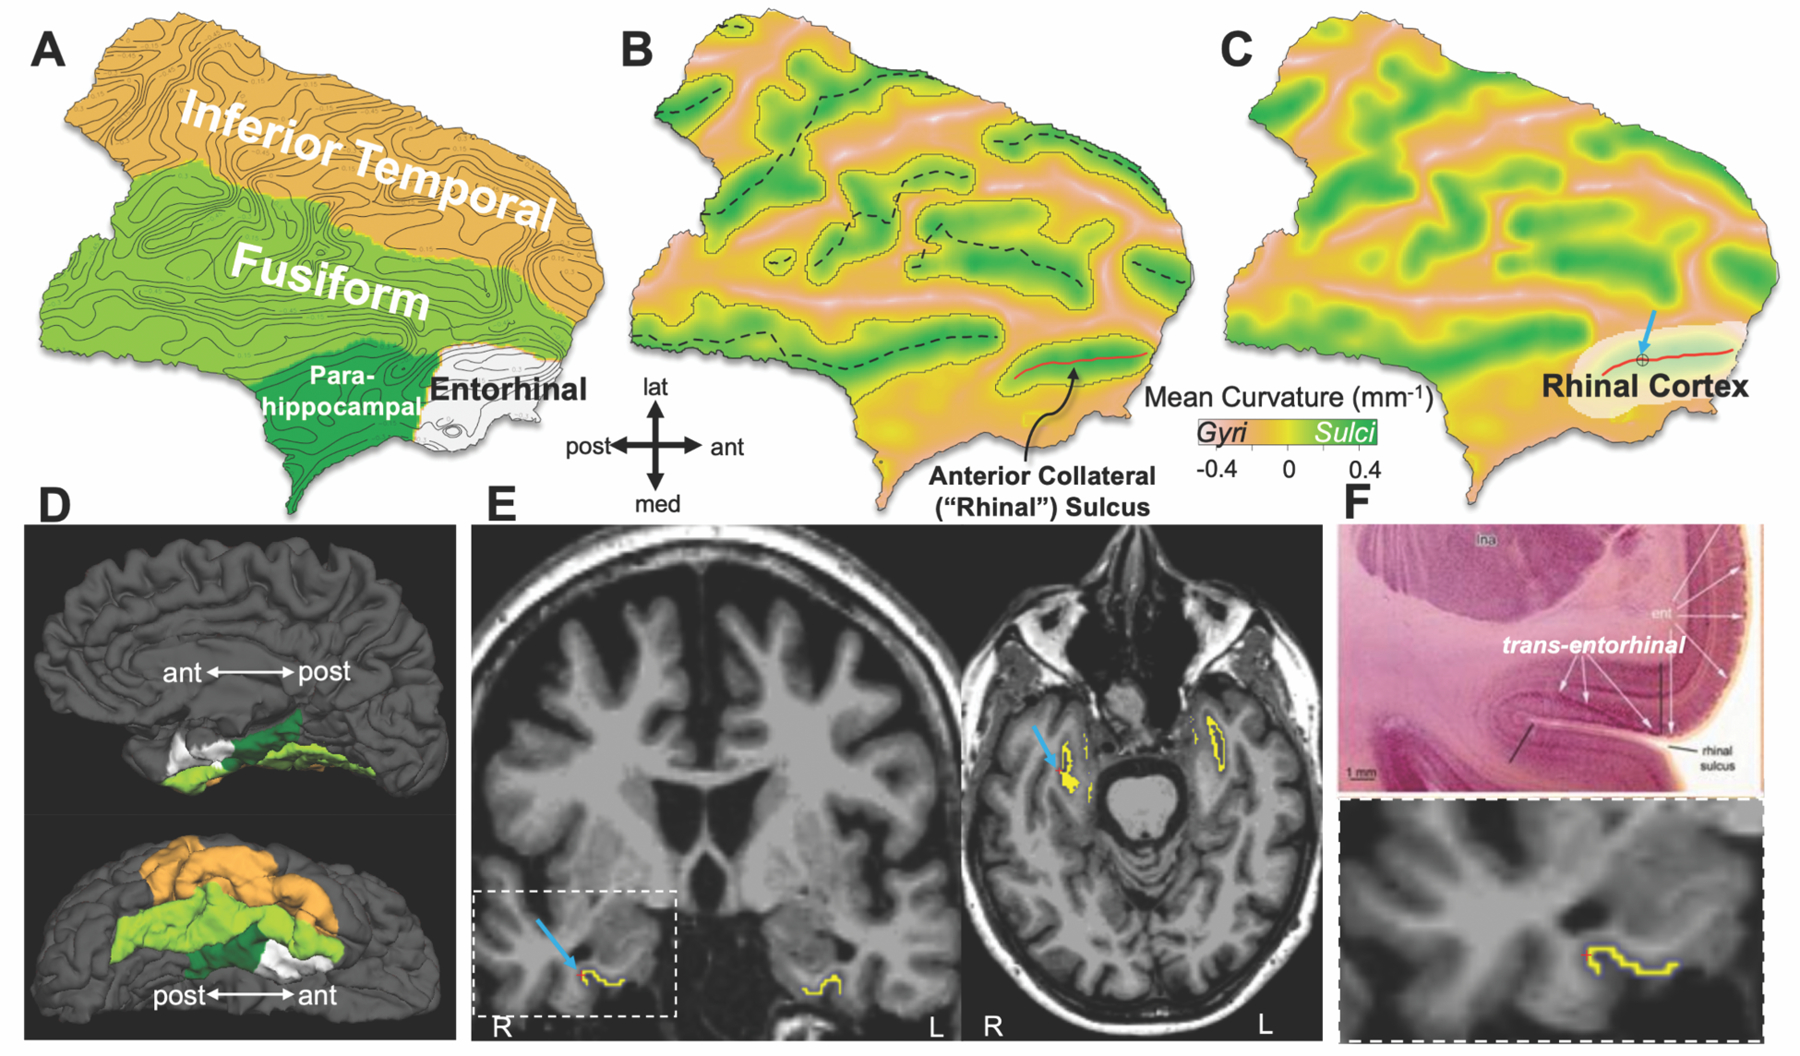
(A) Flattened temporal cortical ROI of a 69-year-old participant’s right hemisphere, indicating surface curvature with contour lines at increments of 0.15mm−1.
(B) Surface shown in (A), color encoded by surface curvature according to color bar; dashed curves approximate fundi as defined by connected vertices of maximum curvature; anterior collateral / rhinal fundus shown in red.
(C) Boundary of the rhinal cortex (RC) ROI (white overlay) defined as described in Methods, in relation to rhinal fundus (red line).
(D) Corresponding right hemisphere pial surface in medial (upper) and inferior (lower) views, with FreeSurfer parcellation overlaid in colors corresponding to (A).
(E) RC surface label (yellow) projected back onto slice data in coronal and axial views, with cursor and arrows corresponding to same location cursor and arrow from (C).
(F) Top, slice image showing neuropathologist’s transentorhinal region at postmortem, defined by black bars (from Braak & Del Tredici, 2015 (5), Fig. 3A); bottom, enlarged coronal view of RC volume label (yellow) in vivo.
We tested whether cross-sectional TAU PET measures were consistent with cortical TAU signal occurring first in RC independently of Aβ burden and then spreading to temporal neocortex in association with Aβ and clinical impairment. To accomplish this, we first divided our cross-sectional sample on the basis of Aβ burden (determined by PiB PET; low-Aβ = distribution volume ratio (DVR)<1.35 normalized to cerebellar cortex, partial volume-corrected (PVC), ~20 Centiloids, Fig. S3) (26) and clinical diagnosis (Table 1) to separately evaluate the low-Aβ clinically normal (CN) subgroup and optimize detection of initial TAU emergence. Based on post-mortem observations, we hypothesized that a subset of individuals in the low-Aβ CN subgroup would have elevated TAU restricted to RC, consistent with initial emergence. We identified statistical elevations in TAU PET (Flortaucipir, FTP) signal (standardized uptake value ratio, SUVr) within these subgroups by assessing the bimodality of regional FTP SUVr distributions modeled with Gaussian mixture models (GMM, see Methods), where greater likelihood of bimodality (likelihood ratio test, LRT) in a distribution indicates the presence of a subset of individuals with elevated PET signal distinguishable above a noise floor of negligible FTP retention.
Table 1. Participant characteristics.
Demographics for continuous variables given as mean±SD [range]. For APOE, e2+ includes e2/e3, e2/e2; e4+ includes e4/e3, e4/e4. 51 subjects did not have available APOE data (39 low-Aβ CN, 2 high-Aβ CN, 2 low-Aβ MCI, 8 high-Aβ MCI-AD).
| Baseline (N=443) | Low-Aβ CN | High-Aβ CN | Low-Aβ MCI | High-Aβ MCI-AD | All |
|---|---|---|---|---|---|
| N | 327 | 61 | 7 | 48 | 443 |
| Age | 60.8 ± 14.6 [20.8–92.8] | 75.3 ± 7.5 [57.8–91.5] | 80.9 ± 5.4 [75.2–90.0] | 70.1 ± 9.2 [49.5–87.8] | 64.1 ± 14.4 [20.8–92.8] |
| Females, N (%) | 170 (52.0) | 36 (59.0) | 2 (28.6) | 21 (43.8) | 229 (51.7) |
| Aβ burden (PiB DVR) | 1.14 ±0.07 [0.90–1.35] | 1.90 ± 0.39 [1.36–2.89] | 1.20 ± 0.06 [1.12–1.29] | 2.42 ± 0.46 [1.51–3.37] | 1.38 ± 0.49 [0.90–3.37] |
| Education (Y) | 15.2 ± 3.2 [2–20] | 16.1 ± 2.7 [12–20] | 16.9 ± 2.8 [12–20] | 16.3 ± 2.5 [12–20] | 15.5 ± 3.1 [2–20] |
| APOEe2+ N (%) | 35 (12.2) | 3 (5.1) | 2 (40.0) | 0 (0.0) | 40 (10.2) |
| APOEe4+ N (%) | 51 (17.7) | 36 (61.0) | 0 (0.0) | 33 (82.5) | 120 (30.6) |
| Longitudinal (N=104) | Low-Aβ CN | High-Aβ CN | Low-Aβ MCI | High-Aβ MCI-AD | All |
| N | 66 | 27 | 0 | 11 | 104 |
| Follow-up (Y) | 2.27 ± 0.50 [1.09–3.51] | 1.90 ± 0.50 [0.70–3.05] | – | 1.86 ± 0.99 [0.89–3.62] | 2.13 ± 0.59 [0.70–3.62] |
| Age | 73.4 ± 11.0 [28.5–90.0] | 77.6 ± 5.2 [68.2–88.2] | – | 65.5 ± 10.5 [49.5–86.5] | 73.6 ± 10.3 [28.5–90.0] |
| Females, N (%) | 39 (59.1) | 14 (51.9) | – | 3 (27.3) | 56 (53.8) |
| Aβ burden (PiB DVR) | 1.17 ± 0.07 [1.03–1.35] | 2.08 ± 0.41 [1.36–2.89] | – | 2.40 ± 0.28 [1.91–2.82] | 1.54 ± 0.55 [1.03–2.89] |
| Education (Y) | 15.4 ± 3.2 [8–20] | 16.3 ± 2.8 [12–20] | – | 15.5 ± 2.6 [12–20] | 15.6 ± 3.1 [8–20] |
| APOEe2+ N (%) | 4 (6.3) | 3 (11.1) | – | 0 (0.0) | 7 (7.0) |
| APOEe4+ N (%) | 10 (15.9) | 17 (63.0) | – | 7 (70.0) | 34 (34.0) |
We found that among 327 low-Aβ CN participants, RC TAU SUVr was bimodally distributed (LRT=44, bootstrap p=0.001), consistent with a subset of low-Aβ CN having elevated RC TAU PET corresponding to Braak I/II stages (Fig. 2A). Those in the low-Aβ group with elevated RC TAU (N=31, 9.5% of low-Aβ CN) were older (age mean ± SD 79.8 ± 7.8 vs 58.8 ± 13.6, t-test p<0.0001) but did not differ in sex, education, mini mental state exam score (MMSE), or age-adjusted Aβ burden from those with lower RC TAU (Table S1, S2).
Fig. 2. Initial cortical tauopathy typically occurs around collateral sulcus independently of Aβ.
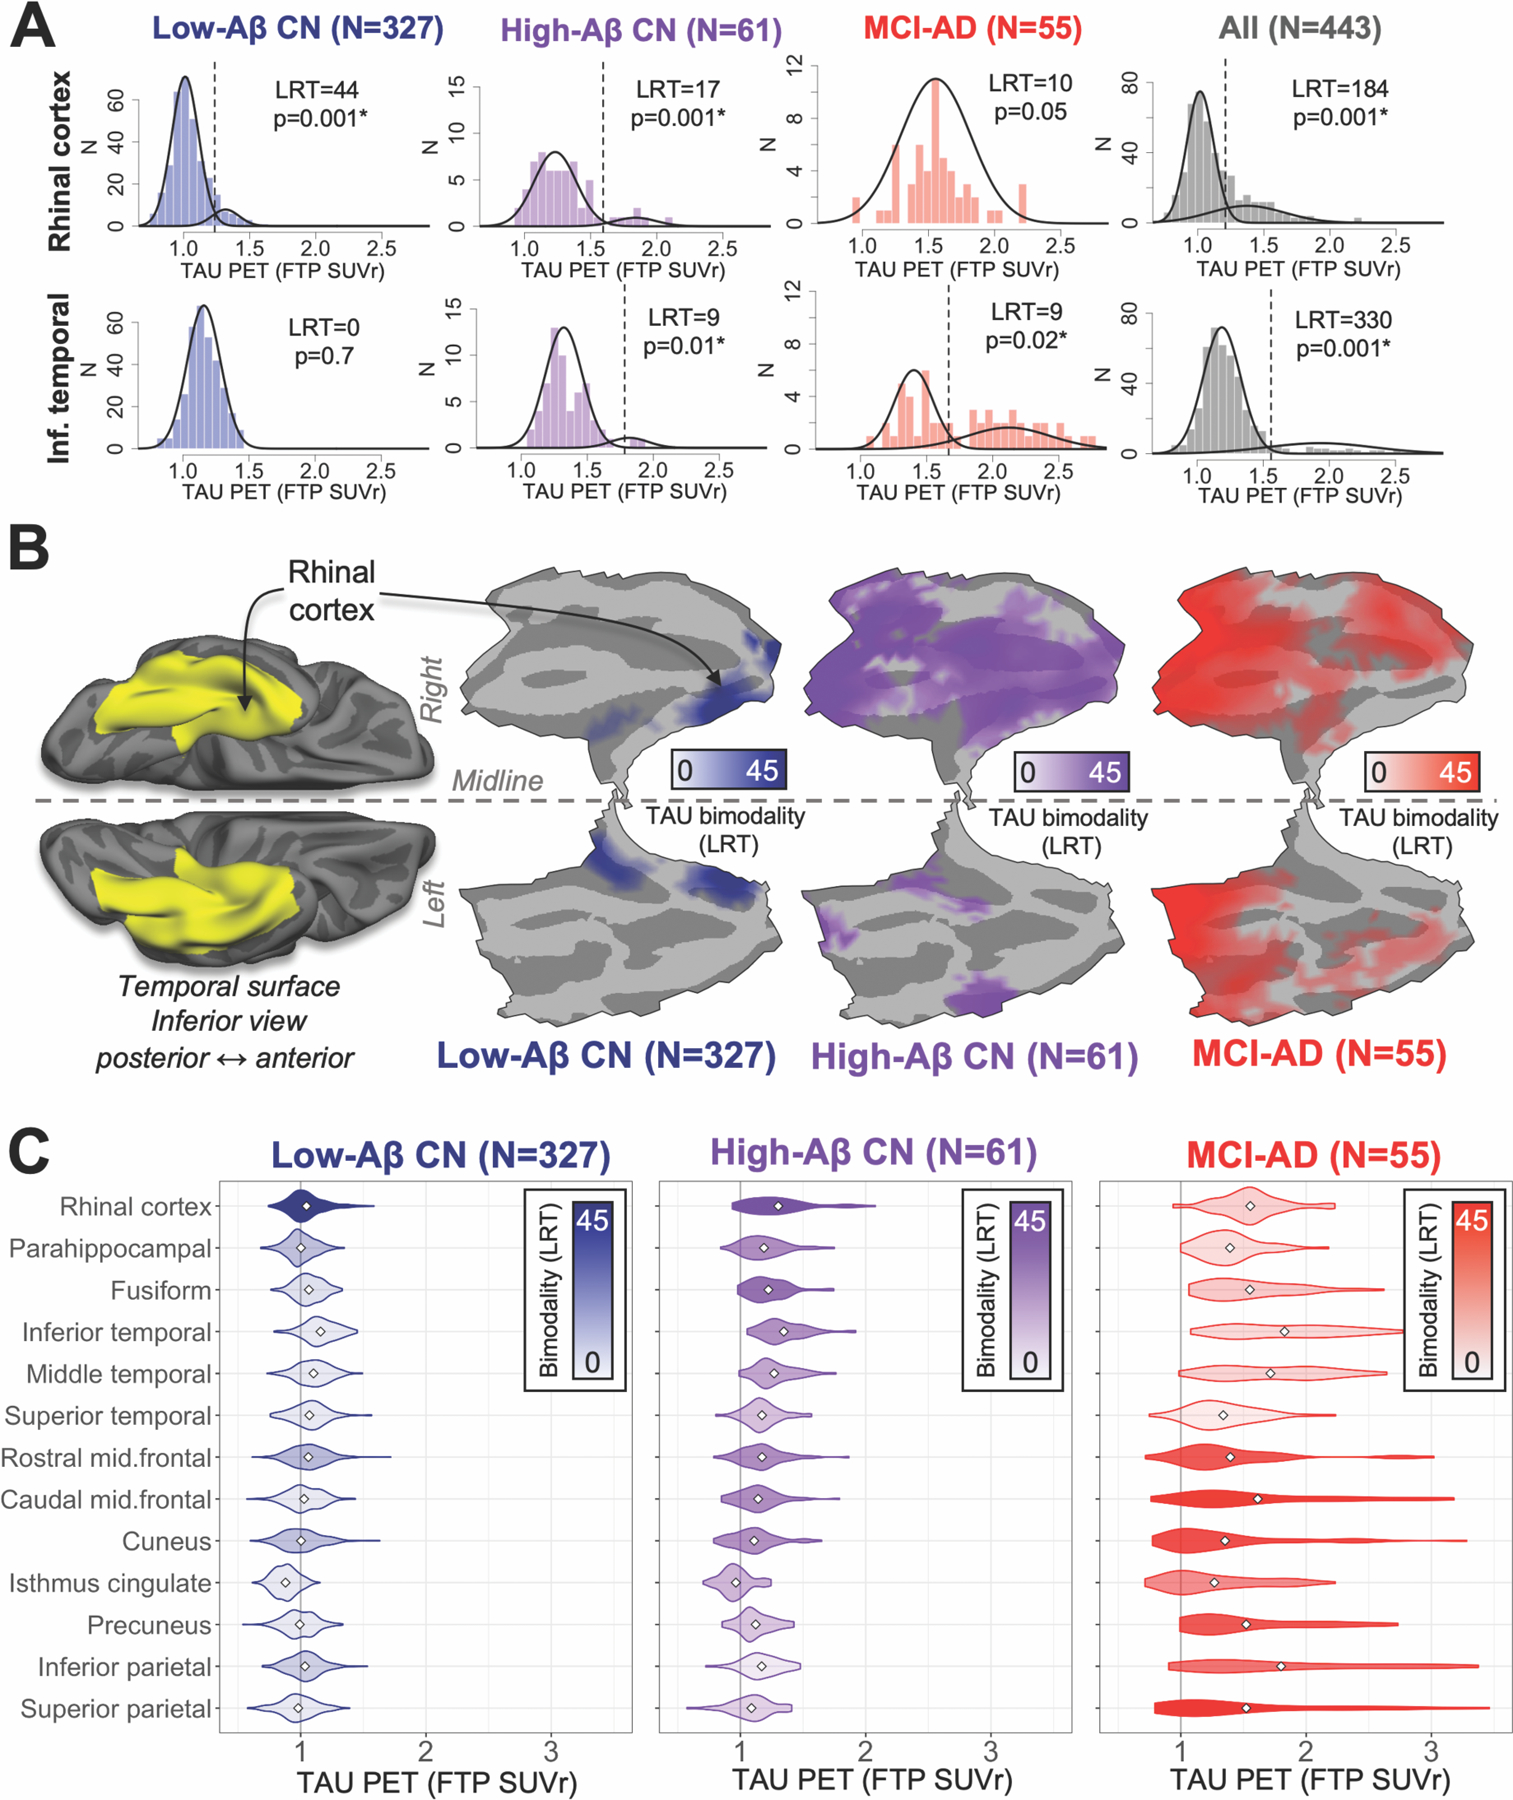
(A) Distributions of baseline TAU PET for rhinal cortex (upper) and inferior temporal gyrus (lower) within subsamples (columns). Bimodality of each distribution was statistically evaluated using likelihood ratio tests (LRT) comparing two- versus one-component GMM fits; higher LRT indicates greater likelihood of bimodality, * indicates significant bimodality (LRT bootstrap p<0.05). Best-fit GMM containing either one or two components are shown for each distribution as black curves; vertical dashed line indicates SUVr cut-point derived from two-component GMM.
(B) Left, inferior view of temporal lobe cortex shows region (yellow) in which vertices were tested for bimodal TAU. Middle to right, flat-map representations of temporal lobe cortex for each subgroup showing LRT value (colorbar) at vertices where FTP SUVr distributions were found to be bimodal (LRT p<0.01 after cluster-wise multiple comparisons correction).
(C) Regional distributions of baseline TAU for each subgroup. Fill color (inset legend) indicates bimodality of each distribution (LRT); white diamond indicates distribution mean.
In order to verify whether elevated TAU in low-Aβ CN was anatomically restricted to the MTL and centered in RC, we also assessed bimodality in TAU PET signal i) vertex-wise over inferior temporal lobe cortex normalized to standard space; and ii) in 15 additional cortical ROIs (defined with FreeSurfer (FS), Desikan atlas) vulnerable to TAU deposition in AD. Vertex-wise analysis showed that bimodally distributed TAU in low-Aβ participants was anatomically restricted to medial temporal cortex, and highest bimodality was observed in a cluster of vertices surrounding the anterior collateral sulcus, corresponding closely to RC (Fig. 2B). As expected, we did not observe bimodal distributions of TAU PET among low-Aβ CN in any of 13 neocortical ROIs, despite SUVr means being similar across ROIs (Fig. 2C, Table S3). Among MTL cortical ROIs (RC, FS-defined entorhinal and parahippocampal cortices), RC TAU had the highest likelihood of bimodality in low-Aβ individuals (Table S3; Fig. S2 shows comparison of RC and FS entorhinal), consistent with our hypothesis that RC includes the origin of MTL TAU PET signal.
Greater anatomic distribution of bimodally distributed TAU PET was observed in high-Aβ CN (N=61; Fig. 2), including both medial temporal and temporal neocortex (fusiform, inferior temporal). By contrast, participants with a clinical diagnosis of either mild cognitive impairment or Alzheimer’s dementia (MCI-AD, n=55) showed highest likelihood of TAU PET bimodality (LRT=25–45, p<0.01) in parietal/occipital (precuneus, cuneus, isthmus cingulate, inferior and superior parietal) and middle frontal ROIs, consistent with greater burden of tauopathy occurring later in the course of AD. Vertex-wise analyses of inferior temporal lobe cortex were congruous with these ROI findings (Fig. 2B). TAU descriptive and GMM statistics for each ROI in all subgroups are given in Table S3.
Longitudinal PET measures demonstrate emergence of initial tauopathy in rhinal cortex
We then assessed whether participants’ baseline profiles of elevated TAU SUVr and trajectories over time were consistent with a hypothesis of TAU progression beginning in MTL, spreading to temporal neocortex in association with Aβ, and extending further to extra-temporal neocortex in association with clinical impairment. For this purpose, we classified participants’ TAU PET SUVr values at baseline and two-year follow-up as high- or low-TAU based on two-component GMM thresholds for each ROI (Table S3) in the full baseline sample. We also assessed GMM with >2 components (trimodal or more) in each TAU PET distribution and found that these did not affect the thresholds or classification of elevated TAU (Fig. S4).
Cross-sectionally, elevated TAU restricted to a single ROI (consistent with initial emergence) occurred more frequently in RC than in any other ROI (56 RC vs. 5 other, exact binomial p<0.0001, Fig. 3A). Elevated TAU restricted to RC was observed within all Aβ and diagnostic subgroups (N/total = 32/327 low-Aβ CN, 18/61 high-Aβ CN, 4/7 low-Aβ MCI-AD, 2/48 high-Aβ MCI-AD, Fig. 3A). Among low-Aβ CN participants with elevated TAU in at least one ROI at baseline (43/327, 13%), a majority of these (74%) showed elevation only in RC, consistent with the hypothesis that TAU accumulation is typically restricted to MTL in those with low Aβ burden. Elevated RC TAU was observed in a majority of high-Aβ CN (37/61, 61%); a subset of high-Aβ CN with high RC TAU also had elevated TAU in at least one neocortical ROI (14/37, 38%), most commonly inferior temporal, middle temporal, and isthmus cingulate cortices. As expected, elevated TAU was common among MCI-AD: 95% (52/55, including low- and high-Aβ) were classified as high-TAU in at least one ROI. All 7 low-Aβ impaired participants had elevated RC TAU, with limited neocortical involvement, whereas high-Aβ MCI-AD participants showed greater anatomic distribution of elevated TAU PET signal (Fig. 3A). 65% (30/38) of high-Aβ MCI-AD participants had elevated TAU in parietal regions (precuneus, inferior and superior parietal); these regions were elevated in just 2% of all CN (Fig. 3A).
Fig. 3. Longitudinal PET measures demonstrate initial emergence of cortical tauopathy in rhinal cortex.
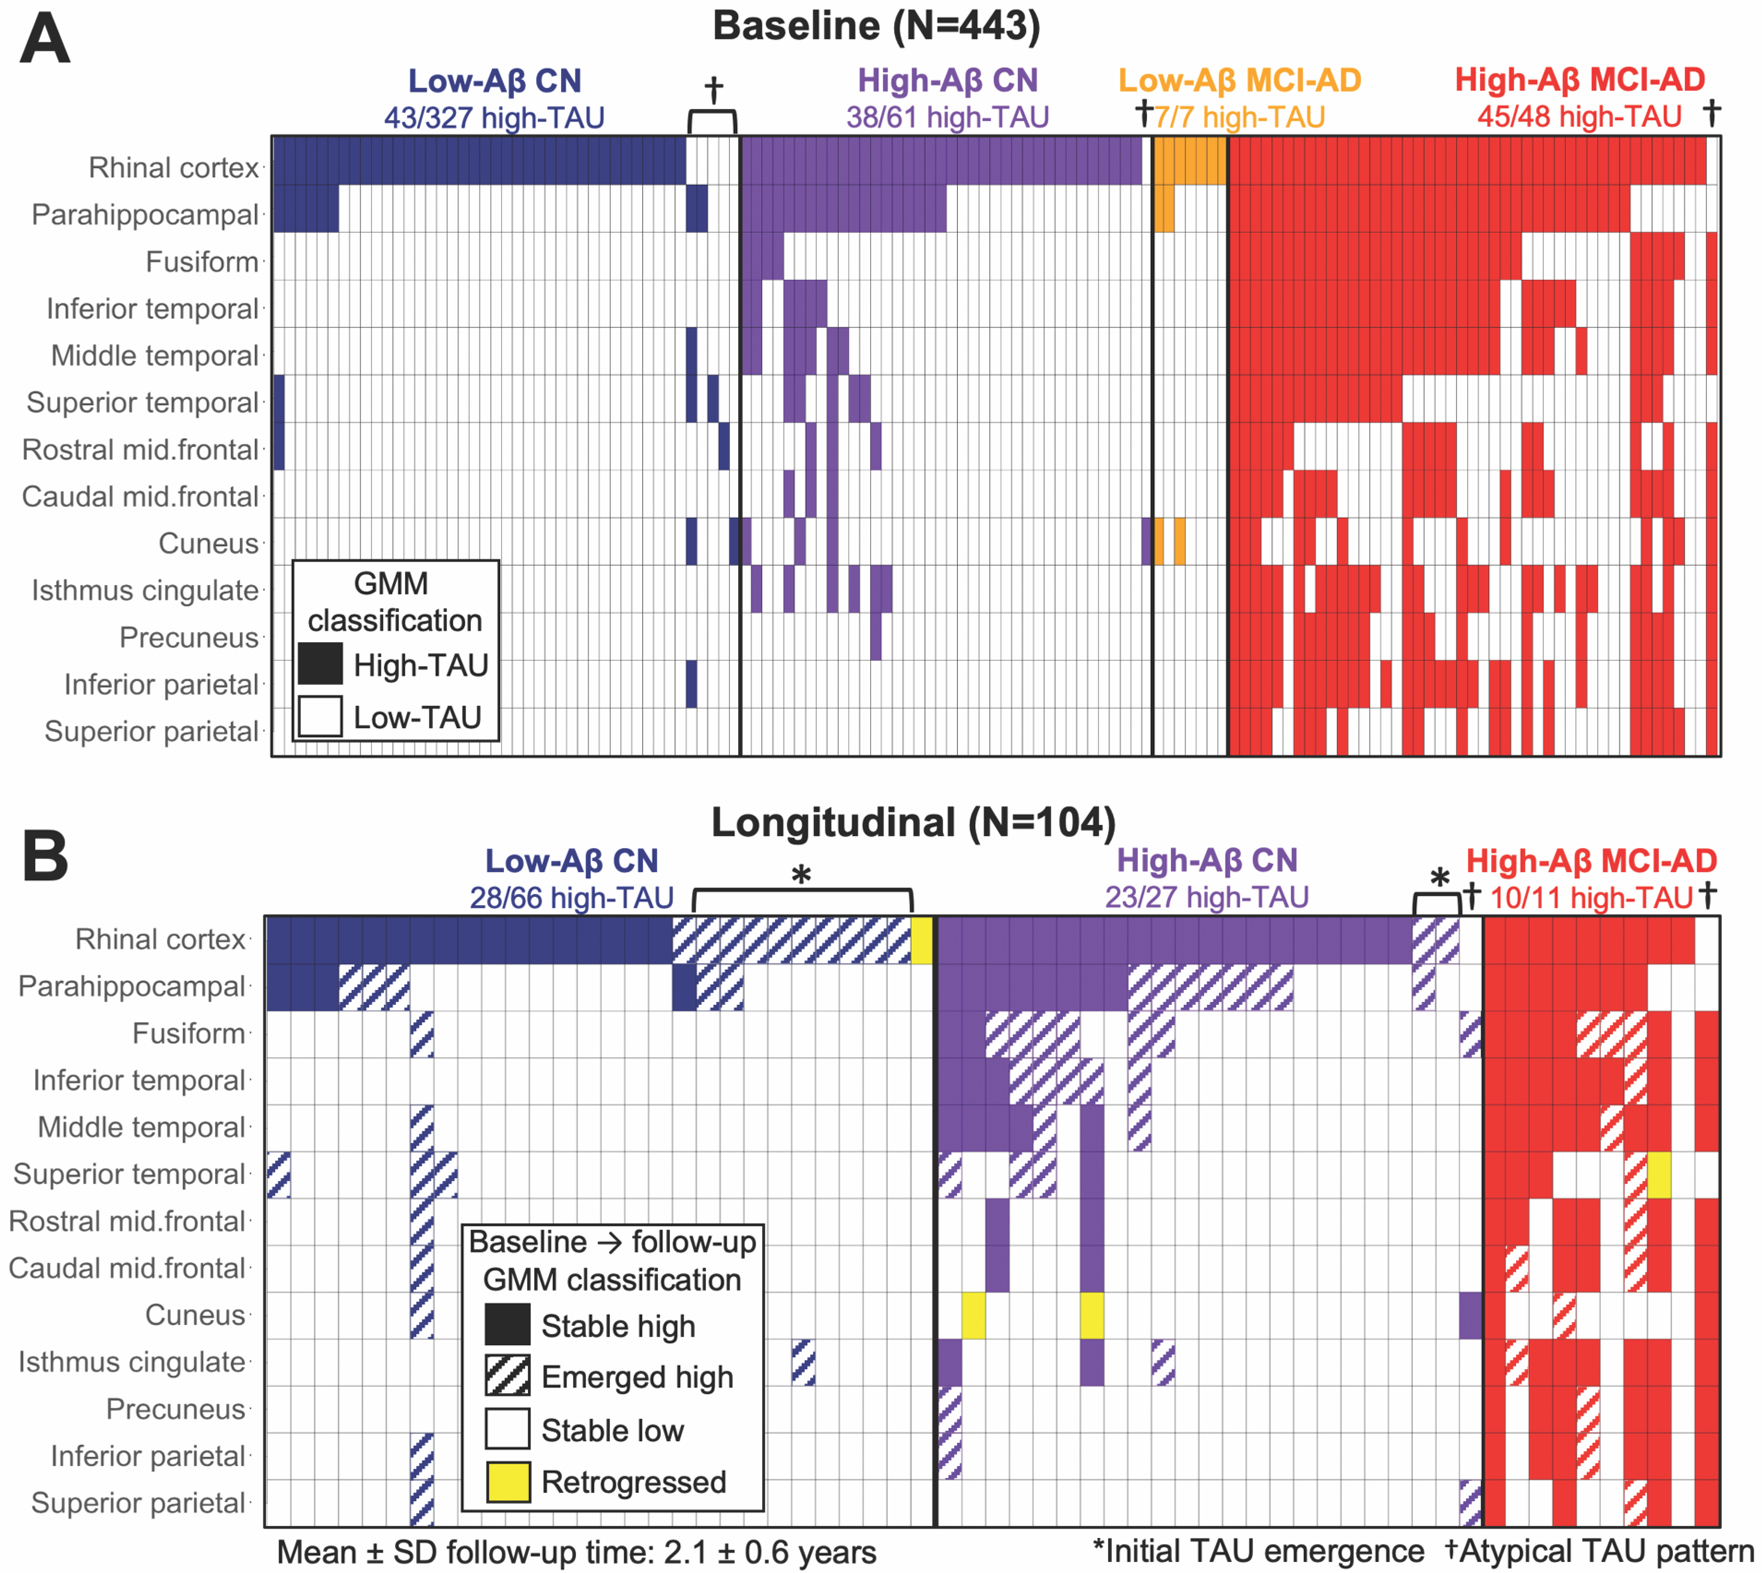
(A) Cross-sectional patterns of elevated TAU in participants who had elevated TAU in at least one ROI at baseline; each column represents an individual participant, and filled cells indicate in which ROIs (rows) TAU was elevated (based on GMM cut-points in full baseline sample, Table S3) in each participant. Participants (columns) are ordered and colored according to Aβ status and clinical diagnosis for visualization purposes. Elevated TAU in RC (top row) without elevated TAU elsewhere occurred more than in any other ROI, consistent with RC being the cortical origin of tauopathy. “Atypical” cases (5%) with apparent non-RC origins are indicated by †.
(B) Longitudinal patterns of TAU accumulation in participants (columns) who had elevated TAU in at least one ROI at baseline or two-year follow-up, colored according to subgroup, with fill pattern according to inset legend. Cases whose initial tauopathy emerged on follow-up are indicated by (*); several retrogressions were observed (yellow).
Confirming the cross-sectional findings, 54 of 104 longitudinal participants (Table 1) had no elevated TAU in any ROI at baseline, and 11 (20%) of these showed their initial emergence of elevated TAU in RC at two-year follow-up (Fig. 3B). Of those who showed initial emergence in RC on follow-up, 9 were low-Aβ CN and 2 were high-Aβ CN at baseline (Fig. 3B). Initial emergence of TAU PET signal was observed more frequently in RC than in any other ROI (11 RC vs 1 other, exact binomial p=0.006), supporting the hypothesis that RC contains the cortical origin of tauopathy. Consistent with cross-sectional measures, a majority of low-Aβ CN subjects with elevated TAU (24/28, 86%) showed TAU accumulation restricted to MTL regions, whereas high-Aβ CN showed additional accumulation in neocortical regions on follow-up, most commonly in temporal neocortex (Fig. 3B). All MCI-AD (longitudinal n=11, all high-Aβ) had high TAU in several regions at baseline and remained high on follow-up, with several subjects showing involvement of additional neocortical ROIs including parietal cortex on follow-up (Fig. 3B).
We also explored heterogeneity with respect to the origin of tauopathy and found several atypical cases with apparent non-RC TAU origins (N=7, 5% of all high-TAU, Fig. 3). One such case with a clinical diagnosis of AD had elevated TAU in neocortical regions but not MTL at both baseline and follow-up (Fig. S5A). This individual was notable clinically for having an early age of dementia onset (49 years old at baseline PET) and atypical symptomatology, but is not a known autosomal dominant AD mutation carrier. One high-Aβ CN participant had elevated TAU limited to cuneus cortex at baseline, and accumulated TAU in fusiform and superior parietal cortices on follow-up, which may indicate the onset of atypical AD (Fig. S5B). We observed five atypical low-Aβ CN cases: four of these showed elevated TAU restricted to a single non-RC ROI (one each in parahippocampal, superior temporal, rostral middle frontal, and cuneus cortices, Fig. 3A), and the fifth showed involvement of parahippocampal, middle and superior temporal, cuneus, and inferior parietal cortices (Fig. S5C). In longitudinal measures, four cases showed apparent retrogression from high-TAU to low-TAU in a single ROI (6% of all transitions observed, Fig. 3B), likely due to fluctuations in PET signal near the threshold.
TAU deposition is independently associated with age, amyloid, and APOEe4
We next aimed to quantify the extent to which TAU PET signal in RC and inferior temporal (IT) cortex, a proxy for temporal neocortex, was affected by age, fibrillar Aβ, and APOE genotype in each subgroup. We used a hierarchical regression approach, assessing simple linear models of age, Aβ, APOEe2 and APOEe4 predicting FTP SUVr, as well as multiple regression models combining these predictors and co-varying sex and education. Our primary aim in these analyses was to test the hypothesis that MTL and neocortical TAU have distinct contributions from age, Aβ, and APOE genotype.
In simple linear models, we observed weak but significant (p<0.0001) effects of greater age on higher TAU PET signal in both RC and IT among CN participants. In low-Aβ participants (age 21–92), this amounted to an increase in both regions of 0.006 SUVr per year of age, with stronger effects seen in high-Aβ CN (Fig. 4A). Among MCI-AD participants, greater age was not associated with higher RC TAU (p=0.37), and there was a significant negative association between age and IT TAU (β=−0.013, p=0.04), consistent with previous observations (Fig. 4A) (12). As expected, greater Aβ was associated with higher unadjusted TAU SUVr in both RC and IT among all CN and within the low- and high-Aβ CN subgroups (all p<0.03); whereas among MCI-AD, greater Aβ was associated with higher TAU in IT (β=0.44, p<0.0001) but not RC (β=0.08, p=0.18 Fig. 4B).
Fig. 4. TAU PET is independently associated with age, Aβ, and APOEe4.
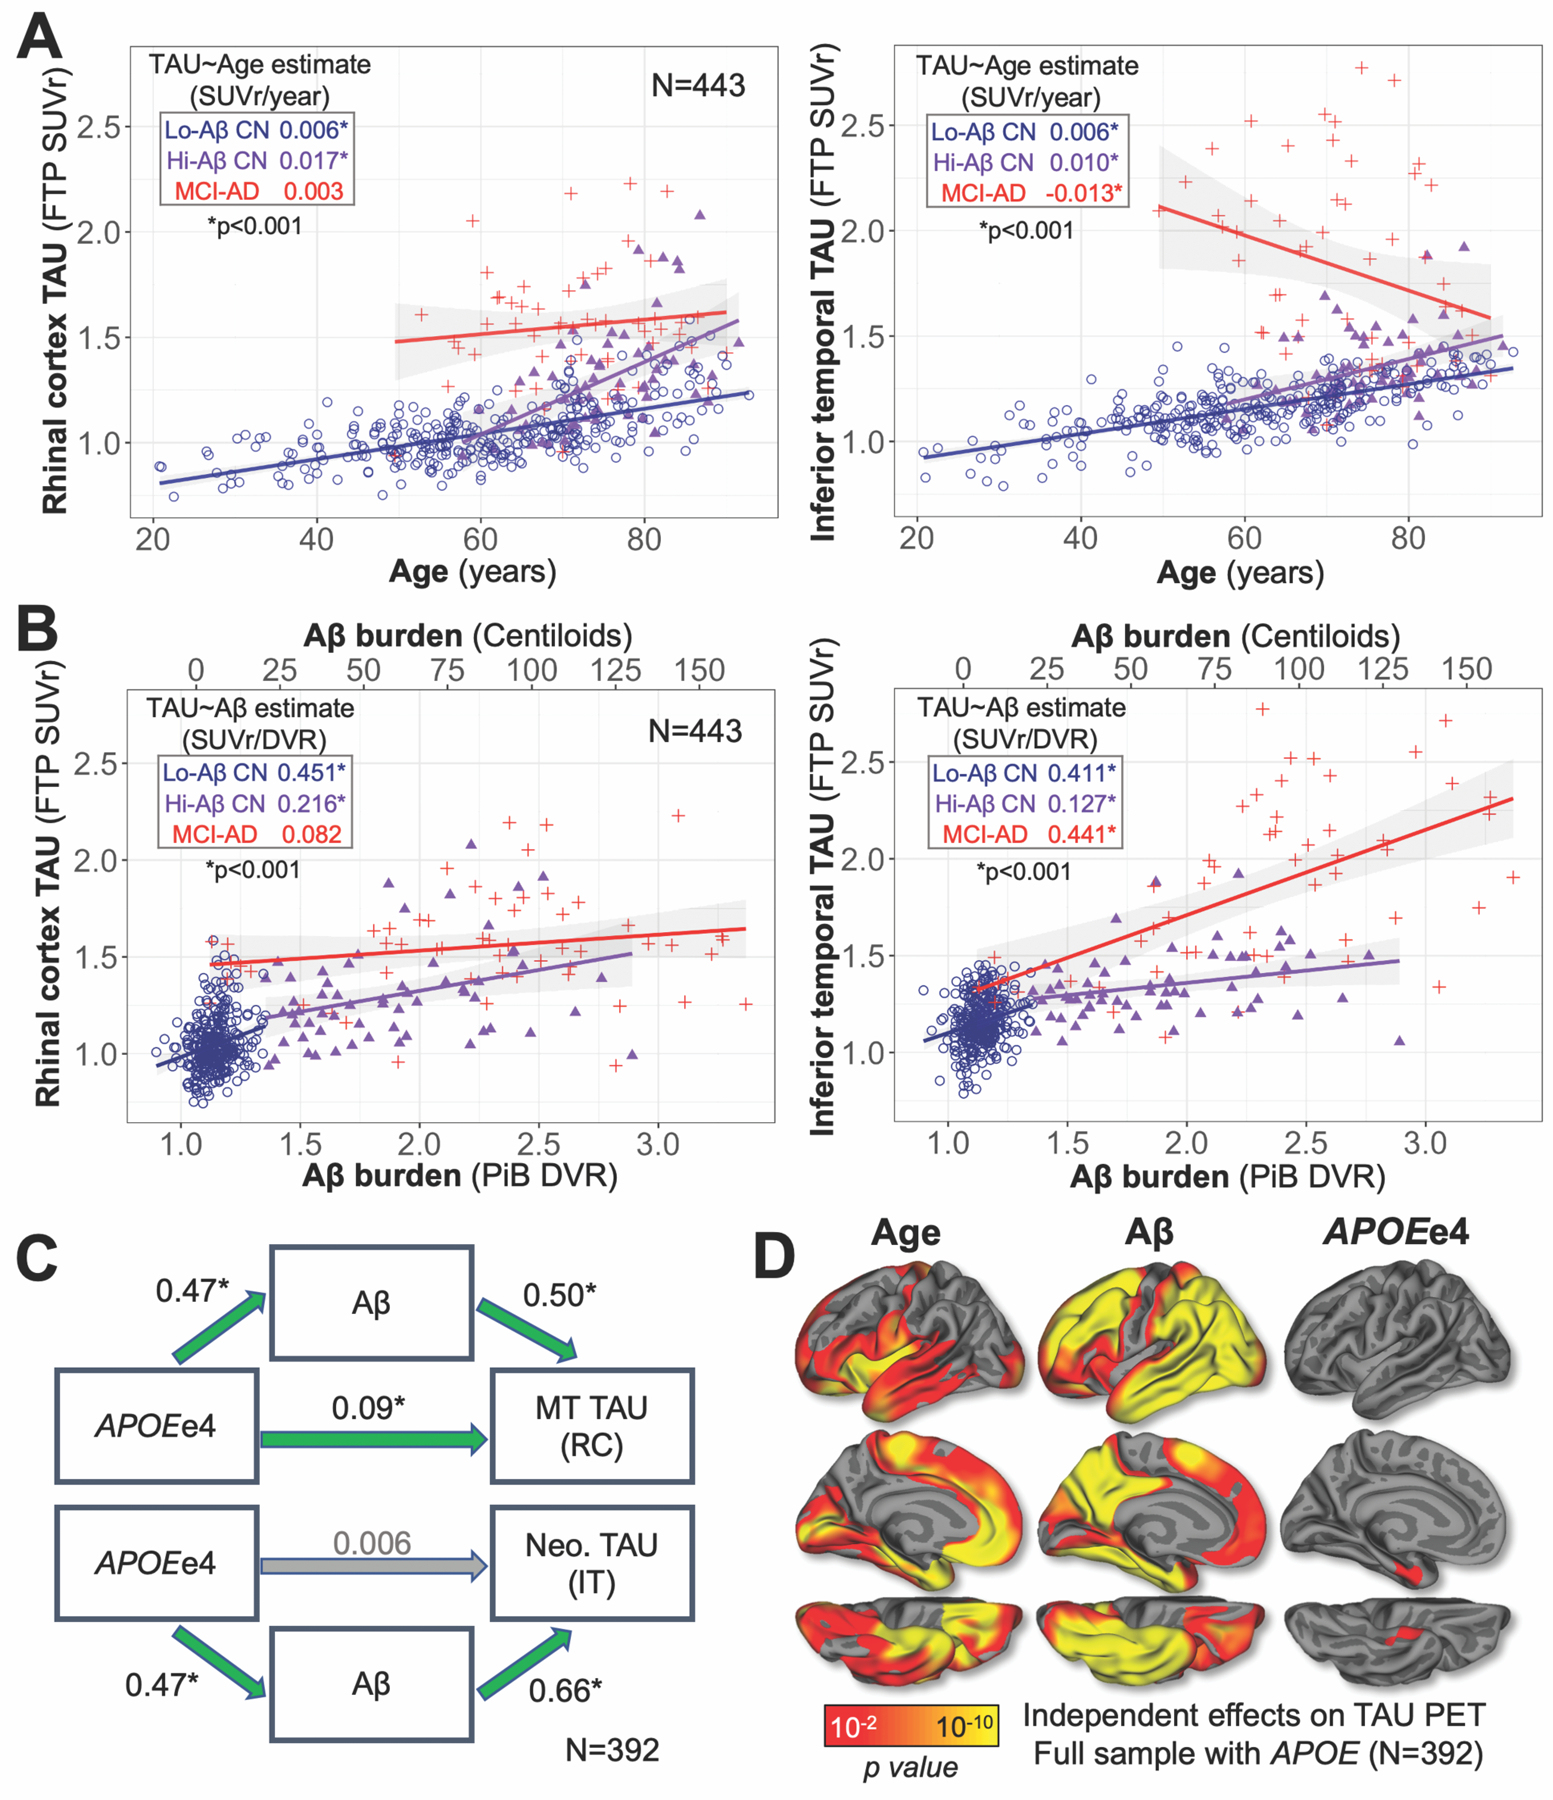
(A) Scatter plots show relationships between age and TAU in RC (left) and IT (right). Dot color encoded by subgroup according to inset legend; inset table gives the effect of age on TAU in each subgroup, quantified as the simple linear model estimate (SUVr/year, *p<0.001), with linear model fits shown graphically as lines with 95% confidence interval in shaded region.
(B) Relationships between Aβ and TAU PET in RC (left) and IT (right). Color encoding, inset table, and linear model fits are shown as in (A).
(C) Path diagram illustrating Aβ-mediated effects of APOEe4 carrier status on higher TAU PET signal in medial temporal (MT, top) and neocortical (Neo., bottom) regions, typified by RC and IT, respectively. All models were adjusted for age, sex, and education. Standardized regression coefficients are given for each path; green arrows and * indicate significant effects (p<0.05).
(D) Independent effects of age, Aβ, and APOEe4, covarying sex and education, on TAU PET across the cortex. Results are displayed as -log(p), p<0.05 after cluster-wise correction for multiple comparisons.
With both age and Aβ in the model (Table S4, top), we observed significant (p<0.001) independent effects of both age and Aβ on greater TAU in both RC and IT among all CN (including low- and high-Aβ). Within low- and high-Aβ CN evaluated separately, the age effects remained significant (p<0.001) and the Aβ effects did not (low-Aβ CN p>0.6; high-Aβ CN p>0.09, Table S4, top), suggesting that although TAU SUVrs were higher overall in high-Aβ compared to low-Aβ CN, TAU accumulation within these subgroups was independent of Aβ after adjusting for age. Within the MCI-AD subgroup, the negative relationship observed between age and IT TAU disappeared with the addition of Aβ to the model (p=0.37, Table S4, top), suggesting that this effect was attributable to greater Aβ burden observed in younger MCI-AD cases. Sex and education did not show effects on TAU in any of the models we tested when included as covariates.
We observed a significant effect of APOEe4 on greater RC TAU burden that was independent of both age and Aβ (β=0.049, p=0.02, Table S5). By contrast, we did not observe a significant independent APOEe4 effect on IT TAU with both age and Aβ in the model (β=0.004, p=0.86, Table S5). Given this finding, we performed a mediation analysis to quantify the extent to which the effects of APOEe4 on RC and IT TAU were mediated by Aβ in the full sample. We found that whereas APOEe4 carriers had elevated unadjusted TAU burden in both RC (β=0.172, p<0.0001) and IT (β=0.184, p<0.0001), this APOEe4 effect was partially mediated by Aβ for RC TAU (average causal mediation effect (ACME) β=0.123, 71.4%) and fully mediated for IT TAU (ACME β=0.180, 98.0%) (Fig. 4C). Analysis of additional ROIs and surface vertices revealed that significant effects (p<0.01 after cluster-wise multiple comparisons correction) of APOEe4 on TAU with both age and Aβ in the model were only observed in MTL (Fig. 4D right, Table S5), suggesting that APOEe4 may have an Aβ-independent effect on greater TAU burden specific to MTL.
In the full sample, APOEe2 carriers had lower TAU burden in both RC (β=−0.096, p=0.02, Table S6) and IT (β=−0.106, p=0.02, Table S7) compared to non-carriers. These effects were not significant with Aβ in the model (both p>0.4, Table S6–S7), suggesting that lower TAU burden in APOEe2 carriers was attributable to an effect of APOEe2 on lower Aβ burden. Of 40 APOEe2 carriers in our sample, none had elevated TAU in IT based on GMM, whereas 18% (7/40) had elevated TAU in RC (Fig. S6). Differences in regional TAU accumulation between APOEe2 carriers and APOEe3 homozygotes did not reach statistical significance (SUVr difference APOEe2-APOEe3/e3: RC=−0.037, t-test p=0.191; IT=−0.043, p=0.068, Fig. S7).
TAU increase is detectable in all sub-samples in both rhinal cortex and inferior temporal gyrus
We next characterized rates of TAU change (FTP SUVr/year) in ROIs and surface vertices within each subgroup. Significant mean RC and IT TAU increase was observed in both low- and high-Aβ CN (one-sample t-test p<0.001, Table S8), with higher rates observed in high-Aβ CN as expected (Fig. 5A). Compared to high-Aβ CN, MCI-AD showed marginally lower rates in RC and marginally higher rates in IT, suggesting that TAU accumulation may reach a plateau in RC at later stages while continuing to rise in IT. Descriptive statistics for TAU change rates in additional ROIs by subgroup are given in Table S8, and Fig. 5B shows surface maps of vertex-wise TAU change rates for each subgroup.
Fig. 5. Baseline Aβ predicts greater subsequent TAU increase in CN.
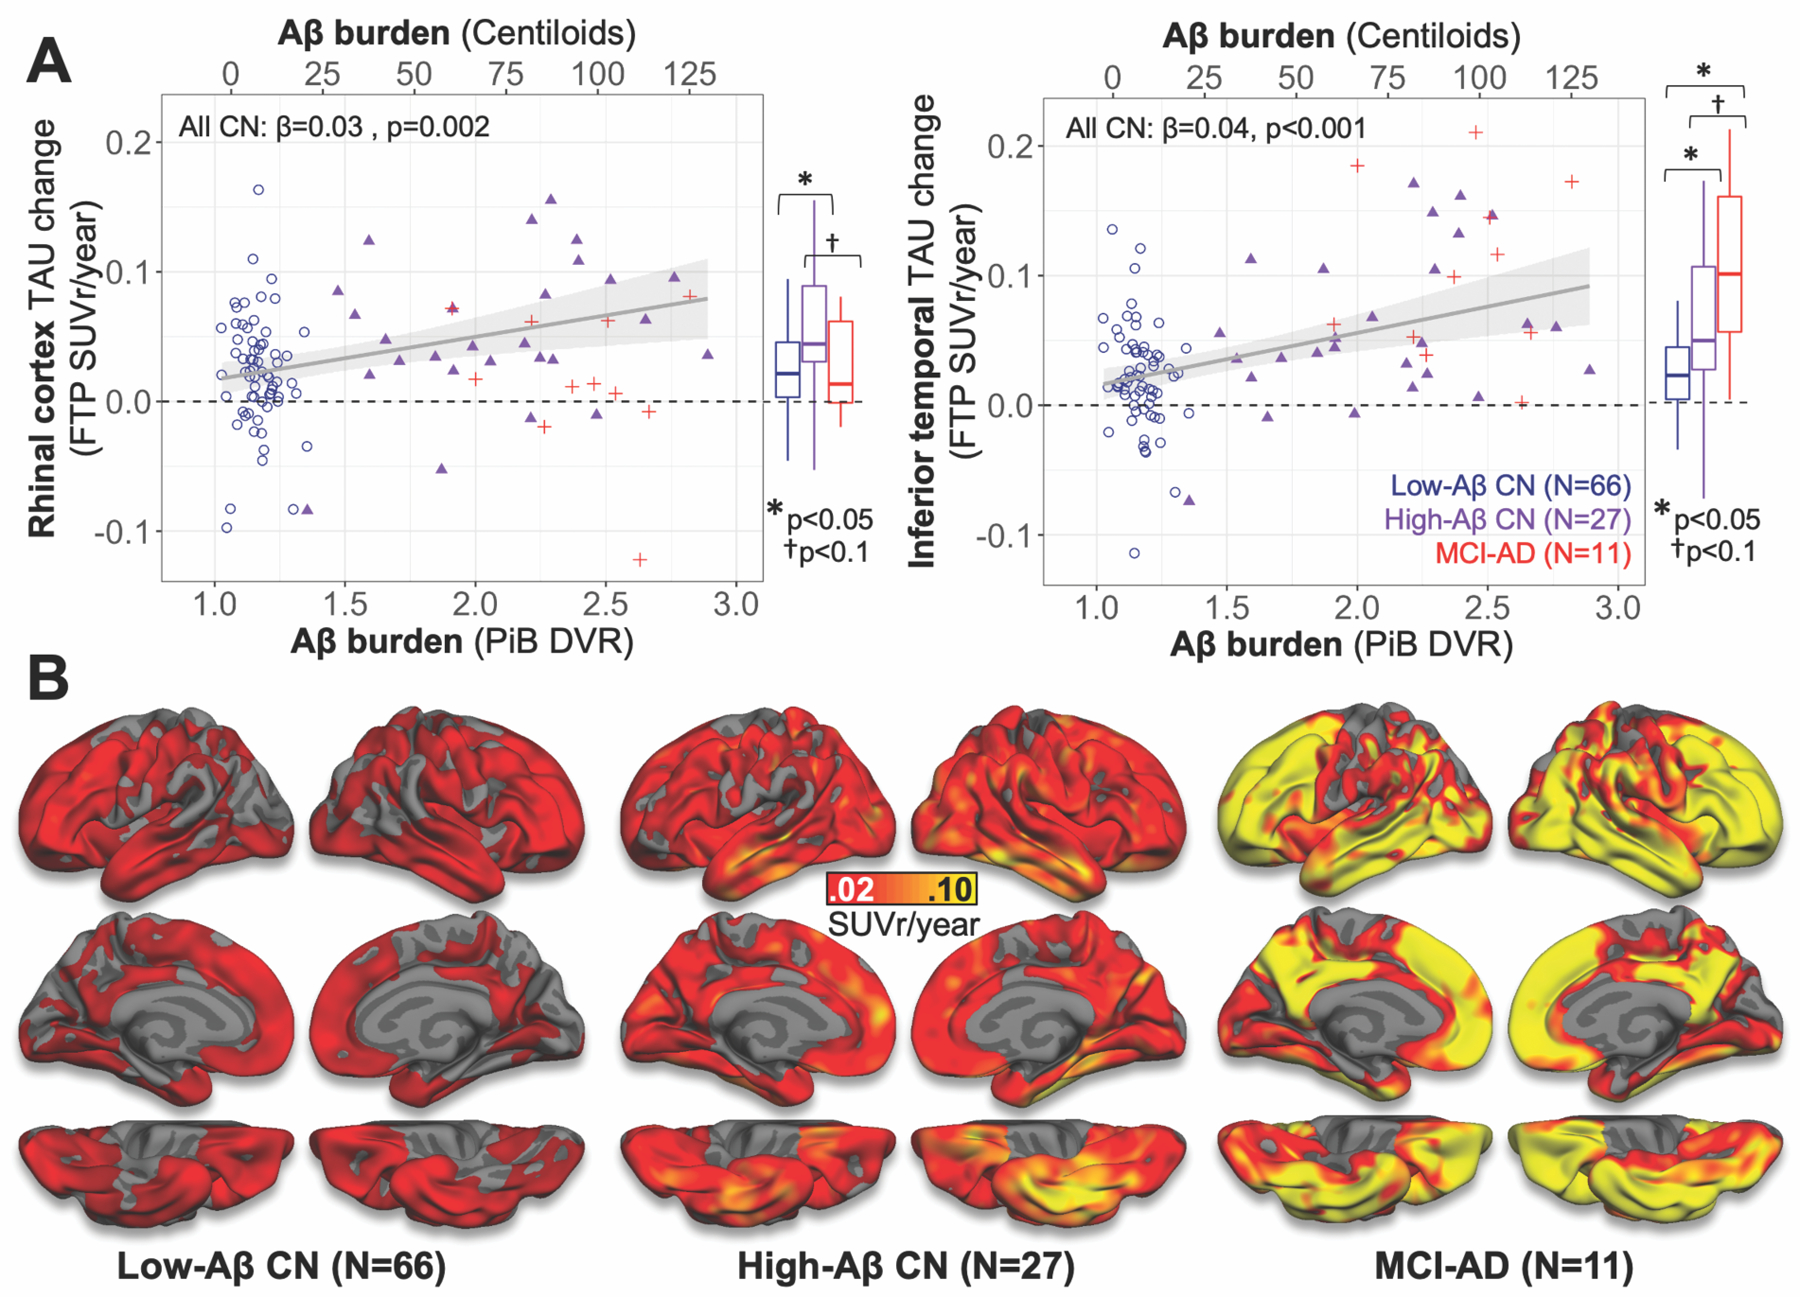
(A) Relationship between baseline Aβ and TAU PET change rates in RC (left) and IT (right). Dot color indicates subgroup (inset legend), and linear model fits to all CN are shown as grey lines with 95% confidence interval in shaded region. Box-and-whisker plots at right of each scatter plot describe TAU change rates in each subgroup, with group difference significance estimates (two-sample t-tests) indicated above.
(B) Surface maps show unadjusted group mean annualized TAU PET change rates across the cortical surface in each subgroup, according to color bar (middle). Similar surface plots for low- and high-Aβ CN with multiple comparisons correction applied are shown in Fig. S8.
We then used hierarchical regression to assess the effects of age, Aβ (PiB DVR), and APOE genotype on TAU change rates in RC and IT within CN; MCI-AD were excluded from these models due to small sample size (n=11). As expected, PiB DVR was associated with higher unadjusted TAU change rate in RC (β=0.033, p=0.002, Fig. 5A, Table S9) and IT (β=0.041, p<0.0001, Fig. 5A, Table S10). Age was marginally associated with higher unadjusted TAU change rate in RC (β=0.001, p=0.085, Table S9) but not in IT (β=0.001, p=0.32). The effect of age on RC TAU change rate was not significant with Aβ in the model (p=0.2, Table S9). APOEe4 carrier status had a significant effect on higher unadjusted TAU change rates in IT (β=0.032, p=0.004, Table S10) but not in RC (β=0.017, p=0.147, Table S9). The effect of APOEe4 on IT TAU change rates was not significant with Aβ in the model (p=0.15), suggesting that this effect was mediated by Aβ (Table S10).
Baseline MTL TAU outperforms neocortical TAU in predicting Aβ-associated neocortical TAU increase
Finally, we used hierarchical linear regression to relate baseline measurements of fibrillar Aβ, MTL TAU and neocortical TAU to subsequent neocortical TAU increase, again using RC and IT as proxy measures for MTL and neocortical TAU, respectively. We evaluated the extent to which baseline PiB, RC TAU, and IT TAU predicted neocortical TAU propagation by assessing unique and shared variance (R2) among these baseline predictors related to subsequent IT TAU change rate. Fig. 6A summarizes the unique and shared variance in IT TAU change rates explained by each predictor. In simple linear models, baseline RC TAU explained more variance in subsequent IT TAU change rates than baseline IT TAU (RC R2=17.2%; IT=9.3%, p=0.006), suggesting that RC signal is more closely associated with subsequent neocortical TAU increase. In the model combining RC and IT, baseline IT TAU explained virtually no unique variance in IT TAU change rates over and above that explained by baseline RC TAU (unique IT R2= 0.6%, p=0.4, Fig. 6A). Baseline PiB burden alone explained 15.7% of the variance in IT TAU change rates; in combined models, baseline RC TAU was found to explain a larger amount of unique (PiB-independent) variance in IT TAU change rates compared to baseline IT TAU (RC: 7.5%, IT: 2.9%, p=0.038, Fig. 6A). We next evaluated this finding at the vertex level and found that baseline TAU PET signal around the collateral sulcus explained the most variance in subsequent IT TAU change rates (Fig. 6B).
Fig. 6. Baseline MTL TAU predicts subsequent neocortical TAU increase.
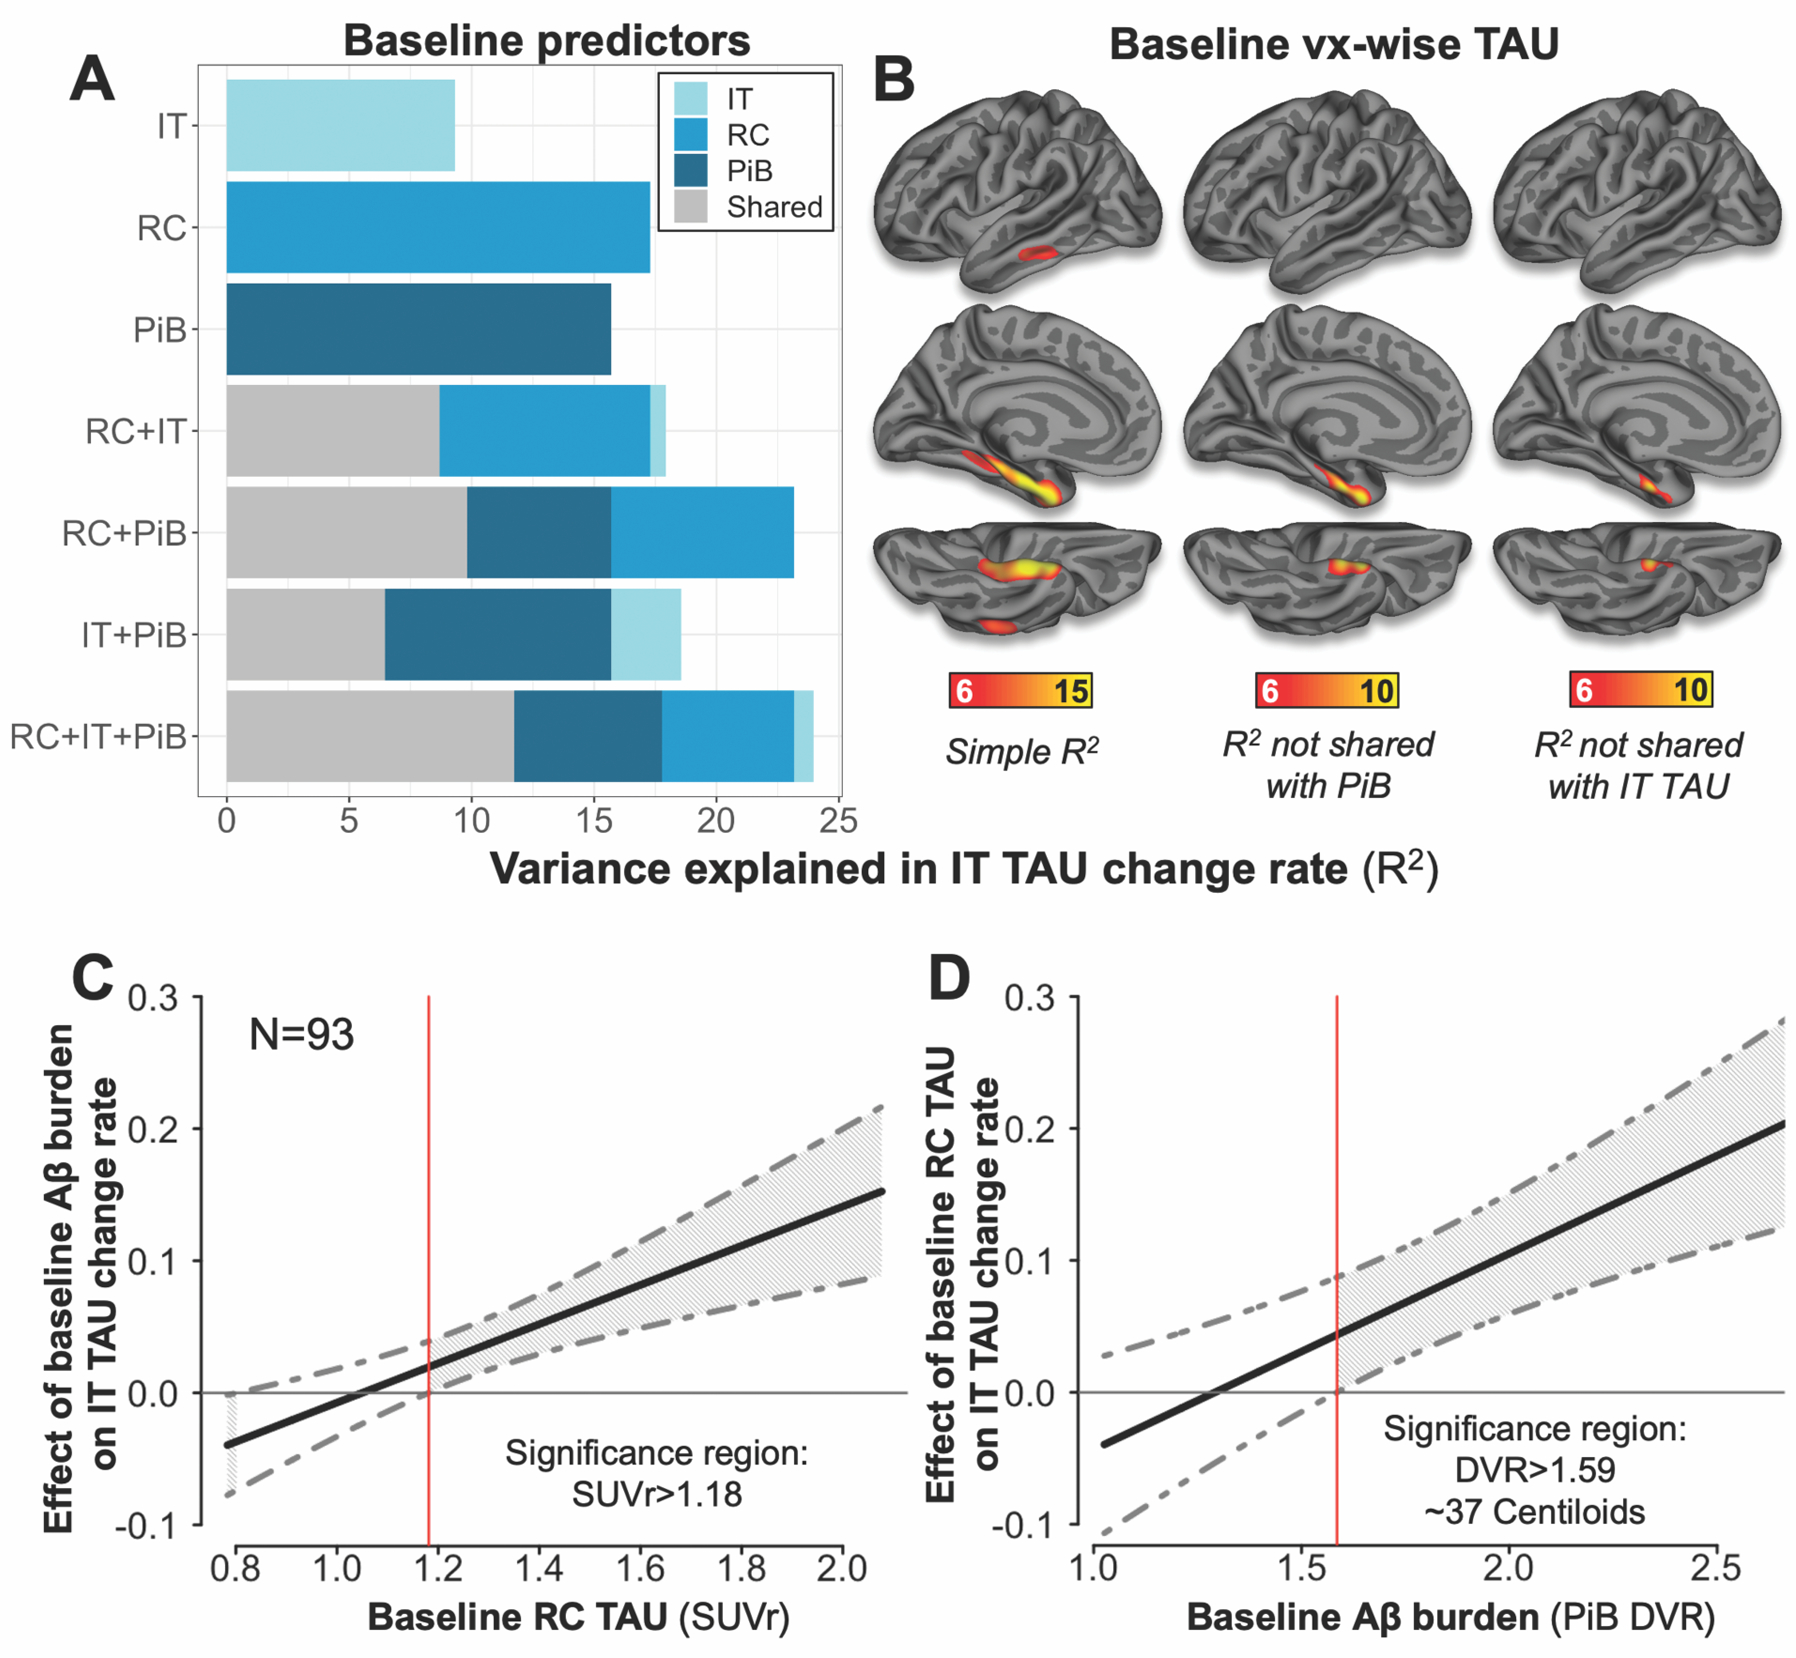
(A) Bar plot showing the amount of variance in inferior temporal (IT) TAU change rate explained by baseline predictors. The length of each bar represents the total variance in IT TAU change rates explained by those predictors (R2*100); the length of each color segment indicates the amount of variance attributable to unique (color) or shared (grey) variance among predictors, according to inset legend. RC=rhinal cortex TAU (FTP SUVr); IT=inferior temporal TAU, PiB=neocortical PiB DVR.
(B) Surface plots showing the amount of variance (R2, F-test p<0.05 after cluster-wise multiple comparisons correction) in IT TAU change rates explained by baseline TAU at each vertex: Left, total variance (simple linear model); Middle, unique variance of each vertex not shared with PiB; Right, unique variance not shared with baseline IT.
(C) Johnson-Neyman plot showing effects of baseline Aβ burden on IT TAU change at various values of RC TAU SUVr, with 95% confidence interval (CI) indicated by grey dashed lines.
(D) Johnson-Neyman plot showing effects of baseline RC TAU on IT TAU change at various values of PiB DVR, with 95% CI.
Models including an RC TAU:PiB interaction term explained the greatest amount of variance in IT TAU change rates (R2=35.2%). Given this finding, we identified using the Johnson-Neyman technique a threshold value of RC SUVr = 1.18 above which the interaction between baseline RC TAU and baseline PiB predicting subsequent IT TAU increase reached significance (β=0.147, p=0.0001) (Fig. 6C). Similarly, RC TAU was associated with subsequent IT TAU change when baseline PiB DVR was > 1.59 (~40 CL) (Fig 6D).
Discussion
PHF TAU can now be imaged in vivo and its change over time can be tracked, particularly as it relates to amyloid-b deposition in aging and AD. We identified the initial site of cortical PHF tauopathy detected with PET by evaluating participants ranging in age from 21 to 93 years and assessing change over time. TAU PET signal first emerges independently of brain Aβ burden in a small medial temporal region of allocortex along the banks of the collateral sulcus that we termed “rhinal cortex (RC)”, similar in location to the transentorhinal or perirhinal region reported at autopsy and consistent with Braak Stage I (1, 2, 27, 28). In our study, 13% of those with low amounts of Ab deposits (43/327) had elevated TAU and ranged in age from 58–92; of these, 86% had elevated TAU in RC and not in inferior temporal gyrus or neocortical regions, and in 9% of cases, neocortical regions were involved, and RC was not. In high-Aβ cognitively unimpaired participants, elevated TAU PET signal was seen in both medial temporal and neocortical regions, consistent with an Aβ-associated spread of TAU from RC to neocortex. In 65% of high-Aβ impaired individuals, elevated TAU PET signal was seen in neocortical regions not affected in CN individuals, including inferior parietal and precuneus, consistent with both clinicopathological correlation studies (2, 4) and previous PET studies showing widespread cortical tauopathy among impaired individuals (12, 13). Overall, these findings are consistent with a successive involvement of MTL, temporal neocortex, and extra-temporal neocortex that may be tracked over time.
Two-year longitudinal data confirmed these observations: among participants without evidence of elevated TAU at baseline, 20% (11/54) were found to have TAU deposition at follow-up, but only in medial temporal allocortex (11/11 in RC; 3/11 additionally in posterior parahippocampal cortex) and not in any neocortical ROI. Of participants with elevated TAU in MTL but not temporal neocortex (inferior temporal gyrus, IT) at baseline (N=37), only those with elevated Aβ showed emergence of elevated TAU in temporal neocortex on follow-up (0/19 low-Aβ, 6/18 high-Aβ). Together, these data support successive involvement that begins in RC, is initially independent of and often prior to global elevation of fibrillar Aβ, and spreads to temporal neocortex when fibrillar Aβ burden is high. Over the 2-year follow-up period, TAU PET signal increased in all diagnostic and aβ subgroups in both medial temporal and temporal neocortex, enabling evaluation of longitudinal TAU outcome measures. Importantly, baseline RC TAU PET measure was the best predictor of subsequent TAU expansion into neocortex characteristic of AD. These findings suggest that RC is a biomarker of downstream TAU spread to neocortex with potential utility for AD therapeutic trials in which reduction of TAU spread is an outcome measure. When PHF TAU deposition in the medial temporal lobe reached approximately 1.2 SUVr and amyloid burden reached approximately 40 CL, subsequent neocortical TAU accumulation was observed. These threshold values suggest that TAU spread into a typical AD-involved region, inferior temporal gyrus, begins at relatively low medial temporal TAU burden and global amyloid burden above a threshold generally considered to indicate abnormality.
Although validation of our RC findings requires postmortem correlations, they are consistent with existing postmortem observations implicating RC as the typical site of initial cortical tauopathy. We also explored heterogeneity with respect to the anatomic specificity of the origin and found that in 5% of those with elevated TAU SUVr, RC was apparently not the initial cortical site. These cases highlight the importance of evaluating TAU PET at the individual level to account for heterogeneity of AD pathology (29–31).
We assessed the contributions of age, Aβ, and APOEe4 to TAU PET signal and found cross-sectionally that RC TAU burden was independently associated with each of these three variables. Of note, direct effects of APOEe4 on increased TAU, independent of Aβ, were only observed in MTL regions, in contrast to neocortical regions, where the observed effects of APOEe4 on TAU PET signal were fully mediated by Aβ. These results are consistent with recent findings from animal studies showing that APOEe4 may have an effect on tauopathy and neurodegeneration that is independent of Aβ (32), and previous studies showing that Aβ mediates neocortical tauopathy more than it mediates MTL tauopathy (33). Additionally, neuropathological studies have reported that among young individuals without substantial Aβ deposition at autopsy, APOEe4 carriers were more likely to have NFT stage I tauopathy than APOEe4 non-carriers (34). Intriguingly, of 40 APOEe2 carriers in our sample, 18% had elevated MTL TAU and none had elevated TAU in temporal neocortex. TAU accumulation in APOEe2 carriers may be more conspicuous in MTL because the e2 allele protects against Aβ accumulation, limiting progression of TAU to neocortical regions. Differences in neocortical TAU accumulation between APOEe2 carriers and APOEe3 homozygotes were inconclusive in our data, but the effects of APOEe2 on regional TAU are worthy of additional investigation in future studies with larger samples.
We did not observe an independent effect of APOEe4 on RC TAU change rate, possibly due to a smaller sample with longitudinal measures or that APOEe4-carrying MCI-AD participants driving this cross-sectional association had high baseline RC TAU but low rates of RC TAU change. Interestingly, in longitudinal PET measures, although impaired participants showed the greatest rates of TAU change in most regions, we observed lower rates of TAU change in MTL regions in these individuals compared to CN. This finding is consistent with other longitudinal PET reports (18, 19) that have shown lower rates of TAU change in MTL compared to neocortex among impaired; on the other hand, another study found that entorhinal TAU change rates were higher in MCI and AD compared to CN, and that MCI participants showed higher rates of TAU change in entorhinal than in neocortex (22). Lower rates of MTL TAU change observed may be because MTL TAU burden has reached a plateau in these individuals.
We observed widespread cross-sectional associations between age and TAU in CN participants, particularly in MTL and temporal neocortical regions, and these associations were independent of Aβ burden and APOEe4 genotype. Notably, in low-Aβ CN, age was associated cross-sectionally with higher TAU in every ROI we tested, including extra-temporal regions where neuropathology data would not predict substantial accumulation of TAU in these participants . This is consistent with work from other groups showing a global age-related increase in FTP binding that may or may not be entirely TAU-related (35). By contrast, in longitudinal measures, age was associated with greater TAU change rate only in MTL regions, and only among the CN and low-Aβ CN subgroups, consistent with the common age-related accumulation of TAU in MTL (36, 37), although this effect was not statistically significant in RC and was fully explained by Aβ. Age-related MTL tauopathy in the absence of substantial Aβ deposits has been characterized as an independent phenomenon, known as primary age-related tauopathy (PART), that is discontinuous with progression to AD (37). Alternatively, some have held that early MTL tauopathy is continuous with and increases risk for Aβ-mediated AD pathologic change (36, 38). We observed elevated RC TAU PET signal in a sizable proportion (24%) of low-Aβ participants over the age of 60; determining whether these represent cases of PART or early AD will require additional longitudinal tracking of both TAU and Aβ.
Several studies have reported that higher entorhinal TAU PET signal is associated with worse memory performance in low-Aβ, CN individuals (39, 40), adding to the body of evidence that MTL TAU accumulation among those with Aβ deposition below typical thresholds is not benign, and may represent a therapeutic target (41). We did not assess correlations with memory performance in this study; however, it is notable that all seven low-Aβ MCI participants in our study had elevated TAU in RC but not IT, consistent with an effect of MTL TAU on cognitive impairment without elevated fibrillar Aβ. Additionally, two out of five of these low-Aβ MCI participants with known genotype information were APOEe2 carriers, consistent with the reported overrepresentation of APOEe2 in individuals with PART (42).
Our approach was based on autopsy reports of the pathoanatomy of early TAU vulnerability that led us to identify in each individual an MTL area we hypothesized to be the site of initial TAU deposition, to confirm this site of origin with a comprehensive search of cortical vertices, and to test whether TAU PET signal in this area was associated with subsequent spread into neocortex. We used GMM to identify statistically bimodal TAU PET distributions and corresponding SUVr thresholds of abnormality in each region or vertex, and the generalizability of these thresholds to independent samples is currently being evaluated. Alternative approaches to thresholding (43, 44) and quantification, including z-scoring (45), proportion of supra-threshold voxels (46, 47), and component scoring from independent component analysis (48), may provide important opportunities to confirm our findings.
Consistent with previous observations comparing neocortical and MTL TAU PET (12), we found that FTP SUVrs in IT were frequently higher than in RC; however, the SUVr distribution in RC was more bimodal than in IT, and the GMM thresholds differed between the two regions (RC: 1.21, IT: 1.56). Such differences in regional PET signal properties may reflect regional differences in the number of available FTP binding sites. It has been reported that FTP binds both neurofibrillary tangle (NFT) and neuritic plaque (NP) substrates of PHF TAU (49, 50), and neuropathological studies have shown that allocortex and limbic peri-allocortex, including our RC ROI, have fewer NPs than temporal neocortex, including IT (6). Thus, similar FTP SUVr values in different cortical regions may in fact reflect different amounts of pathological TAU burden: RC likely has fewer FTP binding sites, and therefore lower SUVr, than IT, despite it being the locus of initial NFT accumulation (51). These considerations, in combination with our findings, highlight the utility of using region-specific thresholds of elevated TAU in order to detect initial MTL tauopathy and account for the variety of substrates of TAU found in different regions of cortex.
We hypothesized that RC would be a more sensitive measure of initial MTL tauopathy than entorhinal cortex (EC), a commonly used MTL TAU proxy, owing to the specific design goal of RC to capture the trans-entorhinal region by utilizing individual measures of gyral and sulcal anatomy. Our data support this hypothesis: compared with EC, RC showed higher mean SUVr, lower within-ROI SUVr standard deviation, and detected a greater number of high-TAU individuals in cross-sectional data. We also assessed the RC for proximity to sources of known off-target FTP binding such as dura mater, and found that such artifacts were less likely with RC, being relatively confined to the banks of the anterior collateral sulcus, compared to EC, which abuts dura mater (52).
Our study has several limitations. First, our ability to detect the initial emergence of PET signal was limited by the sensitivity and noise characteristics of PET; it is likely that many more of our participants have MTL tauopathy than we report here (1), but that the amount of TAU deposition at this early stage is below the current detection threshold for PET. Second, our longitudinal TAU PET findings were based on two time points over a two-year follow-up period, whereas additional longitudinal tracking may allow for more robust estimates of change rates and enable the use of models that further clarify the temporal relationship between TAU and Aβ accumulation. Third, the lack of racial and ethnic diversity among the participants in this study potentially limits the generalizability of our findings; additional efforts to enhance diversity in clinical and translational research are urgently needed.
These limitations notwithstanding, our findings have important implications for the central model of AD pathogenesis as well as AD therapeutic strategies. We demonstrate that initial emergence of TAU PET signal is detectable in MTL on an individual basis, and MTL TAU is a harbinger of future neocortical TAU accumulation. TAU spread into neocortex is observed when both MTL TAU and global Aβ are elevated, implying that intervention against either of these pathologies at an early stage could be effective in halting AD progression.
Materials and Methods
Study Design
Our primary objective was to observe and longitudinally track the progression of cortical tauopathy across a range of ages, Aβ burdens, and degrees of clinical impairment. We hypothesized that initial emergence of TAU PET signal would be observed in RC, particularly among those with low Aβ burden, and that both cross-sectional and longitudinal TAU PET measurements would be consistent with a progression from MTL to temporal neocortex to extratemporal neocortex. To test this, we included 443 participants (Table 1) who underwent TAU and Aβ PET from several observational studies of aging and AD: 230 were from the Harvard Aging Brain Study (HABS) (12); 134 were from the Framingham Heart Study (FHS), representing an initial subsample of 200 FHS 3rd generation participants (53) aged 35–75 years and randomly selected across deciles of vascular risk; 24 were clinically normal, Presenilin-1 E280A non-carrying participants (age mean±SD [range] = 38±7 [28–55] years) from the COLBOS Study (54); and 55 participants with a clinical diagnosis of mild cognitive impairment (MCI) or Alzheimer’s dementia (AD) based on standard criteria (55), excluding atypical AD cases, were recruited from memory disorders clinics at Massachusetts General Hospital and Brigham and Women’s Hospital. 371/443 (84%) self-identified as non-Hispanic white; details for self-identified race and ethnicity of participants are given in Table S11. All participants received magnetic resonance (MR) imaging and TAU and Aβ PET at baseline. A subset (N=104, Table 1) underwent two-year follow-up TAU PET; of these, 90 were CN HABS, 11 were MCI-AD, and 3 were CN non-carriers from COLBOS. All participants provided informed consent after having the nature and possible consequences of the study explained to them and were studied under protocols approved by the Partners Human Research Committee. Image evaluation was performed by individuals blinded to participants’ clinical status; each participant underwent identical evaluations, so no randomization occurred. Sample sizes were not calculated or determined in advance; all available cross-sectional and longitudinal data from the above studies were used.
MRI
Structural T1-weighted data were acquired in non-FHS participants using a Siemens 3 Tesla Tim Trio (Siemens; TR 2,300ms, TE 2.95ms, angle 9 degrees, voxels 1.05 ×1.05 × 1.2mm), and in FHS using a Philips 3 Tesla Achieva (Philips; TR 6,800ms, TE 3.1ms, angle 9 degrees, voxels .98 × .98 × 1.2mm). Images were FreeSurfer (FS v6.0) processed (http://surfer.nmr.mgh.harvard.edu) to identify cortical surfaces and standard regions of interest (ROI) for PET sampling (56–58).
PET
11C-Pittsburgh Compound B (PiB) and 18F-Flortaucipir (FTP) were prepared and PET was acquired according to previously published protocols (12). Briefly, PiB retention was expressed as the distribution volume ratio (DVR) by Logan (40–60 min) with cerebellar cortex reference. FTP was expressed as SUVr (80–100 min) with cerebral white matter reference (21). The DVR is a more quantitative measure of ligand binding that requires longer scan times (60 min or more) than SUVr (10–30 min). The in vivo kinetics of PiB permits estimates of DVR from 60-minute datasets and it was routinely feasible to do so. The in vivo kinetics of FTP do not yield robust 60-minute DVR estimates, as longer post-injection imaging times are required (compared to PiB), and a late scan SUVr is used instead (80–100 min). These quantification methods have been validated for each radioligand against fully quantitative approaches (full dynamic modeling with arterial sampling) and minimize patient burden. PET data were evaluated with and without partial volume effect correction (PVC) using GTM for voxel-based ROI (59) and extended Muller–Gartner for surface analyses (56) (Fig. S9). The mean±standard deviation (SD) lag time between PiB and FTP PET examinations was 11.3±12.3 weeks (maximum, 50.9).
PET images were co-registered to the corresponding baseline T1 image (SPM8), and FS-derived ROIs were sampled. Global Aβ burden was represented using PiB DVR in a large neocortical aggregate (FS-defined FLR region) (12, 60). For dichotomous Aβ, low-Aβ was defined as PiB DVR (PVC) <1.35 based on full sample GMM. PiB PET data were normalized to an approximate Centiloid (CL) scale (26) for comparison with other studies; details of this procedure are given in Fig. S3.
Cortical FTP retention was assessed using vertex-wise surface mapping at the grey matter midpoint (12). Based on previous neuropathology (1) and PET data (12, 20), we assessed medial temporal, temporal neocortex, parietal/occipital neocortex, and anterior midline regions (FS Desikan parcellation) (57). We excluded regions vulnerable to nearby off-target binding, including lingual and lateral occipital gyri and hippocampus (61, 62). For standard space vertex-wise analyses, FTP SUVr images were projected onto the fsaverage surface and surface-smoothed to an equivalent 8mm FWHM Gaussian kernel.
Identification of a Rhinal Cortex ROI for detection of initial MTL TAU PET signal
We identified a “rhinal cortex” (RC) ROI using a procedure that served two purposes: to identify each brain’s transentorhinal region accounting for anatomic variability, and to sample a target volume of brain tissue sufficient for reliable TAU PET measures. We opted for the name “rhinal cortex” so as to distinguish it from microscopy terms as well as from the existing Desikan atlas ROIs (57). Gyral and sulcal temporal anatomy were identified on each individual hemisphere (24, 63), sulcal fundi were identified by tracing local surface curvature maxima (64), and collateral sulcus (CS) was identified as the sulcus separating fusiform and parahippocampal gyri (57) (Fig. 1, Fig. S1). The CS identification procedure was optimized to account for the expected normal anatomic variability in CS as either continuous or discontinuous (25, 28, 65), details for this procedure are given in Fig. S1.
To delimit an RC of sufficient volume to permit reliable PET measures to be acquired, we defined the RC boundaries as follows. The anterior and posterior bounds were the anterior extent of the collateral sulcus and the caudal end of the amygdala (posterior bound of FS entorhinal cortex) (57), respectively. The medial boundary included 8mm (geodesic) of the medial bank of CS, capturing trans-entorhinal/perirhinal cortex in all cases, and the lateral bound included 3mm (geodesic) of the lateral bank of CS (Fig. 1C,E). We found that the mean±SD surface area of RC defined in this way was 349±57 mm2, which we note is compatible with the resolution of the PET camera and comparable to FS-defined entorhinal cortex (Fig. S2).
RC surface labels were projected onto source slice data and assessed visually by a neuroanatomist (J.A.), in order to ensure that this automated procedure correctly identified the anterior collateral / rhinal sulcus and RC was consistent with the region identified by Braak as the location of AT8 positivity indicating Stage 1 tauopathy (1, 25). In all cases, RC included BA 35 as well as portions of BA 36 (lateral bank of CS); in some cases, due to expected variability in CS depth, RC additionally contained portions of lateral entorhinal cortex (Fig. S1).
Statistical Analysis
We assessed bimodality of FTP SUVr distributions using Gaussian mixture modeling (GMM), as follows. Each distribution was modeled using one- and two-component GMM, allowing for equal or unequal variances between modes in two-component models. We then compared two- versus one-component GMM fits using a likelihood ratio test (LRT), allowing for formal testing of the hypothesis that a distribution contains two components against the null hypothesis that it contains one. Larger LRT values provide evidence of bimodality, and the null distribution of the LRT statistic was approximated empirically by bootstrapping (1000 resamples). GMM with >2 components were assessed using Bayesian information criteria (BIC). All GMM analyses were implemented in R (version 3.4.1) using package mclust (version 5.3) (66). Vertex-wise LRT analyses were multiple comparisons corrected using a cluster-wise correction method (67) (p<0.01, minimum cluster extent k=100mm2).
We used hierarchical linear regression to assess the contributions of age, Aβ, and APOE genotype, covarying sex and education, to TAU PET signal and change rates. We tested hierarchical models predicting RC and IT TAU in each subgroup, and the full model predicting TAU in every ROI and surface vertex. Vertex-wise analyses used a threshold of p<0.05 after cluster-wise multiple comparisons correction. Mediation analyses shown in Fig. 4C were performed in R using the mediation package (v4.4.6).
We quantified the proportion of variance (R2) in IT TAU change rates explained by unique and shared variance among baseline PiB, RC TAU, and IT TAU using hierarchical modeling and variance decomposition. This same method was used to assess the variance in IT TAU change rates explained by baseline TAU PET SUVr at each vertex, in simple linear models and independently of baseline PiB and IT TAU. Surface maps were corrected for multiple comparisons as above (F test p<0.05, k=100mm2). Interaction models were probed using the Johnson-Neyman technique (R package probemod, v0.2.1) with a significance threshold of p<0.05.
Supplementary Material
Acknowledgments:
The authors thank all our participants for their generous contributions of time and effort, as well as David Jin, Evelyn Luner, Kirsten Moody, Tobias Estime, Danielle Mayblyum, Steve Weise, Eugene Lee, Nicole DaSilva, and Julia Scotton for help in study coordination and collection and processing of data.
Funding: This work was supported by National Institutes of Health grants P01 AG036694 (to R.A.S. and K.A.J.), R01 AG046396 (to K.A.J.), P41 EB022544 (to G.E.F.), R01 AG049607 (to S.S.), R01 AG062559 (to H.I.L.J.), HHSN268201500001I and 75N92019D00031 (to S.S.), R01 AG061206 (to T.G.I.), DP5OD019833 and R01 AG054671 (to Y.T.Q), R01 AG050436, R01 DK112700, and R01 AG052414 (to J.C.P.).
Footnotes
Supplementary Materials
Fig. S1. Examples of collateral sulcus variations.
Fig. S2. Comparison of rhinal, FreeSurfer entorhinal, and non-overlapping region.
Fig. S3. Centiloid approximation method.
Fig. S4. Assessment of >2 modes in Gaussian mixture models.
Fig. S5. Atypical TAU PET cases.
Fig. S6. TAU PET classification by APOE genotype.
Fig. S7. TAU PET SUVr by APOE genotype.
Fig. S8. Adjusted surface maps of mean TAU PET change by Aβ subgroup.
Fig. S9. Effect of reference region, partial volume correction on TAU PET results.
Table S1. Demographics of low- versus high-RC TAU within low-Aβ CN.
Table S2. Logistic regressions predicting binary RC TAU in low-Aβ CN.
Table S3. Descriptive and Gaussian mixture model statistics for TAU PET by region, subgroup.
Table S4. Effects of age, Aβ on ROI TAU in each subgroup.
Table S5. Effects of age, Aβ, APOEe4 on ROI TAU in each subgroup.
Table S6. Hierarchical models predicting RC TAU.
Table S7. Hierarchical models predicting IT TAU.
Table S8. Effects of age, Aβ, APOEe4 on ROI TAU change rate in each subgroup.
Table S9. Hierarchical models predicting RC TAU change rate.
Table S10. Hierarchical models predicting IT TAU change rate.
Table S11. Self-identified race and ethnicity of participants.
Competing interests: B.J.H. has consulted for GE Healthcare. C.D. is a consultant to Novartis on a safety trial of heart failure. T.G.I. participated as a speaker in an Eli Lilly and Company sponsored educational symposium and serves in an Eli Lilly Data Monitoring Committee. D.M.R. has consulted for Biogen and Digital Cognition Technologies and serves on the scientific advisory board of Neurotrack. R.A.S. has served as a consultant for AC Immune, Biogen, Janssen, Neurocentria, Roche, and Prothena. S.S. has consulted for Biogen. K.A.J. has consulted for Novartis, Eli Lilly, AC Immune, Biogen, Janssen, Takeda, and Roche. All other authors (J.S.S., J.A.B., H.I.L.J., S.J., A.P.S., M.J.P., S.R.K., A.B., C.S., A.O., R.K., G.E.F., M.D.N., Y.T.Q., J.C.P., and J.A.) have no disclosures.
Data and materials availability: All data associated with this study are in the paper or supplementary materials. The Harvard Aging Brain Study project is committed to publicly releasing its data. Baseline data is already available online at http://nmr.mgh.harvard.edu/lab/harvardagingbrain/data. Follow-up data of the Harvard Aging Brain Study data, including the data used this manuscript, is currently available by request, pending approval of a data request and agreement to abide by the Harvard Aging Brain Study online data use agreement. Framingham Heart Study (FHS) data used in this manuscript is available upon reasonable request through the FHS research portal or by emailing the PI of the Framingham Heart Study Neurology, Neurogenetics and Neuroimaging teams, Dr. Sudha Seshadri at suseshad@bu.edu. For requests to transfer FHS data to outside investigators a modest data access fee to cover part of the costs of dataset creation and deidentification, and a certificate of local IRB approval for the proposed research will be required by the NHLBI. Data from the COLBOS study is available on request from Dr. Quiroz; this data is not publicly available because it contains information that could compromise research participant privacy and anonymity.
References and Notes:
- 1.Braak H, Thal DR, Ghebremedhin E, Del Tredici K, Stages of the pathologic process in Alzheimer disease: age categories from 1 to 100 years. J Neuropathol Exp Neurol 70, 960–969 (2011). [DOI] [PubMed] [Google Scholar]
- 2.Nelson PT, Alafuzoff I, Bigio EH, Bouras C, Braak H, Cairns NJ, Castellani RJ, Crain BJ, Davies P, Del Tredici K, Duyckaerts C, Frosch MP, Haroutunian V, Hof PR, Hulette CM, Hyman BT, Iwatsubo T, Jellinger KA, Jicha GA, Kovari E, Kukull WA, Leverenz JB, Love S, Mackenzie IR, Mann DM, Masliah E, McKee AC, Montine TJ, Morris JC, Schneider JA, Sonnen JA, Thal DR, Trojanowski JQ, Troncoso JC, Wisniewski T, Woltjer RL, Beach TG, Correlation of Alzheimer disease neuropathologic changes with cognitive status: a review of the literature. J Neuropathol Exp Neurol 71, 362–381 (2012). [DOI] [PMC free article] [PubMed] [Google Scholar]
- 3.Hyman BT, Phelps CH, Beach TG, Bigio EH, Cairns NJ, Carrillo MC, Dickson DW, Duyckaerts C, Frosch MP, Masliah E, Mirra SS, Nelson PT, Schneider JA, Thal DR, Thies B, Trojanowski JQ, Vinters HV, Montine TJ, National Institute on Aging–Alzheimer’s Association guidelines for the neuropathologic assessment of Alzheimer’s disease. Alzheimer’s & Dementia 8, 1–13 (2012). [DOI] [PMC free article] [PubMed] [Google Scholar]
- 4.Serrano-Pozo A, Qian J, Monsell SE, Frosch MP, Betensky RA, Hyman BT, Examination of the clinicopathologic continuum of Alzheimer disease in the autopsy cohort of the National Alzheimer Coordinating Center. J Neuropathol Exp Neurol 72, 1182–1192 (2013). [DOI] [PMC free article] [PubMed] [Google Scholar]
- 5.Braak H, Del Tredici K, The preclinical phase of the pathological process underlying sporadic Alzheimer’s disease. Brain 138, 2814–2833 (2015). [DOI] [PubMed] [Google Scholar]
- 6.Arnold SE, Hyman BT, Flory J, Damasio AR, Van Hoesen GW, The topographical and neuroanatomical distribution of neurofibrillary tangles and neuritic plaques in the cerebral cortex of patients with Alzheimer’s disease. Cereb Cortex 1, 103–116 (1991). [DOI] [PubMed] [Google Scholar]
- 7.Hardy JA, Higgins GA, Alzheimer’s disease: the amyloid cascade hypothesis. Science 256, 184–185 (1992). [DOI] [PubMed] [Google Scholar]
- 8.Gomez-Isla T, Hollister R, West H, Mui S, Growdon JH, Petersen RC, Parisi JE, Hyman BT, Neuronal loss correlates with but exceeds neurofibrillary tangles in Alzheimer’s disease. Ann Neurol 41, 17–24 (1997). [DOI] [PubMed] [Google Scholar]
- 9.Bennett R, DeVos SL, Dujardins S, Corjuc B, Gor R, Gonzalez J, Roe AD, Frosch MP, Pitstick R, Carlson GA, Hyman BT, Enhanced TAU aggregation in the presence of Amyloid beta. Am J Pathol 187, (2017). [DOI] [PMC free article] [PubMed] [Google Scholar]
- 10.Walker LC, Diamond MI, Duff KE, Hyman BT, Mechanisms of Protein Seeding in Neurodegenerative Diseases. JAMA Neurology 70, 304 (2013). [DOI] [PMC free article] [PubMed] [Google Scholar]
- 11.Qian J, Hyman BT, Betensky RA, Neurofibrillary Tangle Stage and the Rate of Progression of Alzheimer Symptoms: Modeling Using an Autopsy Cohort and Application to Clinical Trial Design. JAMA Neurol, (2017). [DOI] [PMC free article] [PubMed] [Google Scholar]
- 12.Johnson KA, Schultz A, Betensky RA, Becker JA, Sepulcre J, Rentz D, Mormino E, Chhatwal J, Amariglio R, Papp K, Marshall G, Albers M, Mauro S, Pepin L, Alverio J, Judge K, Philiossaint M, Shoup T, Yokell D, Dickerson B, Gomez-Isla T, Hyman B, Vasdev N, Sperling R, TAU positron emission tomographic imaging in aging and early Alzheimer disease: TAU PET in Aging and Early AD. Ann Neurol. 79, 110–119 (2016). [DOI] [PMC free article] [PubMed] [Google Scholar]
- 13.Schöll M, Lockhart SN, Schonhaut DR, O’Neil JP, Janabi M, Ossenkoppele R, Baker SL, Vogel JW, Faria J, Schwimmer HD, Rabinovici GD, Jagust WJ, PET Imaging of TAU Deposition in the Aging Human Brain. Neuron 89, 971–982 (2016). [DOI] [PMC free article] [PubMed] [Google Scholar]
- 14.Wang L, Benzinger TL, Su Y, Christensen J, Friedrichsen K, Aldea P, McConathy J, Cairns NJ, Fagan AM, Morris JC, Ances BM, Evaluation of TAU Imaging in Staging Alzheimer Disease and Revealing Interactions Between β-Amyloid and Tauopathy. JAMA Neurology 73, 1070 (2016). [DOI] [PMC free article] [PubMed] [Google Scholar]
- 15.Villemagne VL, Fodero-Tavoletti MT, Masters CL, Rowe CC, TAU imaging: early progress and future directions. Lancet Neurol 14, 114–124 (2015). [DOI] [PubMed] [Google Scholar]
- 16.Pontecorvo MJ, Devous MD, Kennedy I, Navitsky M, Lu M, Galante N, Salloway S, Doraiswamy PM, Southekal S, Arora AK, McGeehan A, Lim NC, Xiong H, Truocchio SP, Joshi AD, Shcherbinin S, Teske B, Fleisher AS, Mintun MA, A multicentre longitudinal study of flortaucipir (18F) in normal ageing, mild cognitive impairment and Alzheimer’s disease dementia. Brain, (2019). [DOI] [PMC free article] [PubMed] [Google Scholar]
- 17.Sepulcre J, Grothe MJ, d’Oleire Uquillas F, Ortiz-Terán L, Diez I, Yang H-S, Jacobs HIL, Hanseeuw BJ, Li Q, El-Fakhri G, Sperling RA, Johnson KA, Neurogenetic contributions to amyloid beta and TAU spreading in the human cortex. Nat Med 24, 1910–1918 (2018). [DOI] [PMC free article] [PubMed] [Google Scholar]
- 18.Harrison TM, La Joie R, Maass A, Baker SL, Swinnerton K, Fenton L, Mellinger TJ, Edwards L, Pham J, Miller BL, Rabinovici GD, Jagust WJ, Longitudinal TAU accumulation and atrophy in aging and alzheimer disease. Ann Neurol 85, 229–240 (2019). [DOI] [PMC free article] [PubMed] [Google Scholar]
- 19.Jack CR Jr., Wiste HJ, Schwarz CG, Lowe VJ, Senjem ML, Vemuri P, Weigand SD, Therneau TM, Knopman DS, Gunter JL, Jones DT, Graff-Radford J, Kantarci K, Roberts RO, Mielke MM, Machulda MM, Petersen RC, Longitudinal TAU PET in ageing and Alzheimer’s disease. Brain 141, 1517–1528 (2018). [DOI] [PMC free article] [PubMed] [Google Scholar]
- 20.Jacobs HIL, Hedden T, Schultz AP, Sepulcre J, Perea RD, Amariglio RE, Papp KV, Rentz DM, Sperling RA, Johnson KA, Structural tract alterations predict downstream TAU accumulation in amyloid-positive older individuals. Nat Neurosci 21, 424–431 (2018). [DOI] [PMC free article] [PubMed] [Google Scholar]
- 21.Hanseeuw BJ, Betensky RA, Jacobs HIL, Schultz AP, Sepulcre J, Becker JA, Cosio DMO, Farrell M, Quiroz YT, Mormino EC, Buckley RF, Papp KV, Amariglio RA, Dewachter I, Ivanoiu A, Huijbers W, Hedden T, Marshall GA, Chhatwal JP, Rentz DM, Sperling RA, Johnson K, Association of Amyloid and TAU With Cognition in Preclinical Alzheimer Disease: A Longitudinal Study. JAMA Neurol, (2019). [DOI] [PMC free article] [PubMed] [Google Scholar]
- 22.Cho H, Choi JY, Lee HS, Lee J-H, Ryu YH, Lee MS, Jack CR, Lyoo CH, Progressive TAU accumulation in Alzheimer’s disease: two-year follow-up study. Journal of Nuclear Medicine, jnumed.118.221697 (2019). [DOI] [PMC free article] [PubMed] [Google Scholar]
- 23.Augustinack JC, Huber KE, Postelnicu GM, Kakunoori S, Wang R, van der Kouwe AJ, Wald LL, Stein TD, Frosch MP, Fischl B, Entorhinal verrucae geometry is coincident and correlates with Alzheimer’s lesions: a combined neuropathology and high-resolution ex vivo MRI analysis. Acta Neuropathol 123, 85–96 (2012). [DOI] [PMC free article] [PubMed] [Google Scholar]
- 24.Fischl B, Salat DH, van der Kouwe AJW, Makris N, Ségonne F, Quinn BT, Dale AM, Sequence-independent segmentation of magnetic resonance images. NeuroImage 23, S69–S84 (2004). [DOI] [PubMed] [Google Scholar]
- 25.Augustinack JC, Huber KE, Stevens AA, Roy M, Frosch MP, van der Kouwe AJ, Wald LL, Van Leemput K, McKee AC, Fischl B, Alzheimer’s Disease Neuroimaging I, Predicting the location of human perirhinal cortex, Brodmann’s area 35, from MRI. Neuroimage 64, 32–42 (2013). [DOI] [PMC free article] [PubMed] [Google Scholar]
- 26.Klunk WE, Koeppe RA, Price JC, Benzinger TL, Devous MD Sr., Jagust WJ, Johnson KA, Mathis CA, Minhas D, Pontecorvo MJ, Rowe CC, Skovronsky DM, Mintun MA, The Centiloid Project: standardizing quantitative amyloid plaque estimation by PET. Alzheimer’s & Dementia 11, 1–15 e11–14 (2015). [DOI] [PMC free article] [PubMed] [Google Scholar]
- 27.Braak H, Alafuzoff I, Arzberger T, Kretzschmar H, Del Tredici K, Staging of Alzheimer disease-associated neurofibrillary pathology using paraffin sections and immunocytochemistry. Acta Neuropathol 112, 389–404 (2006). [DOI] [PMC free article] [PubMed] [Google Scholar]
- 28.Ding SL, Van Hoesen GW, Borders, extent, and topography of human perirhinal cortex as revealed using multiple modern neuroanatomical and pathological markers. Hum Brain Mapp 31, 1359–1379 (2010). [DOI] [PMC free article] [PubMed] [Google Scholar]
- 29.Ossenkoppele R, Schonhaut DR, Schöll M, Lockhart SN, Ayakta N, Baker SL, O’Neil JP, Janabi M, Lazaris A, Cantwell A, Vogel J, Santos M, Miller ZA, Bettcher BM, Vossel KA, Kramer JH, Gorno-Tempini ML, Miller BL, Jagust WJ, Rabinovici GD, TAU PET patterns mirror clinical and neuroanatomical variability in Alzheimer’s disease. Brain 139, 1551–1567 (2016). [DOI] [PMC free article] [PubMed] [Google Scholar]
- 30.Whitwell JL, Graff-Radford J, Tosakulwong N, Weigand SD, Machulda M, Senjem ML, Schwarz CG, Spychalla AJ, Jones DT, Drubach DA, Knopman DS, Boeve BF, Ertekin-Taner N, Petersen RC, Lowe VJ, Jack CR Jr., Josephs KA, [(18) F]AV-1451 clustering of entorhinal and cortical uptake in Alzheimer’s disease. Ann Neurol 83, 248–257 (2018). [DOI] [PMC free article] [PubMed] [Google Scholar]
- 31.Sintini I, Martin PR, Graff-Radford J, Senjem ML, Schwarz CG, Machulda MM, Spychalla AJ, Drubach DA, Knopman DS, Petersen RC, Lowe VJ, Jack CR Jr., Josephs KA, Whitwell JL, Longitudinal TAU-PET uptake and atrophy in atypical Alzheimer’s disease. Neuroimage Clin 23, 101823 (2019). [DOI] [PMC free article] [PubMed] [Google Scholar]
- 32.Shi Y, Yamada K, Liddelow SA, Smith ST, Zhao L, Luo W, Tsai RM, Spina S, Grinberg LT, Rojas JC, Gallardo G, Wang K, Roh J, Robinson G, Finn MB, Jiang H, Sullivan PM, Baufeld C, Wood MW, Sutphen C, McCue L, Xiong C, Del-Aguila JL, Morris JC, Cruchaga C, Alzheimer’s Disease Neuroimaging I, Fagan AM, Miller BL, Boxer AL, Seeley WW, Butovsky O, Barres BA, Paul SM, Holtzman DM, ApoE4 markedly exacerbates TAU-mediated neurodegeneration in a mouse model of tauopathy. Nature 549, 523–527 (2017). [DOI] [PMC free article] [PubMed] [Google Scholar]
- 33.Yu L, Boyle PA, Leurgans S, Schneider JA, Bennett DA, Disentangling the effects of age and APOE on neuropathology and late life cognitive decline. Neurobiology of Aging 35, 819–826 (2014). [DOI] [PMC free article] [PubMed] [Google Scholar]
- 34.Ghebremedhin E, Schultz C, Braak E, Braak H, High frequency of apolipoprotein E epsilon4 allele in young individuals with very mild Alzheimer’s disease-related neurofibrillary changes. Exp Neurol 153, 152–155 (1998). [DOI] [PubMed] [Google Scholar]
- 35.Baker SL, Harrison TM, Maass A, La Joie R, Jagust WJ, Explaining [18f]-Av-1451 Variability in Healthy Controls across the Lifespan. Alzheimer’s & Dementia 14, P3–P4 (2018). [Google Scholar]
- 36.Braak H, Del Tredici K, Are cases with TAU pathology occurring in the absence of Abeta deposits part of the AD-related pathological process? Acta Neuropathol 128, 767–772 (2014). [DOI] [PubMed] [Google Scholar]
- 37.Crary JF, Trojanowski JQ, Schneider JA, Abisambra JF, Abner EL, Alafuzoff I, Arnold SE, Attems J, Beach TG, Bigio EH, Cairns NJ, Dickson DW, Gearing M, Grinberg LT, Hof PR, Hyman BT, Jellinger K, Jicha GA, Kovács GG, Knopman DS, Kofler J, Kukull WA, Mackenzie IR, Masliah E, McKee A, Montine TJ, Murray ME, Neltner JH, Santa-Maria I, Seeley WW, Serrano-Pozo A, Shelanski ML, Stein T, Takao M, Thal DR, Toledo JB, Troncoso JC, Vonsattel JP, White CL, Wisniewski T, Woltjer RL, Yamada M, Nelson PT, Primary age-related tauopathy (PART): a common pathology associated with human aging. Acta Neuropathologica 128, 755–766 (2014). [DOI] [PMC free article] [PubMed] [Google Scholar]
- 38.Duyckaerts C, Braak H, Brion JP, Buee L, Del Tredici K, Goedert M, Halliday G, Neumann M, Spillantini MG, Tolnay M, Uchihara T, PART is part of Alzheimer disease. Acta Neuropathol 129, 749–756 (2015). [DOI] [PMC free article] [PubMed] [Google Scholar]
- 39.Maass A, Lockhart SN, Harrison TM, Bell RK, Mellinger T, Swinnerton K, Baker SL, Rabinovici GD, Jagust WJ, Entorhinal TAU Pathology, Episodic Memory Decline, and Neurodegeneration in Aging. J Neurosci 38, 530–543 (2018). [DOI] [PMC free article] [PubMed] [Google Scholar]
- 40.Lowe VJ, Bruinsma TJ, Wiste HJ, Min HK, Weigand SD, Fang P, Senjem ML, Therneau TM, Boeve BF, Josephs KA, Pandey MK, Murray ME, Kantarci K, Jones DT, Vemuri P, Graff-Radford J, Schwarz CG, Machulda MM, Mielke MM, Roberts RO, Knopman DS, Petersen RC, Jack CR Jr., Cross-sectional associations of TAU-PET signal with cognition in cognitively unimpaired adults. Neurology 93, e29–e39 (2019). [DOI] [PMC free article] [PubMed] [Google Scholar]
- 41.Castillo-Carranza DL, Guerrero-Munoz MJ, Sengupta U, Hernandez C, Barrett AD, Dineley K, Kayed R, TAU immunotherapy modulates both pathological TAU and upstream amyloid pathology in an Alzheimer’s disease mouse model. J Neurosci 35, 4857–4868 (2015). [DOI] [PMC free article] [PubMed] [Google Scholar]
- 42.McMillan CT, Lee EB, Jefferson-George K, Naj A, Van Deerlin VM, Trojanowski JQ, Wolk DA, Alzheimer’s genetic risk is reduced in primary age-related tauopathy: a potential model of resistance? Ann Clin Transl Neurol 5, 927–934 (2018). [DOI] [PMC free article] [PubMed] [Google Scholar]
- 43.Jack CR Jr., Wiste HJ, Weigand SD, Therneau TM, Lowe VJ, Knopman DS, Gunter JL, Senjem ML, Jones DT, Kantarci K, Machulda MM, Mielke MM, Roberts RO, Vemuri P, Reyes DA, Petersen RC, Defining imaging biomarker cut points for brain aging and Alzheimer’s disease. Alzheimer’s & Dementia 13, 205–216 (2017). [DOI] [PMC free article] [PubMed] [Google Scholar]
- 44.Betthauser TJ, Koscik RL, Jonaitis EM, Allison SL, Cody KA, Erickson CM, Rowley HA, Stone CK, Mueller KD, Clark LR, Carlsson CM, Chin NA, Asthana S, Christian BT, Johnson SC, Amyloid and TAU imaging biomarkers explain cognitive decline from late middle-age. Brain 143, 320–335 (2020). [DOI] [PMC free article] [PubMed] [Google Scholar]
- 45.Vemuri P, Lowe VJ, Knopman DS, Senjem ML, Kemp BJ, Schwarz CG, Przybelski SA, Machulda MM, Petersen RC, Jack CR Jr., TAU-PET uptake: Regional variation in average SUVR and impact of amyloid deposition. Alzheimers Dement (Amst) 6, 21–30 (2017). [DOI] [PMC free article] [PubMed] [Google Scholar]
- 46.Maass A, Landau S, Baker SL, Horng A, Lockhart SN, La Joie R, Rabinovici GD, Jagust WJ, Alzheimer’s Disease Neuroimaging I, Comparison of multiple TAU-PET measures as biomarkers in aging and Alzheimer’s disease. Neuroimage 157, 448–463 (2017). [DOI] [PMC free article] [PubMed] [Google Scholar]
- 47.Adams JN, Maass A, Harrison TM, Baker SL, Jagust WJ, Cortical TAU deposition follows patterns of entorhinal functional connectivity in aging. eLife 8, e49132 (2019). [DOI] [PMC free article] [PubMed] [Google Scholar]
- 48.Jones DT, Graff-Radford J, Lowe VJ, Wiste HJ, Gunter JL, Senjem ML, Botha H, Kantarci K, Boeve BF, Knopman DS, Petersen RC, Jack CR Jr., TAU, amyloid, and cascading network failure across the Alzheimer’s disease spectrum. Cortex 97, 143–159 (2017). [DOI] [PMC free article] [PubMed] [Google Scholar]
- 49.Smith R, Wibom M, Pawlik D, Englund E, Hansson O, Correlation of In Vivo [18F]Flortaucipir With Postmortem Alzheimer Disease TAU Pathology. JAMA Neurol, (2018). [DOI] [PMC free article] [PubMed] [Google Scholar]
- 50.Marquié M, Normandin MD, Vanderburg CR, Costantino IM, Bien EA, Rycyna LG, Klunk WE, Mathis CA, Ikonomovic MD, Debnath ML, Vasdev N, Dickerson BC, Gomperts SN, Growdon JH, Johnson KA, Frosch MP, Hyman BT, Gómez-Isla T, Validating novel TAU positron emission tomography tracer [F-18]-AV-1451 (T807) on postmortem brain tissue. Ann Neurol. 78, 787–800 (2015). [DOI] [PMC free article] [PubMed] [Google Scholar]
- 51.Braak H, Del Tredici K, Spreading of TAU Pathology in Sporadic Alzheimer’s Disease Along Corticocortical Top-Down Connections. Cereb Cortex 28, 3372–3384 (2018). [DOI] [PMC free article] [PubMed] [Google Scholar]
- 52.Xie L, Wisse LEM, Pluta J, de Flores R, Piskin V, Manjon JV, Wang H, Das SR, Ding SL, Wolk DA, Yushkevich PA, Alzheimer’s Disease Neuroimaging I, Automated segmentation of medial temporal lobe subregions on in vivo T1-weighted MRI in early stages of Alzheimer’s disease. Hum Brain Mapp, (2019). [DOI] [PMC free article] [PubMed] [Google Scholar]
- 53.Tsao C, Vasan R, Cohort profile: The Framingham Heart Study (FHS): overview of milestones in cardiovascular epidemiology. Int J Epidemiol 44, 1800–1813 (2015). [DOI] [PMC free article] [PubMed] [Google Scholar]
- 54.Quiroz YT, Sperling RA, Norton DJ, Baena A, Arboleda-Velasquez JF, Cosio D, Schultz A, Lapoint M, Guzman-Velez E, Miller JB, Kim LA, Chen K, Tariot PN, Lopera F, Reiman EM, Johnson KA, Association Between Amyloid and TAU Accumulation in Young Adults With Autosomal Dominant Alzheimer Disease. JAMA Neurol 75, 548–556 (2018). [DOI] [PMC free article] [PubMed] [Google Scholar]
- 55.Albert MS, DeKosky ST, Dickson D, Dubois B, Feldman HH, Fox NC, Gamst A, Holtzman DM, Jagust WJ, Petersen RC, Snyder PJ, Carrillo MC, Thies B, Phelps CH, The diagnosis of mild cognitive impairment due to Alzheimer’s disease: Recommendations from the National Institute on Aging-Alzheimer’s Association workgroups on diagnostic guidelines for Alzheimer’s disease. Alzheimer’s & dementia : the journal of the Alzheimer’s Association 7, 270–279 (2011). [DOI] [PMC free article] [PubMed] [Google Scholar]
- 56.Greve DN, Svarer C, Fisher PM, Feng L, Hansen AE, Baare W, Rosen B, Fischl B, Knudsen GM, Cortical surface-based analysis reduces bias and variance in kinetic modeling of brain PET data. NeuroImage 92, 225–236 (2014). [DOI] [PMC free article] [PubMed] [Google Scholar]
- 57.Desikan RS, Segonne F, Fischl B, Quinn BT, Dickerson BC, Blacker D, Buckner RL, Dale AM, Maguire RP, Hyman BT, Albert MS, Killiany RJ, An automated labeling system for subdividing the human cerebral cortex on MRI scans into gyral based regions of interest. Neuroimage 31, 968–980 (2006). [DOI] [PubMed] [Google Scholar]
- 58.Fischl B, Dale AM, Measuring the thickness of the human cerebral cortex from magnetic resonance images. Proc Natl Acad Sci U S A 97, 11050–11055 (2000). [DOI] [PMC free article] [PubMed] [Google Scholar]
- 59.Greve DN, Salat DH, Bowen SL, Izquierdo-Garcia D, Schultz AP, Catana C, Becker JA, Svarer C, Knudsen GM, Sperling RA, Johnson KA, Different partial volume correction methods lead to different conclusions: An (18)F-FDG-PET study of aging. Neuroimage 132, 334–343 (2016). [DOI] [PMC free article] [PubMed] [Google Scholar]
- 60.Hanseeuw BJ, Betensky RA, Mormino EC, Schultz AP, Sepulcre J, Becker JA, Jacobs HIL, Buckley RF, LaPoint MR, Vannini P, Donovan NJ, Chhatwal JP, Marshall GA, Papp KV, Amariglio RE, Rentz DM, Sperling RA, Johnson KA, Alzheimer’s Disease Neuroimaging I, Harvard Aging Brain S, PET staging of amyloidosis using striatum. Alzheimer’s & Dementia 14, 1281–1292 (2018). [DOI] [PMC free article] [PubMed] [Google Scholar]
- 61.Lee CM, Jacobs HIL, Marquié M, Becker JA, Andrea NV, Jin DS, Schultz AP, Frosch MP, Gómez-Isla T, Sperling RA, Johnson KA, 18F-Flortaucipir Binding in Choroid Plexus: Related to Race and Hippocampus Signal. Journal of Alzheimer’s Disease 62, 1691–1702 (2018). [DOI] [PMC free article] [PubMed] [Google Scholar]
- 62.Lemoine L, Leuzy A, Chiotis K, Rodriguez-Vieitez E, Nordberg A, TAU positron emission tomography imaging in tauopathies: The added hurdle of off-target binding. Alzheimers Dement (Amst) 10, 232–236 (2018). [DOI] [PMC free article] [PubMed] [Google Scholar]
- 63.Fischl B, Sereno MI, Dale AM, Cortical Surface-Based Analysis: II: Inflation, Flattening, and a Surface-Based Coordinate System. NeuroImage 9, 195–207 (1999). [DOI] [PubMed] [Google Scholar]
- 64.Klein A, Ghosh SS, Bao FS, Giard J, Hame Y, Stavsky E, Lee N, Rossa B, Reuter M, Chaibub Neto E, Keshavan A, Mindboggling morphometry of human brains. PLoS Comput Biol 13, e1005350 (2017). [DOI] [PMC free article] [PubMed] [Google Scholar]
- 65.Huntgeburth SC, Petrides M, Morphological patterns of the collateral sulcus in the human brain. European Journal of Neuroscience 35, 1295–1311 (2012). [DOI] [PubMed] [Google Scholar]
- 66.Fraley C, Murphy TB, Scrucca L, mclust Version 4 for R: Normal Mixture Modeling for Model-Based Clustering, Classification, and Density Estimation. (2013).
- 67.Hagler DJ Jr., Saygin AP, Sereno MI, Smoothing and cluster thresholding for cortical surface-based group analysis of fMRI data. Neuroimage 33, 1093–1103 (2006). [DOI] [PMC free article] [PubMed] [Google Scholar]
Associated Data
This section collects any data citations, data availability statements, or supplementary materials included in this article.