

Abstract
Background
While effective treatments for posttraumatic stress disorder (PTSD) exist, many individuals, including military personnel and veterans fail to respond to them. Equine‐assisted therapy (EAT), a novel PTSD treatment, may complement existing PTSD interventions. This study employs longitudinal neuro‐imaging, including structural magnetic resonance imaging (sMRI), resting state‐fMRI (rs‐fMRI), and diffusion tensor imaging (DTI), to determine mechanisms and predictors of EAT outcomes for PTSD.
Method
Nineteen veterans with PTSD completed eight weekly group sessions of EAT undergoing multimodal MRI assessments before and after treatment. Clinical assessments were conducted at baseline, post‐treatment and at 3‐month follow‐up.
Results
At post‐treatment patients showed a significant increase in caudate functional connectivity (FC) and reduction in the gray matter density of the thalamus and the caudate. The increase of caudate FC was positively associated with clinical improvement seen immediately at post‐treatment and at 3‐month follow‐up. In addition, higher baseline caudate FC was associated with greater PTSD symptom reduction post‐treatment.
Conclusions
This exploratory study is the first to demonstrate that EAT can affect functional and structural changes in the brains of patients with PTSD. The findings suggest that EAT may target reward circuitry responsiveness and produce a caudate pruning effect from pre‐ to post‐treatment.
Keywords: equine assisted therapy, neuroimaging, PTSD, resting state fMRI
This study employs longitudinal neuro‐imaging, including structural magnetic resonance imaging (sMRI), resting state‐fMRI (rs‐fMRI), and diffusion tensor imaging (DTI), to determine mechanisms and predictors of EAT outcomes for PTSD.

1. INTRODUCTION
Posttraumatic stress disorder (PTSD) is a debilitating mental health disorder that occurs in the aftermath of trauma exposure. The prevalence of PTSD in the general population of the United States is estimated at nearly 9% (American Psychiatric Association, 2013), but ranges from 10 to 30% for US veterans (Kang, Natelson, Mahan, Lee, & Murphy, 2003). Active‐duty military personnel and veterans suffering with PTSD are often reluctant to enroll or simply fail to respond to currently available psychotherapies (Holder, Holliday, Wiblin, LePage, & Suris, 2019; Lewis, Roberts, Gibson, & Bisson, 2020) and pharmacotherapies (Sullivan & Neria, 2009). One novel alternative and complementary treatment for PTSD is equine‐assisted therapy (EAT) (Bachi, Terkel, & Teichman, 2012; Selby & Smith‐Osborne, 2013). Specifically, EAT uses a horse (or horses) to facilitate communication and mindful awareness of thought and behaviors in an experientially oriented approach (Anestis, Anestis, Zawilinski, Hopkins, & Lilienfeld, 2014). A psychotherapist, assisted by an equine specialist, helps a patient understand and negotiate interactions with a horse, which should help foster regulation, reflection, and verbal and nonverbal communication (Selby & Smith‐Osborne, 2013). We have recently developed and manualized EAT for PTSD and tested it in a pilot trial (Arnon et al., 2020) and in a large open trial (Fisher et al., 2021, under review) for military veterans with PTSD. Eight weekly sessions yielded reduction in PTSD and depressive symptoms, high acceptability (very few drop‐outs), and tolerability. As part of the open trial, we conducted an exploratory neuroimaging study on a subset of participants. We aimed to examine whether observable neural changes can a) explain the mechanisms whereby EAT might ameliorate PTSD and b) predict those individuals most likely to successfully respond to this therapeutic intervention.
Assessment of neural mechanisms related to treatment response has increased in psychotherapy research (Nisar et al., 2020; Zhu et al., 2018). In PTSD, magnetic resonance imaging (MRI) has been also used to assess PTSD treatment‐related changes, including structural alteration (Helpman et al., 2016), task‐based functional activity (Fonzo et al., 2017a; Helpman et al., 2016), and resting‐state functional connectivity (rsFC) (Zhu et al., 2018). Studies have explored these brain changes following prolonged exposure (PE), first line treatment for PTSD (Fonzo et al., 2017b; Helpman, Papini, et al., 2016; Suarez‐Jimenez et al., 2020; Zhu et al., 2018), affect‐focused interpersonal psychotherapy (IPT) (Suarez‐Jimenez et al., 2020), eye movement desensitization and reprocessing (EMDR) (Laugharne et al., 2016), cognitive behavioral therapy (CBT) (Levy‐Gigi, Szabo, Kelemen, & Keri, 2013), brief eclectic psychotherapy (BEP) (Lindauer et al., 2005), and trauma‐focused therapy (van Rooij et al., 2015). The findings suggest that different PTSD treatments may target distinct mechanisms of action. To our knowledge, no study has utilized different neuroimaging modalities to investigate the CNS mechanisms by which EAT may affect the severity of PTSD.
The present study employs standardized longitudinal multimodal MRI, including structural MRI (sMRI), resting state‐fMRI (rs‐fMRI), and diffusion tensor imaging (DTI). Our first aim was to explore pre‐ to post‐treatment changes in: a) rsFC in reward, executive control, default mode, and salience networks; b) regional grey matter volume (GMV), measured by sMRI; and c) fractional anisotropy (FA) measured by DTI. The second aim was to clarify the association between changes of multimodal imaging biomarkers (sMRI, rsfMRI, DTI) and clinical response at post‐treatment and at three‐month follow‐up (FU); and to examine whether these biomarkers might serve as baseline predictors of clinical improvement.
2. METHODS
2.1. Participants
The study sample comprised 20 treatment‐seeking veterans with PTSD, a subset of participants taking part of a larger open trial (n = 63) of EAT for veterans with PTSD (Fisher, Lazarov et al. under review). Additional funding support allowed us to introduce MRI scans later in this larger open trial after 47.6% of participants (n = 30) had completed the treatment protocol. Due to the scheduling issues and MRI scanning requirements (e.g., no metal, tolerance of MRI procedure) 20 participants were recruited for the MRI portion of the study of which 19 underwent clinical evaluation at baseline, post treatment and three‐month follow‐up, and completed MRI assessment at baseline and post‐treatment. One patient discontinued treatment prematurely. Table 1 illustrates the demographic information and the clinical outcomes of 19 treatment completers (mean age = 46.64, std = 12.34; 53% female), respectively. The New York State Psychiatric Institute Institutional Review Board approved the study. Participants provided written informed consent. ClinicalTrials.gov identifier: NCT03068325.
TABLE 1.
Sample demographic and clinical characteristics
| Variable | n | % |
|---|---|---|
| Gender, n (%) | ||
| Female | 10 | 53 |
| Male | 9 | 47 |
| Ethnicity | ||
| Hispanic, n (%) | 3 | 16 |
| Non‐Hispanic | 15 | 79 |
| Prefer not to answer | 1 | 5 |
| Race, n (%) | ||
| White | 6 | 32 |
| Black | 7 | 37 |
| Other | 5 | 26 |
| Prefer not to answer | 1 | 5 |
| Employment, n (%) | ||
| Working full‐time | 1 | 5 |
| Unemployed | 4 | 21 |
| Retired | 2 | 11 |
| Disabled | 9 | 47 |
| Student | 3 | 16 |
| Income, n (%) | ||
| <30 K | 12 | 64 |
| 30–40 K | 3 | 16 |
| >80 K | 4 | 22 |
| Medications, n (%) | ||
| Yes | 11 | 58 |
| No | 8 | 42 |
| Psychotherapy, n (%) | ||
| Yes | 11 | 58 |
| No | 8 | 42 |
| Any treatment, n (%) | ||
| Yes | 14 | 74 |
| No | 5 | 26 |
| Co‐morbid diagnoses | ||
| Major depressive disorder | 10 | 53 |
| Persistent depressive disorder | 4 | 21 |
| Other depressive disorder | 1 | 5 |
| Alcohol use disorder | 3 | 16 |
2.2. Procedure
Participants were recruited through clinical referrals and print and online advertisements. After a telephone screen to determine probable eligibility, using the PTSD Checklist DSM‐5 (PCL‐5; Blevins, Weathers, Davis, Witte, & Domino, 2015), potential participants underwent clinical assessment by a master's or PhD‐level clinician trained to ≥85% reliability with a senior clinician on all interview‐based measures. Psychiatric diagnoses were ascertained using the Structured Clinical Interview for DSM‐5 (SCID‐5; First, Williams, Karg, & Spitzer, 2015). Additional inclusion criteria were age 18–70, reported military experience, and English fluency. Exclusion criteria were: history of psychotic disorder or unstable bipolar disorder, determined by SCID‐5 (First et al., 2015); 17‐item Hamilton Rating Scale for Depression (HAM‐D; Hamilton, 1960) score>25; elevated suicide risk, determined by clinical interview; severe substance or alcohol use disorder within the past six months, or moderate use disorder within the past two months; and physical limitations impeding participation. Concurrent ongoing mental health treatment, including medication, was allowed. Initiating concurrent psychotherapy or pharmacotherapy during the course of EAT was also deemed exclusionary. For the imaging protocol, additional exclusion criteria were having metal in the body, unable to tolerate the scanning procedures, severe medical disorder, or significant claustrophobia.
2.3. Treatment
EAT for PTSD comprised eight weekly 90‐minute group sessions held at an equestrian center. Each group was led by a licensed mental health professional, an equine specialist, and an extra horse wrangler to enhance safety. All sessions began with a grounding exercise, focusing attention on current physical sensations. The first session has oriented patients to EAT (rationale, description, possible benefits), provided safety guidelines, psychoeducation (common reactions to trauma, development and maintenance of PTSD), and a barn tour, and ended with meeting two horses in a round‐pen. Subsequent sessions were built upon previous ones, by reviewing previous session content and introducing increasingly complex encounters and interactions with horses, coupled with team feedback and direction. Each session ended with an opportunity for participants to review and discuss their experiences. The final session included a graduation ceremony celebrating patients’ treatment progress and accomplishments (see Arnon et al., 2020; Fisher et al., under review).
2.4. Clinical measures
Clinical interviewers assessed PTSD and depression symptoms at pre‐, post‐treatment, and 3‐month follow‐up. The CAPS‐5 was the primary outcome assessment of DSM‐5 PTSD criteria. The 17‐item HAM‐D (Hamilton, 1960) assessed depressive symptoms. We also administered two self‐report measures, the PCL‐5 (Blevins et al., 2015) for PTSD symptom severity and Beck Depression Inventory‐II (BDI‐II) for depressive symptoms (Beck, Steer, Ball, & Ranieri, 1996). These measures have well‐documented psychometrics and validly, reliably assess their respective constructs (Beck et al., 1996; Bovin et al., 2016).
2.5. Image procedures
2.5.1. Image acquisition and analysis
Eleven participants were scanned twice using a 3T General Electric MR750, and nine participants were scanned twice using a 3T Siemens Prisma scanner due to scanner upgrade, equipped with a 32‐channel receive‐only head coil. Each participant was scanned twice with the same scanner. For each participant a high‐resolution T1‐weighted sequence was acquired using the following parameter: T1 = 450 ms (GE) or 900 ms (Siemens), Flip angle = 12° (GE) or 8° (Siemens), 256 × 256 matrix, slice thickness = 1 mm. T2*‐weighted echo‐planar images (EPIs) depicting the blood‐oxygen‐level‐dependent (BOLD) were acquired for each participant with TR = 1.3 s (GE) or 1.5 s (Siemens), TE = 28 ms, FA = 60° (GE) or 75° (Siemens), FOV = 19.2 cm, number of slices = 27, slice thickness = 4 mm. A head cushion limited head motion.
DTI data were obtained in the axial plane using a single‐shot diffusion‐weighted echo planar imaging sequence with the following parameters: TR/TE = 8500/77ms, FOV = 240mm, matrix size = 122×122, slice thickness = 2.5 mm, number of slices = 60, number of diffusion gradient directions = 64, b‐value = 1000 s/mm2, number of images at b‐value of 0 s/mm2 = 5, acceleration factor = 2. The scanner factor was controlled as a covariate of no‐interest in all three modalities analysis.
2.5.2. Resting state fMRI processing
All rsFC images were preprocessed using MATLAB version R2018a (The MathWorks, Inc., Natick, Massachusetts) and statistical parametric mapping software (SPM12; Welcome Trust Centre for Neuroimaging, UCL, London, UK). (a) Functional images were spatially realigned to the first image in the time series using a six‐parameter rigid body transformation; (b) then slice‐time correction was performed; (c) outlier detection was carried out using artifact removal tools (ART). The principal component‐based noise‐correction method, “CompCor,” implemented in this toolbox, was used to additionally control physiological noise and head motion effects. Outlier volumes in each participant were identified as having large spiking artifacts (i.e., volumes >3 standard deviations from the mean image intensity), or large motion (i.e., 0.5 mm for scan‐to‐scan head‐motion composite changes in the x, y, or z direction); (d) each functional image was then spatially normalized to the standard T1 template included in SPM12; Functional images were then resliced to 2 × 2 × 2 mm voxels, according to the resulting spatial realignment and normalization parameters; (e) anatomical images were segmented into grey matter, white matter, and cerebrospinal fluid (CSF) regions; (f) functional scans were smoothed with an 8mm full‐width‐at‐half‐maximum (FWHM) Gaussian kernel; (g) covariates corresponding to head motion (6 realignment parameters and their derivatives), outliers (one covariate per outlier consisting of 0s everywhere and a 1 for the outlier time point), and the BOLD time series from the subject‐specific white matter and CSF masks were used in the GLM and connectivity analysis as predictors of no interest, and were removed from the BOLD functional time series using linear regression. Sum of root mean square (RMS) of 6 relative head motion parameters (movement from this time point to the next one) was calculated for each participant in pre‐ and post‐treatment. No significant difference in head motion was found between pre‐ and post in PTSD (p > .5).
The Independent Component Analysis (ICA) was performed with the CONN‐fMRI FC toolbox v18b in conjunction with SPM12 (Welcome Department of Imaging Neuroscience, London, UK; http://www.fil.ion.ucl.ac.uk/spm/). ICA is a data‐driven method that is based on a blind source separation algorithm. Unlike the seed‐based method, which identifies the correlation between the seed region and other target brain regions, ICA examines multiple simultaneous voxel‐to‐voxel interactions of distinct networks in the brain, and separate independent patterns by maximizing the mutual spatial independence among components (Calhoun, Adali, Pearlson, & Pekar, 2001). The resting state functional connectivity (rsFC) data were submitted to a subject‐wise group ICA implemented in the CONN. A group‐ICA methodology was used (Calhoun et al., 2001), with optional subject‐level dimensionality reduction, concatenation across subjects, group‐level Singular Value Decomposition (SVD) for dimensionality reduction, a fastICA algorithm for group‐level IC, and a GICA3 for subject‐level back‐projection. Group ICA was performed with 20 factors and a dimensionality reduction of 64. To compare these spatial patterns for one particular network of interest for two sessions, masks of each network were generated and only activations within each component network were examined.
To examine changes in brain functional connectivity between the two sessions, a paired sample t test was performed (whole brain FDR correction). The statistical results were used to determine the brain regions showing significant differences in each network.
2.6. T1 image processing
Voxel‐Based Morphometry (VBM) analysis was performed using SPM12 (http://www.fil.ion.ucl.ac.uk/spm) with MATLAB R2018a. Pairwise longitudinal registration was carried out using inverse‐consistent rigid‐body registrations to generate the subject average images. Each individual image was bias‐corrected and then segmented into GM, WM, and cerebrospinal fluid (CSF) using standard Tissue Probability Maps (TPM) in SPM12. Images were normalized to an isotropic voxel size of 1.5 mm. This was followed by partial volume estimation, which provides a more accurate segmentation. Afterwards, tissue segments were spatially normalized to a common reference space using DARTEL for all subjects (Ashburner, 2007). Images were modulated to guarantee that relative GM/WM volumes were preserved following the spatial normalization procedure. Finally, images were smoothed with an 8 mm full width at half maximum isotropic Gaussian kernel. Spatial pre‐processing, smoothed, modulated normalized GM and WM datasets were used to perform statistical analysis. Total gray matter volume (GMV) was estimated for each participant and used as a covariate in the second‐level statistical test.
For statistical analysis of the longitudinal study, paired t tests were conducted. The activated regions of regional GMV were extracted using MarsBar (Matthew, Jean‐Luc, Romain, & Jean‐Baptiste, 2002).
2.7. DTI image processing
All data analyses were performed in Functional MRI of the Brain Software Library (FSL) version 6.0 (Analysis Group, FMRIB, Oxford, UK, http://fsl.fmrib.ox.ac.uk). Diffusion weighted images were corrected for motion using Eddy Correct and non‐brain tissue was removed using Brain Extraction Tool. Brain‐extracted images were then visually inspected to confirm accurate results. Fractional anisotropy (FA) maps, the common DTI measure that describes the degree of anisotropy of a diffusion process, were created using DTIfit and input into Tract‐Based Spatial Statistics (TBSS) to obtain a projection of all participants' FA data onto a mean FA skeleton. All participants' FA data were non‐linearly aligned to a common space (FMRIB58_FA). Then, the mean FA image was created and thresholded (FA > 0.2) to create the mean FA skeleton. Next, each participant's FA data were projected onto the thresholded mean FA skeleton. Voxel‐wise statistical analysis of the white matter skeleton was performed using Randomise, FSL's nonparametric permutation inference tool. A one‐sample, paired t test assessed pre‐ versus post‐treatment differences. Threshold‐free cluster enhancement was used to correct for multiple comparisons (p < .05). TBSS was performed for mean diffusivity (MD), which describes the rotationally invariant magnitude of water diffusion within brain tissue. Non‐linear registration estimated from the FA images was applied to MD data and each participant's MD image was projected onto the mean FA skeleton before applying voxel‐wise statistics. White matter regions were identified with Johns Hopkins University's white matter atlas available in FSL.
2.8. Statistical analysis
To assess whether observed post‐treatment brain changes were associated with the clinical changes, we first carried out correlation analysis between brain changes (rsFC and sMRI) and changes in clinical scores (CAPS‐5, HAM‐D, PCL, and BDI), controlled for scanners. Second, to examine whether these neural markers might serve as baseline predictors of clinical improvement, we carried out correlation analysis to examine whether the baseline brain findings (rsFC and sMRI) predicted changes in clinical scores (CAPS‐5, HAM‐D, PCL, and BDI). Bonferroni correction was used to correct for the four comparisons.
3. RESULTS
3.1. Examining pre‐ to post‐treatment brain changes
3.1.1. Resting state functional connectivity (rsFC) changes
Whole‐brain baseline rsFC revealed six networks of interest using data‐driven group ICA: left and right executive control network (ECN), anterior and posterior default mode network (a‐DMN, p‐DMN), salience network (SN), and the basal ganglia network (BGN) (Figure 1). However, only BGN connectivity showed changes from pre‐ to post‐treatment. Specifically, within‐BGN, one cluster (caudate) showed a significant increase in rsFC after treatment (Figure 2, Table 2). These changes of caudate rsFC were independent of whether subjects were taking medications.
FIGURE 1.

Networks identified by ICA
FIGURE 2.

Within‐BGN showed significant increased connectivity after treatment
TABLE 2.
Resting state functional connectivity (rsFC) changes from pre‐ to post‐treatment
| Regions | p(FWE‐corr) | p(FDR‐corr) | Cluster size | T | Z | x,y,z |
|---|---|---|---|---|---|---|
| Caudate | 0.245 | 0.044 | 37 | 5.33 | 4.03 | [−12 8 16] |
| 4.8 | 3.77 | [−10 6 6] | ||||
| 0.048 | 0.028 | 56 | 5.03 | 3.88 | [4 8 0] | |
| 4.19 | 3.43 | [8 18 2] |
3.1.2. sMRI T1 VBM changes
Whole‐brain sMRI showed reduction of regional GMV in the thalamus and caudate with p < .05 whole brain FWE correction (Table 3). There was no significant difference in regional GMV in the thalamus and caudate cluster between subgroups taking and not taking medication.
TABLE 3.
Whole‐brain sMRI showed reduction of regional GMV
| Regions | p(FWE‐corr) | p(FDR‐corr) | Cluster size | T | Z | x,y,z |
|---|---|---|---|---|---|---|
| Caudate | 0.009 | 0.022 | 959 | 6.58 | 4.64 | [12 −3 18] |
| Thalamus | 4.93 | 3.87 | [6 −10 15] |
3.1.3. DTI TBSS changes
Whole‐brain DTI paired pre/post‐treatment t test yielded no significant clusters in the FA and MD analyses.
3.2. Examining associations between pre‐ to post‐treatment brain changes and clinical change
3.2.1. Clinical changes
Patients had significantly lower scores on the CAPS‐5 (p = .002 post; p = .005 FU), PCL (p < .001 post; p = .008 FU), and BDI (p = .007 post; p < .001 FU) at post treatment and follow‐up compared with baseline (Table S1). There was no significant change on HAM‐D at post treatment and FU compared with baseline (p = .052 post, p = .14 FU).
3.2.2. Neural changes and correlation with clinical outcomes
Post‐treatment: There was a significant positive correlation between increased caudate rsFC and improved PCL scores (pre‐post; r = .60, p = .015; Figure 3), indicating that increased caudate rsFC was associated with reduction in PCL scores at post treatment. No significant correlation of changes in the caudate sMRI and clinical scores was found post treatment.
FIGURE 3.
The association between changes of resting state caudate connectivity and PCL changes
3 months follow‐up: Changes in caudate rsFC were significantly correlated with the extent of changes seen in both PCL (r = .58, p = .019) and BDI (r = .54, p = .03) scores from FU, compared to pre‐treatment baselines. Specifically, changes in caudate rsFC were positively associated with sustained improvement in BDI seen at 3 months after the conclusion of treatment.
No significant correlation of changes in the caudate sMRI and clinical scores were found at 3‐months FU.
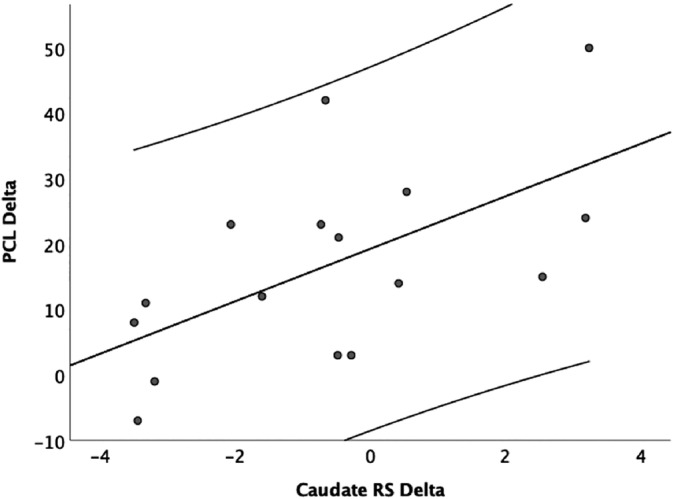
3.2.3. Associations between baseline neural predictors and clinical improvement at post‐treatment and 3‐month FU
Post‐treatment: baseline caudate rsFC was positively correlated with improvements in PCL scores (pre‐post; r = .69, p = .006; Figure 4). Specifically, the baseline caudate rsFC was positively correlated with baseline PCL (r = .34, p = .23), but negative correlated with post‐treatment PCL (r = −.26, p = .38). We also found a trending towards positive correlation with improved scores on both the HAM‐D (r = .57, p = .035 before correction) and BDI instruments (r = .61, p = .02 before correction). Higher baseline rsFC seen in the caudate before beginning treatment was positively correlated with greater post‐treatment symptom improvement. Baseline caudate sMRI was not significantly correlated with clinical improvement at post‐treatment.
FIGURE 4.

Baseline resting state caudate connectivity predicting the PCL changes
3 months follow‐up: baseline caudate rsFC was positively correlated with improvements in CAPS‐5 (r = .658, p = .011), HAM‐D (r = .73, p = .003), PCL (r = .82, p < .001), and BDI scores (pre‐FU; r = .67, p = .008). Specifically, for all 4 clinical measures, the baseline caudate rsFC was positively correlated with baseline clinical measures, but negative correlated with clinical measures at follow‐up (see Table S2 for each correlation).
In summary, baseline caudate rsFC was positively associated with changes in these indices measured at 3 months after the conclusion of EAT. There was no correlation between baseline sMRI and clinical scores at 3‐month follow‐up evaluation.
4. DISCUSSION
Our multimodal MRI study of neural mechanisms and predictors of treatment response to EAT for patients with PTSD revealed significant increase in caudate connectivity within the BGN network after treatment, as well as a reduction in the regional GMV of the thalamus and caudate. Increased caudate connectivity following treatment was associated with greater symptom reduction. Higher levels of baseline caudate connectivity was predictive of greater symptomatic reduction at the end of EAT, and was even more strongly correlated with sustained improvement seen at three‐month follow‐up after the conclusion of EAT.
Overall, our findings suggest that the limbic‐basal ganglionic reward system may be modified by the eight‐week‐long EAT employed for the treatment of PTSD. Previous resting‐state fMRI studies have identified the basal ganglia/limbic network at rest subsumes areas of the striatum, thalamus, and amygdala (Cole et al., 2012; Moussa, Steen, Laurienti, & Hayasaka, 2012). These regions have been strongly implicated in dopaminergic reward and learning processes (Sesack & Grace, 2010). The caudate nucleus is involved in reward anticipation and response. Abnormal functioning within the caudate has been documented in depression (Eshel & Roiser, 2010), and substance abuse (Volkow, Baler, & Goldstein, 2011), and most relevant for the present study, in PTSD (Elman et al., 2009; Sailer et al., 2008). Increased bilateral nucleus accumbens to right dorsomedial prefrontal cortex connectivity was associated with higher levels of anhedonia in trauma‐exposed individuals (Olson, Kaiser, Pizzagalli, Rauch, & Rosso, 2018). This evidence suggests that connectivity abnormalities within the basal ganglia/limbic network may contribute to aberrant reward processing (Schmidt et al., 2015) in PTSD. The current findings suggest that these abnormalities may be successfully targeted by EAT.
Results further show that baseline rsFC within the BGN predicted treatment outcomes. Specifically, baseline caudate rsFC was not correlated with PCL at independent time points, but rather was positively correlated with improvement in PCL scores after treatment. This PCL score improvement correlation was stronger three months later and correlated with CAPS‐5, HAM‐D, and BDI symptom improvement. These findings suggest that a stronger caudate connectivity before treatment predicted better outcomes post treatment, which strengthened with time. Clinical scores improvement also correlated with increase of caudate. Strengthening of caudate rsFC was significantly correlated with PCL score improvements post treatment and at three‐month follow‐up. Three‐month follow‐up caudate rsFC improvement was also correlated with BDI score improvements. The findings suggest that while baseline caudate connectivity predicts better treatment outcome overall, particularly at three‐month follow‐up, mainly PCL score improvement correlated with strengthening of caudate connectivity itself. This suggests that level of baseline striatal connectivity‐and rsFC in the caudate nucleus, in particular‐may be a stronger predictor of EAT outcome. Furthermore, EAT is changing the rsFC of the Caudate which in turns improves the symptoms of the patient.
T1 findings show a reduction in caudate regional GMV. Together with the pre‐ to post‐treatment connectivity changes, these results appear to indicate a pruning effect in the caudate from pre‐ to post‐treatment. In depression, lower caudate volume has been associated with anhedonia and greater depressive severity (Pizzagalli et al., 2009). Felmingham et al. (2014) suggested that impaired recruitment of the striatum may partially mediate the anhedonia characteristic of depression, addictive disorders, and PTSD (Felmingham et al., 2014). Studies have reported significantly increased gray matter density in left caudate in individuals with PTSD (Yang, Wu, Bai, Hou, & Gao, 2009). In addition, we also found a reduction in thalamus regional GMV. The thalamus, along with the caudate and putamen, comprise an essential part of the limbic cortico‐striatal‐thalamocortical circuit which is involved in fear and anxiety. Disfunction in this circuit appears to impair cognitive control, self‐regulation of behavior, and emotion. Thalamus volume abnormalities appear to be a consistent finding across depression studies (Espinoza Oyarce, Shaw, Alateeq, & Cherbuin, 2020). Our findings of decreased GMV of the caudate and thalamus at post‐treatment supports the idea that patients with PTSD might have a disrupted, dysfunctional reward circuitry, including cortico‐striatal‐thalamocortical circuits, that might be alleviated through EAT.
The present findings revealed no fractional anisotropy (FA) changes from pre‐ to post‐treatment. Previous findings in adult and youth with PTSD have suggested structural connectivity changes in white matter (WM) tracts (Fani et al., 2012; Kennis et al., 2015). Both increased and reduced FA in the cingulum bundle has been reported in patients with PTSD (Sanjuan, Thoma, Claus, Mays, & Caprihan, 2013; Zhang et al., 2012). Decreased FA in the corpus collosum, most prominently in the anterior and posterior midbody, the isthmus, and splenium were reported in a meta‐analysis summarizing findings from samples of children with PTSD and adult‐onset PTSD with childhood trauma (Siehl, King, Burgess, Flor, & Nees, 2018). For adult‐onset PTSD with traumatic experience in adulthood, changes were found in FA in the anterior and posterior part of the cingulum, the superior longitudinal fasciculus, and frontal regions. These findings suggest that changes in white matter microstructure vary depending on traumatic experience. Changes of FA have also been reported in PTSD following trauma‐focused therapy, including increases in FA in both the dorsal cingulum and posterior cingulum bundle (Zhang et al., 2012) in patients with chronically symptomatic PTSD (Kennis et al., 2015). Our data showed no FA changes, perhaps suggesting that EAT targets different neural circuitry than trauma‐focused therapy. Future studies with a larger sample size could help to investigate whether traumatic experience may moderate the effect of EAT treatment on DTI changes.
This study is the first to evaluate both structural and functional brain changes associated with EAT, in particular, with a specific manualized approach to the application of EAT to the treatment of PTSD. Still, several limitations must be acknowledged. The main limitation is that this study was part of an open trial design and lacks a control group. This design precludes comparison of neuroimaging results seen with EAT with a non‐treatment control group or with subjects undergoing other interventional immersive treatment therapies to assess whether they activate similar or different circuits. Another important limitation is the small sample size, which lacked statistical power to compare patient subgroups based on adjunctive treatment, trauma type, etc. Future neuroimaging studies treating larger samples in controlled designs are needed to replicate these findings and allow to examine to potential role of demographics, trauma history and concurrent treatments in the study of neural mechanisms and predictors of treatment outcome.
5. CONCLUSION
This study demonstrated that an eight‐week course of EAT in subject suffering with PTSD was associated with changes in the post‐treatment resting‐state reward networks in the caudate and volume changes in the thalamus and caudate on neuroimaging. Furthermore, baseline, pretreatment caudate connectivity significantly correlated with clinical improvement, suggesting enhanced reward responsiveness may underlie the improvements seen in subjects with PTSD after EAT treatment. PTSD is a heterogeneous disorder that has been shown to include symptoms related to diminished reward circuitry responsivity that can impact social and emotional responses. Improving reward circuitry might be a significant, initial step to finding new and enhanced methods to treat this complex disorder.
CONFLICT OF INTEREST
The authors declared no potential conflicts of interest with respect to the research, authorship, and/or publication of this article.
AUTHOR CONTRIBUTIONS
Xi Zhu involved in formal MRI analysis, writing—original draft. Benjamin Suarez‐Jimenez and Amit Lazarov involved in writing—review and editing. Sigal Zilcha‐Mano involved in regression analysis, writing—review and editing. Shay Arnon, Maja Bergman, and Matthew Ryba involved in data curation and project administration. Ari Lowell involved in project administration and supervision. Allan J. Hamilton, Jane F. Hamilton, and John C. Markowitz involved in conceptualization, writing—review and editing. J. Blake Turner involved in writing—review and editing. Prudence W. Fisher involved in conceptualization, data curation, funding acquisition, investigation, project administration, and supervision. Yuval Neria involved in conceptualization, funding acquisition, investigation, resources, supervision, writing—review and editing.
DATA AVAILABILITY STATEMENT
The data that support the findings of this study are available on request from the corresponding author.
Supporting information
Table S1: Symptom scores for participants receiving EAT
Table S2: Associations between Baseline Neural Predictors, and Clinical scores at baseline, post‐treatment and 3‐month FU
ACKNOWLEDGMENTS
The study was supported by the Earle I. Mack Foundation, the Jockey Club, the David and Julia Koch Foundation, the Nicholson Family Charity Fund, the Mary & Daniel Loughran Foundation, the Viola Foundation, Gulfstream Park Racing Association, Gerald Parsky, Peter M. Brant, Meta Aerospace, the Ganek Family Foundation, the Live Oak Foundation, the Reid Family Charitable Fund, and Meta Aerospace Capital, LTD, and Tactical Air Support. The funding agencies had no role in the study design; in the collection, analysis and interpretation of data; in the writing of the report; or in the decision to submit the article for publication.
Zhu X, Suarez‐Jimenez B, Zilcha‐Mano S, et al. Neural changes following equine‐assisted therapy for posttraumatic stress disorder: A longitudinal multimodal imaging study. Hum Brain Mapp. 2021;42:1930–1939. 10.1002/hbm.25360
Trial Registration: ClinicalTrials.gov identifier: NCT03068325
Funding information David and Julia Koch Foundation; Earle I. Mack Foundation; Ganek Family Foundation; Gerald Parsky; Gulfstream Park Racing Association; Jockey Club; Live Oak Foundation; Mary & Daniel Loughran Foundation; Meta Aerospace Capital, LTD; Nicholson Family Charity Fund; Peter M. Brant; Reid Family Charitable Fund; Tactical Air Support; Viola Foundation
REFERENCES
- American Psychiatric Association . (2013). Diagnostic and statistical manual of mental disorders (5th ed.). Washington, DC: American Psychiatric Publishing. [Google Scholar]
- Anestis, M. D. , Anestis, J. C. , Zawilinski, L. L. , Hopkins, T. A. , & Lilienfeld, S. O. (2014). Equine‐related treatments for mental disorders lack empirical support: A systematic review of empirical investigations. Journal of Clinical Psychology, 70(12), 1115–1132. 10.1002/jclp.22113 [DOI] [PubMed] [Google Scholar]
- Arnon, S. , Fisher, P. W. , Pickover, A. , Lowell, A. , Turner, J. B. , Hilburn, A. , … Neria, Y. (2020). Equine‐assisted therapy for veterans with PTSD. Military Medicine. [DOI] [PMC free article] [PubMed] [Google Scholar]
- Ashburner, J. (2007). A fast diffeomorphic image registration algorithm. Neuroimage, 38(1), 95–113. [DOI] [PubMed] [Google Scholar]
- Bachi, K. , Terkel, J. , & Teichman, M. (2012). Equine‐facilitated psychotherapy for at‐risk adolescents: The influence on self‐image, self‐control and trust. Clinical Child Psychology and Psychiatry, 17(2), 298–312. 10.1177/1359104511404177 [DOI] [PubMed] [Google Scholar]
- Beck, A. T. , Steer, R. A. , Ball, R. , & Ranieri, W. (1996). Comparison of Beck Depression Inventories‐IA and ‐II in psychiatric outpatients. Journal of Personality Assessment, 67(3), 588–597. 10.1207/s15327752jpa6703_13 [DOI] [PubMed] [Google Scholar]
- Blevins, C. A. , Weathers, F. W. , Davis, M. T. , Witte, T. K. , & Domino, J. L. (2015). The posttraumatic stress disorder checklist for DSM‐5 (PCL‐5): Development and initial psychometric evaluation. Journal of Traumatic Stress, 28(6), 489–498. 10.1002/jts.22059 [DOI] [PubMed] [Google Scholar]
- Bovin, M. J. , Marx, B. P. , Weathers, F. W. , Gallagher, M. W. , Rodriguez, P. , Schnurr, P. P. , & Keane, T. M. (2016). Psychometric properties of the PTSD checklist for diagnostic and statistical manual of mental disorders‐fifth edition (PCL‐5) in veterans. Psychological Assessment, 28(11), 1379–1391. 10.1037/pas0000254 [DOI] [PubMed] [Google Scholar]
- Calhoun, V. D. , Adali, T. , Pearlson, G. D. , & Pekar, J. J. (2001). A method for making group inferences from functional MRI data using independent component analysis. Human Brain Mapping, 14(3), 140–151. 10.1002/hbm.1048 [DOI] [PMC free article] [PubMed] [Google Scholar]
- Cole, D. M. , Beckmann, C. F. , Searle, G. E. , Plisson, C. , Tziortzi, A. C. , Nichols, T. E. , … Beaver, J. D. (2012). Orbitofrontal connectivity with resting‐state networks is associated with midbrain dopamine D3 receptor availability. Cerebral Cortex, 22(12), 2784–2793. 10.1093/cercor/bhr354 [DOI] [PubMed] [Google Scholar]
- Elman, I. , Lowen, S. , Frederick, B. B. , Chi, W. , Becerra, L. , & Pitman, R. K. (2009). Functional neuroimaging of reward circuitry responsivity to monetary gains and losses in posttraumatic stress disorder. Biological Psychiatry, 66(12), 1083–1090. 10.1016/j.biopsych.2009.06.006 [DOI] [PMC free article] [PubMed] [Google Scholar]
- Eshel, N. , & Roiser, J. P. (2010). Reward and punishment processing in depression. Biological Psychiatry, 68(2), 118–124. 10.1016/j.biopsych.2010.01.027 [DOI] [PubMed] [Google Scholar]
- Espinoza Oyarce, D. A. , Shaw, M. E. , Alateeq, K. , & Cherbuin, N. (2020). Volumetric brain differences in clinical depression in association with anxiety: A systematic review with meta‐analysis. Journal of Psychiatry and Neuroscience, 45(6), 406–429. 10.1503/jpn.190156 [DOI] [PMC free article] [PubMed] [Google Scholar]
- Fani, N. , King, T. Z. , Jovanovic, T. , Glover, E. M. , Bradley, B. , Choi, K. , … Ressler, K. J. (2012). White matter integrity in highly traumatized adults with and without post‐traumatic stress disorder. Neuropsychopharmacology, 37(12), 2740–2746. 10.1038/npp.2012.146 [DOI] [PMC free article] [PubMed] [Google Scholar]
- Felmingham, K. L. , Falconer, E. M. , Williams, L. , Kemp, A. H. , Allen, A. , Peduto, A. , & Bryant, R. A. (2014). Reduced amygdala and ventral striatal activity to happy faces in PTSD is associated with emotional numbing. PLoS One, 9(9), e103653. 10.1371/journal.pone.0103653 [DOI] [PMC free article] [PubMed] [Google Scholar]
- First, M. , Williams, J. , Karg, R. , & Spitzer, R. (2015). Structured clinical interview for DSM‐5 research version (SCID‐5 for DSM‐5, research version; SCID‐5‐RV). Arlington, VA: American Psychiatric Association. [Google Scholar]
- Fonzo, G. A. , Goodkind, M. S. , Oathes, D. J. , Zaiko, Y. V. , Harvey, M. , Peng, K. K. , … Etkin, A. (2017a). PTSD psychotherapy outcome predicted by brain activation during emotional reactivity and regulation. The American Journal of Psychiatry, 174(12), 1163–1174. 10.1176/appi.ajp.2017.16091072 [DOI] [PMC free article] [PubMed] [Google Scholar]
- Fonzo, G. A. , Goodkind, M. S. , Oathes, D. J. , Zaiko, Y. V. , Harvey, M. , Peng, K. K. , … Etkin, A. (2017b). Selective effects of psychotherapy on frontopolar cortical function in PTSD. The American Journal of Psychiatry, 174(12), 1175–1184. 10.1176/appi.ajp.2017.16091073 [DOI] [PMC free article] [PubMed] [Google Scholar]
- Hamilton, M. (1960). A rating scale for depression. Journal of Neurology, Neurosurgery, and Psychiatry, 23(1), 56–62. 10.1136/jnnp.23.1.56 [DOI] [PMC free article] [PubMed] [Google Scholar]
- Helpman, L. , Marin, M. F. , Papini, S. , Zhu, X. , Sullivan, G. M. , Schneier, F. , … Neria, Y. (2016). Neural changes in extinction recall following prolonged exposure treatment for PTSD: A longitudinal fMRI study. NeuroImage: Clinical, 12, 715–723. 10.1016/j.nicl.2016.10.007 [DOI] [PMC free article] [PubMed] [Google Scholar]
- Helpman, L. , Papini, S. , Chhetry, B. T. , Shvil, E. , Rubin, M. , Sullivan, G. M. , … Neria, Y. (2016). PTSD remission after prolonged exposure treatment is associated with anterior cingulate cortex thinning and volume reduction. Depression and Anxiety, 33(5), 384–391. 10.1002/da.22471 [DOI] [PMC free article] [PubMed] [Google Scholar]
- Holder, N. , Holliday, R. , Wiblin, J. , LePage, J. P. , & Suris, A. (2019). Predictors of dropout from a randomized clinical trial of cognitive processing therapy for female veterans with military sexual trauma‐related PTSD. Psychiatry Research, 276, 87–93. 10.1016/j.psychres.2019.04.022 [DOI] [PubMed] [Google Scholar]
- Kang, H. K. , Natelson, B. H. , Mahan, C. M. , Lee, K. Y. , & Murphy, F. M. (2003). Post‐traumatic stress disorder and chronic fatigue syndrome‐like illness among Gulf War veterans: A population‐based survey of 30,000 veterans. American Journal of Epidemiology, 157(2), 141–148. 10.1093/aje/kwf187 [DOI] [PubMed] [Google Scholar]
- Kennis, M. , van Rooij, S. J. , do Tromp, P. M. , Fox, A. S. , Rademaker, A. R. , Kahn, R. S. , … Geuze, E. (2015). Treatment outcome‐related white matter differences in veterans with posttraumatic stress disorder. Neuropsychopharmacology, 40(10), 2434‐2442.doi:10.1038/npp.2015.94 [DOI] [PMC free article] [PubMed] [Google Scholar]
- Laugharne, J. , Kullack, C. , Lee, C. W. , McGuire, T. , Brockman, S. , Drummond, P. D. , & Starkstein, S. (2016). Amygdala volumetric change following psychotherapy for posttraumatic stress disorder. Journal of Neuropsychiatry and Clinical Neurosciences, 28(4), 312–318. 10.1176/appi.neuropsych.16010006 [DOI] [PubMed] [Google Scholar]
- Levy‐Gigi, E. , Szabo, C. , Kelemen, O. , & Keri, S. (2013). Association among clinical response, hippocampal volume, and FKBP5 gene expression in individuals with posttraumatic stress disorder receiving cognitive behavioral therapy. Biological Psychiatry, 74(11), 793–800. 10.1016/j.biopsych.2013.05.017 [DOI] [PubMed] [Google Scholar]
- Lewis, C. , Roberts, N. P. , Gibson, S. , & Bisson, J. I. (2020). Dropout from psychological therapies for post‐traumatic stress disorder (PTSD) in adults: Systematic review and meta‐analysis. European Journal of Psychotraumatology, 11(1), 1709709. 10.1080/20008198.2019.1709709 [DOI] [PMC free article] [PubMed] [Google Scholar]
- Lindauer, R. J. , Vlieger, E. J. , Jalink, M. , Olff, M. , Carlier, I. V. , Majoie, C. B. , … Gersons, B. P. (2005). Effects of psychotherapy on hippocampal volume in out‐patients with post‐traumatic stress disorder: A MRI investigation. Psychological Medicine, 35(10), 1421–1431. 10.1017/S0033291705005246 [DOI] [PubMed] [Google Scholar]
- Matthew, B. , Jean‐Luc, A. , Romain, V. , & Jean‐Baptiste, P. (2002). Region of interest analysis using an SPM toolbox [abstract]. Presented at the 8th International Conference on Functional Mapping of the Human Brain, 16(2). [Google Scholar]
- Moussa, M. N. , Steen, M. R. , Laurienti, P. J. , & Hayasaka, S. (2012). Consistency of network modules in resting‐state FMRI connectome data. PLoS One, 7(8), e44428. 10.1371/journal.pone.0044428 [DOI] [PMC free article] [PubMed] [Google Scholar]
- Nisar, S. , Bhat, A. A. , Hashem, S. , Syed, N. , Yadav, S. K. , Uddin, S. , … Haris, M. (2020). Genetic and neuroimaging approaches to understanding post‐traumatic stress disorder. International Journal of Molecular Sciences, 21(12), 4503. 10.3390/ijms21124503 [DOI] [PMC free article] [PubMed] [Google Scholar]
- Olson, E. A. , Kaiser, R. H. , Pizzagalli, D. A. , Rauch, S. L. , & Rosso, I. M. (2018). Anhedonia in trauma‐exposed individuals: Functional connectivity and decision‐making correlates. Biological Psychiatry: Cognitive Neuroscience and Neuroimaging, 3(11), 959–967. 10.1016/j.bpsc.2017.10.008 [DOI] [PMC free article] [PubMed] [Google Scholar]
- Pizzagalli, D. A. , Holmes, A. J. , Dillon, D. G. , Goetz, E. L. , Birk, J. L. , Bogdan, R. , … Fava, M. (2009). Reduced caudate and nucleus accumbens response to rewards in unmedicated individuals with major depressive disorder. The American Journal of Psychiatry, 166(6), 702–710. 10.1176/appi.ajp.2008.08081201 [DOI] [PMC free article] [PubMed] [Google Scholar]
- Sailer, U. , Robinson, S. , Fischmeister, F. P. , Konig, D. , Oppenauer, C. , Lueger‐Schuster, B. , … Bauer, H. (2008). Altered reward processing in the nucleus accumbens and mesial prefrontal cortex of patients with posttraumatic stress disorder. Neuropsychologia, 46(11), 2836–2844. 10.1016/j.neuropsychologia.2008.05.022 [DOI] [PubMed] [Google Scholar]
- Sanjuan, P. M. , Thoma, R. , Claus, E. D. , Mays, N. , & Caprihan, A. (2013). Reduced white matter integrity in the cingulum and anterior corona radiata in posttraumatic stress disorder in male combat veterans: A diffusion tensor imaging study. Psychiatry Research, 214(3), 260–268. 10.1016/j.pscychresns.2013.09.002 [DOI] [PMC free article] [PubMed] [Google Scholar]
- Schmidt, A. , Denier, N. , Magon, S. , Radue, E. W. , Huber, C. G. , Riecher‐Rossler, A. , … Walter, M. (2015). Increased functional connectivity in the resting‐state basal ganglia network after acute heroin substitution. Translational Psychiatry, 5, e533. 10.1038/tp.2015.28 [DOI] [PMC free article] [PubMed] [Google Scholar]
- Selby, A. , & Smith‐Osborne, A. (2013). A systematic review of effectiveness of complementary and adjunct therapies and interventions involving equines. Health Psychology, 32(4), 418–432. 10.1037/a0029188 [DOI] [PubMed] [Google Scholar]
- Sesack, S. R. , & Grace, A. A. (2010). Cortico‐Basal Ganglia reward network: Microcircuitry. Neuropsychopharmacology, 35(1), 27–47. 10.1038/npp.2009.93 [DOI] [PMC free article] [PubMed] [Google Scholar]
- Siehl, S. , King, J. A. , Burgess, N. , Flor, H. , & Nees, F. (2018). Structural white matter changes in adults and children with posttraumatic stress disorder: A systematic review and meta‐analysis. NeuroImage: Clinical, 19, 581–598. 10.1016/j.nicl.2018.05.013 [DOI] [PMC free article] [PubMed] [Google Scholar]
- Suarez‐Jimenez, B. , Zhu, X. , Lazarov, A. , Mann, J. J. , Schneier, F. , Gerber, A. , … Markowitz, J. C. (2020). Anterior hippocampal volume predicts affect‐focused psychotherapy outcome. Psychological Medicine, 50(3), 396–402. 10.1017/S0033291719000187 [DOI] [PMC free article] [PubMed] [Google Scholar]
- Sullivan, G. M. , & Neria, Y. (2009). Pharmacotherapy in post‐traumatic stress disorder: Evidence from randomized controlled trials. Current Opinion in Investigational Drugs, 10(1), 35–45.Retrieved from. https://www.ncbi.nlm.nih.gov/pubmed/19127485 [PMC free article] [PubMed] [Google Scholar]
- van Rooij, S. J. , Kennis, M. , Sjouwerman, R. , van den Heuvel, M. P. , Kahn, R. S. , & Geuze, E. (2015). Smaller hippocampal volume as a vulnerability factor for the persistence of post‐traumatic stress disorder. Psychological Medicine, 45(13), 2737–2746. 10.1017/S0033291715000707 [DOI] [PubMed] [Google Scholar]
- Volkow, N. D. , Baler, R. D. , & Goldstein, R. Z. (2011). Addiction: Pulling at the neural threads of social behaviors. Neuron, 69(4), 599–602. 10.1016/j.neuron.2011.01.027 [DOI] [PMC free article] [PubMed] [Google Scholar]
- Yang, C. , Wu, S. , Bai, Y. , Hou, C. , & Gao, H. (2009). Voxel based morphometric study of brain structure in patients with posttraumatic stress disorder. Sheng Wu Yi Xue Gong Cheng Xue Za Zhi, 26(1), 30–33.Retrieved from. https://www.ncbi.nlm.nih.gov/pubmed/19334548 [PubMed] [Google Scholar]
- Zhang, L. , Li, W. , Shu, N. , Zheng, H. , Zhang, Z. , Zhang, Y. , … Li, L. (2012). Increased white matter integrity of posterior cingulate gyrus in the evolution of post‐traumatic stress disorder. Acta Neuropsychiatrica, 24(1), 34–42. 10.1111/j.1601-5215.2011.00580.x [DOI] [PubMed] [Google Scholar]
- Zhu, X. , Suarez‐Jimenez, B. , Lazarov, A. , Helpman, L. , Papini, S. , Lowell, A. , … Neria, Y. (2018). Exposure‐based therapy changes amygdala and hippocampus resting‐state functional connectivity in patients with posttraumatic stress disorder. Depression and Anxiety, 35(10), 974–984. 10.1002/da.22816 [DOI] [PMC free article] [PubMed] [Google Scholar]
Associated Data
This section collects any data citations, data availability statements, or supplementary materials included in this article.
Supplementary Materials
Table S1: Symptom scores for participants receiving EAT
Table S2: Associations between Baseline Neural Predictors, and Clinical scores at baseline, post‐treatment and 3‐month FU
Data Availability Statement
The data that support the findings of this study are available on request from the corresponding author.