

Abstract
Demanding cognitive functions like working memory (WM) depend on functional brain networks being able to communicate efficiently while also maintaining some degree of modularity. Evidence suggests that aging can disrupt this balance between integration and modularity. In this study, we examined how cognitive training affects the integration and modularity of functional networks in older and younger adults. Twenty three younger and 23 older adults participated in 10 days of verbal WM training, leading to performance gains in both age groups. Older adults exhibited lower modularity overall and a greater decrement when switching from rest to task, compared to younger adults. Interestingly, younger but not older adults showed increased task‐related modularity with training. Furthermore, whereas training increased efficiency within, and decreased participation of, the default‐mode network for younger adults, it enhanced efficiency within a task‐specific salience/sensorimotor network for older adults. Finally, training increased segregation of the default‐mode from frontoparietal/salience and visual networks in younger adults, while it diffusely increased between‐network connectivity in older adults. Thus, while younger adults increase network segregation with training, suggesting more automated processing, older adults persist in, and potentially amplify, a more integrated and costly global workspace, suggesting different age‐related trajectories in functional network reorganization with WM training.
Keywords: cingulo‐opercular network, global efficiency, graph theory, intrinsic activity, participation coefficient, Sternberg task, task‐related connectivity
We examined how working memory (WM) training affects the integration and modularity of functional networks in older and younger adults. Younger adults increase network segregation with training, suggesting more automated processing. Older adults persist in, and potentially amplify, a more integrated and costly global workspace, suggesting different age‐related trajectories in functional network reorganization with WM training.

1. INTRODUCTION
Cognitive performance critically depends on the brain's ability to balance functional integration and segregation (Dehaene, Kerszberg, & Changeux, 1998), which is supported by the brain's modular network organization (Crossley et al., 2013). By definition, a modular network has denser connections within its modules (or subnetworks) and sparser connections between different component modules (Newman, 2006). Typically, brain network modularity has been studied using resting‐state functional MRI recordings and a high level of modularity has been associated with better performance in various cognitive domains, such as working memory (WM), attention, episodic memory, learning, and overall intelligence (for a recent review, see Gallen & D'Esposito, 2019).
Brain imaging evidence also shows that modularity decreases with aging (e.g., Betzel et al., 2014; Cao et al., 2014; Chan, Park, Savalia, Petersen, & Wig, 2014; Gallen, Turner, Adnan, & D'Esposito, 2016; Geerligs, Renken, Saliasi, Maurits, & Lorist, 2015; Iordan et al., 2018; Onoda & Yamaguchi, 2013; Song et al., 2014), as brain networks become overall less functionally distinct, consistent with the idea of age‐related functional dedifferentiation (Grady, 2012; Park et al., 2004; Park, Carp, Hebrank, Park, & Polk, 2010). Furthermore, aging disproportionately affects “associative” brain networks that mediate higher‐level functions, such as the frontoparietal and default‐mode networks, compared to “sensory‐motor” networks, such as the somato‐sensorimotor and visual networks (Chan et al., 2014; Geerligs et al., 2015; Iordan et al., 2018; Malagurski, Liem, Oschwald, Mérillat, & Jäncke, 2020). Thus, current evidence suggests that age‐related cognitive decline is linked, at least in part, to altered communication within and between the associative brain networks.
Complementing resting‐state investigations, task‐related data show that functional brain modularity is also influenced by the level of cognitive demand or load. In general, the performance of challenging tasks has been associated with switching from a relatively segregated network configuration, which typically characterizes the resting‐state, to a more integrated network configuration, that supports cognitive performance (Braun et al., 2015; Cohen & D'Esposito, 2016; Finc et al., 2017, 2020; Shine et al., 2016; Vatansever, Menon, Manktelow, Sahakian, & Stamatakis, 2015; Zuo, Yang, Liu, Li, & Jiang, 2018). Consequently, complex cognitive functions, such as WM, elicit more extensive network reconfigurations compared to lower‐level or highly automated functions, and these reconfigurations primarily involve the associative brain networks (e.g., Cohen & D'Esposito, 2016; Cole et al., 2013; Yue et al., 2017). Demand‐dependent changes in the functional relationships between these networks have been reported in various cognitive domains, including WM (Vatansever et al., 2015), decision making (Cole et al., 2013), and reasoning (Hearne, Cocchi, Zalesky, & Mattingley, 2017). Of note, although such task‐related reconfigurations are consistent and support behavioral performance, they are relatively small compared to the functional relationships that characterize the brain's intrinsic network architecture (Cole, Bassett, Power, Braver, & Petersen, 2014; Crossley et al., 2013; Krienen, Yeo, & Buckner, 2014).
Despite recent progress in elucidating the brain's large‐scale functional organization, important questions remain unanswered. For instance, how does aging affect brain network reconfigurations elicited by demanding cognitive tasks, and can these be influenced by cognitive training? In line with the Compensation Related Utilization of Neural Circuits Hypothesis (CRUNCH; Reuter‐Lorenz & Cappell, 2008), brain activation studies have identified age differences in neural recruitment during the performance of demanding cognitive tasks (Li et al., 2015; Spreng, Wojtowicz, & Grady, 2010). Such studies also point to cognitive demand as a critical factor influencing whether older adults will over‐activate or under‐activate WM circuitry relative to younger adults (Cappell, Gmeindl, & Reuter‐Lorenz, 2010; Heinzel et al., 2014; Schneider‐Garces et al., 2010). However, age differences in functional connectivity related to task transitions have been less investigated (cf. Gallen, Turner, et al., 2016). Furthermore, recent evidence shows that modularity increases with training in younger adults, suggesting that less brain network integration is required to support high performance once a task is automated, even for complex tasks, such as WM (Finc et al., 2020). For older adults, recent evidence (Iordan et al., 2020) suggests that WM training increases brain responsiveness by shifting the activation peak toward higher WM loads. However, it is unclear what changes in the large‐scale network organization occur with training in older adults. Recently, brain network modularity has been proposed as a biomarker of cognitive plasticity (Gallen & D'Esposito, 2019) based, in part, on accumulating evidence showing that individual differences in older adults’ network modularity at rest predict cognitive gains in the context of training (Gallen et al., 2016; Iordan et al., 2018). This is exciting because it suggests that the aging brain retains potential for plasticity, which could be harnessed more broadly if the mechanisms underlying such benefits can be further elucidated. However, no studies so far have investigated age‐related changes in the large‐scale network organization elicited by cognitive training, particularly during cognitive task performance.
Here, we have investigated age differences in the reconfiguration of large‐scale functional brain networks in the context of WM training. Because we compared functional connectivity during both resting‐state and task performance, we focused on “background connectivity,” that is endogenous or “residual” functional connectivity between brain regions after accounting for variance related to evoked task activity (Summerfield et al., 2006; Turk‐Browne, 2013). Our experimental sample comprised healthy older and younger adults who participated in an adaptive verbal WM training study with three functional MRI scanning sessions. Sessions 1 and 2 were 2 weeks apart (Time1 and Time2) and preceded a 10‐day adaptive WM training intervention. The third scanning session (Time3) was conducted immediately after training, approximately 2 weeks after Time2. This within‐subject design enabled us to dissociate the effects of task‐exposure (Time1 vs. Time2) from the effects of training (Time2 vs. Time3).
We used graph theory metrics to assess functional brain network reorganization at three levels, specifically (a) at the level of the whole‐brain, (b) at the level of individual networks, and (c) at the level of pairwise relations between brain regions. We focused on modularity to assess whole‐brain segregation/integration and followed‐up with measures of within‐network and between‐network communication, that is, global efficiency and the participation coefficient, respectively. Global efficiency is a graph measure that indexes integration of information within a network, whereas the participation coefficient indexes the propensity of nodes within a network to form links with nodes outside of their own network. Finally, at the level of pairwise relations between regions, we employed the network‐based statistic (NBS) method, a univariate approach that tests links between regions individually and controls for familywise error at the network level (Zalesky, Fornito, & Bullmore, 2010).
Based on previous evidence, we made the following predictions: First, we expected overall lower modularity in older compared to younger adults, lower modularity during task performance compared to resting‐state, and progressively lower modularity with increasing WM load. It remains an open question, however, whether older adults would also show a greater decrease in modularity when switching from resting‐state to task mode and a steeper decrease in modularity with increasing task load, compared to younger adults. Second, regarding WM training, we expected that network reorganization would be elicited by the training intervention and not by simple task‐exposure and that task‐related functional connectivity would be more sensitive to the training effects than resting‐state recordings. A related open question is whether younger adults would show a greater enhancement in modularity with training, compared to older adults. Finally, at the level of individual brain networks, we expected that WM training would be linked to reconfigurations primarily at the level of associative brain networks, in particular, the frontoparietal and default‐mode networks.
2. MATERIALS AND METHODS
2.1. Participants
A sample of 23 healthy, cognitively normal older and 23 younger adults was recruited from the University of Michigan campus and community surrounding Ann Arbor, Michigan. The initial sample size was based on prior work examining age and load effects in WM (Cappell et al., 2010). Detailed sample characteristics are presented elsewhere (Iordan et al., 2020). Briefly, all participants were right‐handed, native English speakers with normal or corrected‐to‐normal hearing and vision and were screened for history of head injury, psychiatric illness, or alcohol/drug abuse. Data from 2 older and 2 younger adults were excluded due to technical errors in the administration of the training (1 older adult) or fMRI (1 younger adult) protocols, inability to perform the fMRI task (1 younger adult did not provide responses to >50% of the trials), and attrition (1 older adult failed to return for the last scan). Thus, the behavioral sample consisted of 21 older adults (age range: 63–75; 10 women) with a mean age of 67.81 (±3.31) years and 21 younger adults (age range: 18–28; 12 women) with a mean age (±SD) of 21.33 (±2.65) years. In addition, 1 younger and 3 older adults were excluded from the fMRI analyses due to technical issues related to scan acquisition that affected different phases of the scan, that is, task (2 older adults) and resting‐state (1 younger adult and 1 older adult), and thus the fMRI sample consisted of 18 older and 20 younger adults. The University of Michigan Institutional Review Board approved all procedures, and all participants provided informed consent before participating.
2.2. Experimental design and procedure
2.2.1. fMRI WM task
During each of the three fMRI scanning sessions (Figure 1a), participants performed a delayed match‐to‐sample verbal WM task (Sternberg, 1966) with span and supraspan loads (Figure 1b). At the beginning of each trial, a set of letters was displayed during encoding (4 s), followed by a fixation cross during the maintenance interval (7 s). At retrieval, a probe letter was displayed on the screen (2 s), and participants indicated by a button‐press whether or not the probe was part of the memory set. The memory sets varied in size from 4 to 8 letters for older adults and from 5 to 9 letters for younger adults. These age‐specific ranges of loads were chosen based on pilot data to minimize ceiling and floor effects on WM performance, and to allow comparisons of both baseline performance and training‐induced improvement. Both groups also completed a control condition (set size of 1) that served as a “task mode” condition here, specifically a WM task with a minimal load. During each fMRI session, participants completed six blocks of 24 trials (one older and one younger adult completed 5 runs at Time1), with each block comprising four trials of each set size, displayed in random order. Before the first scanning session, all participants practiced the task in a mock scanner, for a total of 12 trials, with two trials per load. Participants were monitored for understanding of the task and accurate responding, and before each scanning session participants were reminded about the task instructions.
FIGURE 1.

Experimental design. (a) The present within‐subjects design enabled the dissociation of task‐exposure (Time1 vs. Time2) from training (Time2 vs. Time3) effects. (b) During each fMRI session, participants performed a delayed match‐to‐sample verbal WM task, with varying memory sets. Abbreviations: OA, older adults; YA, younger adults; WM, working memory
2.2.2. Behavioral WM training task
The training task was an adaptive verbal WM task, similar to the fMRI task in terms of the type of stimuli employed (i.e., letters) but different with respect to the set sizes and timing (Iordan et al., 2018). All participants started the first training session with a set size of three letters. The number of letters in each memory set remained constant for each block and was determined by the participant's performance in the previous block. The set size increased by one letter if the participants’ accuracy was >86% on the preceding block and decreased by one letter if their accuracy was <72%. The set size attained in the last session of each day was used as the starting set size the subsequent day. For each trial, the memory set was displayed for a duration weighted by its size (325 ms × set size) at encoding, followed by a 3 s maintenance interval, and a 2 s retrieval period. Participants completed six blocks of 14 trials during each of the 10 training sessions. All training sessions occurred in our laboratory at the University of Michigan, lasted approximately 15 min each, and were scheduled on consecutive days (except weekends). Both the fMRI and the training tasks were presented using E‐Prime 2.0 (Psychology Software Tools, Pittsburgh, PA).
2.3. Imaging protocol
Imaging data were collected using a 3 T General Electric MR750 scanner with an eight‐channel head coil. Functional images were acquired in ascending order using a spiral‐in sequence, with MR parameters: TR = 2000 ms; TE = 30 ms; flip angle = 90°; field of view = 220 × 220 mm2; matrix size = 64 × 64; slice thickness = 3 mm, no gap; 43 slices; voxel size = 3.44 × 3.44 × 3 mm3. After an initial 10 s of signal stabilization, 168 volumes were acquired for each of the 6 WM task runs and 235 volumes were acquired for the resting‐state run, respectively. A high‐resolution T1‐weighted anatomical image was also collected following the WM task and preceding resting‐state acquisition, using spoiled‐gradient‐recalled acquisition (SPGR) in steady‐state imaging (TR = 12.24 ms, TE = 5.18 ms; flip angle = 15°, field of view = 256 × 256 mm2, matrix size = 256 × 256; slice thickness = 1 mm; 156 slices; voxel size = 1 × 1 × 1 mm3). Images were produced using a k‐space de‐spiking of outliers, followed by image reconstruction using an in‐house iterative algorithm with field‐map correction (Sutton, Noll, & Fessler, 2003), which has superior reconstruction quality compared to non‐iterative conjugate phase reconstruction. Initial images and field‐map estimates were inspected for distortions and when present, the field maps were re‐estimated using maps from adjacent runs.
2.4. Preprocessing
Preprocessing was performed using SPM12 (Wellcome Department of Cognitive Neurology, London) and MATLAB R2015a (The MathWorks Inc., Natick, MA). Functional images were slice‐time corrected, realigned, and co‐registered to the anatomical image using a mean functional image. A study‐specific anatomical template was created (younger and older adults together; Iordan et al., 2018), using Diffeomorphic Anatomical Registration Through Exponentiated Lie Algebra (DARTEL; Ashburner, 2007), based on segmented gray matter and white matter tissue classes, to optimize inter‐participant alignment (Klein et al., 2009). The DARTEL flowfields and MNI transformation were then applied to the functional images, and the functional images were resampled to 3 × 3 × 3 mm3 voxel size. Additional spatial smoothing was not applied, based on evidence that it negatively affects network properties and graph measures (see Alakorkko, Saarimaki, Glerean, Saramaki, & Korhonen, 2017; Fornito, Zalesky, & Breakspear, 2013; Korhonen, Saarimäki, Glerean, Sams, & Saramäki, 2017; Stanley et al., 2013; Triana, Glerean, Saramäki, & Korhonen, 2020; van den Heuvel, Stam, Kahn, & Hulshoff Pol, 2009; Zalesky, Fornito, & Bullmore, 2012). (See Supplementary Results for a control analysis using smoothed data.) Identification of outlier scans was performed using Artifact Detection Tools (ART; www.nitrc.org/projects/_artifact_detect/), as follows. Scans were classified as outliers if frame‐to‐frame displacement exceeded 0.5 mm in composite motion (combination of translational and rotational displacements) or 3 SDs in the global mean signal. On average, the proportion of outliers was at or below 5% in both older (task: 4.33%, resting‐state: 3.4%) and younger adults (task: 5.08%, resting‐state: 3.6%). Scan‐nulling regressors (i.e., 1 for the outlier volume and 0 everywhere else) were added to the time‐series denoising step (Whitfield‐Gabrieli & Nieto‐Castanon, 2012) in the linear regression to address outlier volumes (see below). Overall, there was more motion during task than during rest. Mixed‐model Group × Time × DataType ANOVAs indicated more outliers (F 1,36 = 4.26, p = .046, η p 2 = 0.11), as well as more motion (i.e., max frame displacement) both before (F 1,36 = 12.29, p = .001, η p 2 = 0.25) and after “scrubbing” (F 1,36 = 21.03, p < .001, η p 2 = 0.37), for task compared to resting‐state acquisition. This was not surprising, given that participants provided motor responses during the WM task and the task data acquisition lasted substantially longer than the resting‐state. Critically, though, there were no differences in motion between the two groups (ps > .3), and no other significant main effects or interactions (ps > .05).
2.5. Graph construction
Brain‐wide functional connectivity analyses were performed using the Connectivity Toolbox (CONN; Whitfield‐Gabrieli & Nieto‐Castanon, 2012). To construct a brain‐wide graph, we employed a commonly used functional atlas (Power et al., 2011) shown to provide good homogeneity across younger and older participants (Geerligs, Tsvetanov, & Henson, 2017). The Power et al. atlas comprises 264 cortical and subcortical coordinates defined meta‐analytically, across a variety of tasks, from a large participant sample (N > 300). (For robustness analyses, we also employed another parcellation by Schaefer et al. (2018), derived from resting‐state data; see Supplementary Results.) A 5 mm‐radius sphere was centered at each of the Power et al. atlas coordinates. To ensure that the graph comprised regions that were not susceptible to fMRI signal drop‐out, each sphere was filtered through a sample‐level signal intensity mask, calculated as follows. First, binary masks were calculated for each participant's resting‐state and task data, at each time point, thresholded at >70% mean signal intensity (Cohen & D'Esposito, 2016; Geerligs et al., 2015; Iordan et al., 2018), computed over all voxels, using ART. Then, a sample‐level mask was calculated, across all participants, using logical “AND” conjunction. Regions with fewer than 8 voxels (~50% volume) overlap with the sample‐level mask were excluded, leaving 221 regions of interest (ROIs). Of note, this procedure eliminated mostly nodes affiliated with the “Uncertain” module in the Power et al. atlas (i.e., 68% of the “Uncertain” nodes were eliminated), which includes brain regions typically susceptible to fMRI signal drop‐out (Power et al., 2011).
To remove physiological and other sources of noise from the fMRI time series we used linear regression and the anatomical CompCor method (Behzadi, Restom, Liau, & Liu, 2007; Chai, Castanon, Ongur, & Whitfield‐Gabrieli, 2012; Muschelli et al., 2014), as implemented in CONN. Each participant's white matter and cerebrospinal fluid masks derived during segmentation, eroded by 1 voxel to minimize partial volume effects, were used as noise ROIs. The following temporal covariates were added to the model: undesired linear trend, signal extracted from each participant's noise ROIs (5 principal component analysis parameters for each), motion parameters (3 rotation and 3 translation parameters, plus their first‐order temporal derivatives), regressors for each outlier scan (i.e., “scrubbing”; one covariate was added for each outlier scan, consisting of 0's everywhere but the outlier scan, coded as “1”). For the task‐based functional connectivity analyses, additional task regressors were added as covariates of no interest (Cole et al., 2014; Hearne et al., 2017), as follows. Separate regressors were added for the encoding and probe onsets, respectively, for each condition (loads 1, 4–8 for older adults/5–9 for younger adults; total 12 regressors), modeled as boxcar functions convolved with a canonical hemodynamic response function (HRF). An additional regressor modeled the maintenance intervals of incorrectly answered trials. The residual fMRI time series were band‐pass filtered (0.01 Hz < f < 0.15 Hz) at a low‐frequency component sensitive to both resting‐state and task‐based functional connectivity (Hearne et al., 2017; Sun, Miller, & D'Esposito, 2004). (See Supplementary Results for a control analysis using high‐pass filtering.)
For the resting‐state data, functional connectivity was estimated using a Pearson correlation between each pair of time series, resulting in a 3 (time points) × 221 × 221 connectivity matrix for each participant. For the task‐based functional connectivity analyses, we employed the regression approach described above to account for variance associated with task‐related coactivation (Cole et al., 2014; Hearne et al., 2017); see Supplementary Results for a control analysis using finite impulse response task regression (Cole et al., 2019). Then, the residual time series from each 7 s maintenance interval (accounting for hemodynamic delay by convolving the boxcar regressor for each maintenance interval with a rectified HRF; Whitfield‐Gabrieli & Nieto‐Castanon, 2012) were concatenated to form condition‐specific time series for each brain region. This enabled us to compare directly connectivity between resting‐state and task modes (Hearne et al., 2017). An HRF‐weighted Pearson correlation was calculated for the resulting regional time series, resulting in a 3 (time points) × 6 (conditions) × 221 × 221 connectivity matrix for each participant. (See Supplementary Results for a control analysis equating resting‐state and WM condition durations.)
Finally, the correlation coefficients were Fisher‐z transformed, and the diagonal of the connectivity matrix was set to zero. Unless stated otherwise (see Pairwise Connectivity Analyses below), we retained only positive connectivity values for further analyses, consistent with prior, related studies (Chan et al., 2014; Cohen & D'Esposito, 2016; Finc et al., 2020; Hearne et al., 2017). Setting negative connectivity values to zero before proportional thresholding (see below) prevents inclusion of negative values in the thresholded matrices. Here, thresholding signed and positive‐only matrices yielded identical results. Negative edge weights are often set to zero when analyzing fMRI connectivity data due to continuing debates regarding their interpretation (see Chai, Castañón, Öngür, & Whitfield‐Gabrieli, 2012; Murphy, Birn, Handwerker, Jones, & Bandettini, 2009; Schölvinck, Maier, Ye, Duyn, & Leopold, 2010). Matrices were then thresholded based on connection density (preserving connection weights), which equates the number of edges across graphs and allows proper comparisons (Garrison, Scheinost, Finn, Shen, & Constable, 2015; van Wijk, Stam, & Daffertshofer, 2010). To ensure that results were not due to any specific threshold, calculations were performed for a range comprising 10–30% of the strongest connections, in 2% increments. Thresholding is generally recommended because inclusion of false‐positive connections is more detrimental to network measure computations than exclusion of false‐negative connections (van den Heuvel et al., 2017; Zalesky et al., 2016). This threshold range satisfied several established criteria for graph connectedness and small‐worldness (see Chong et al., 2019), as follows: (a) the average of number of edges per node was larger than the total number of nodes (Wang et al., 2009), (b) at least 80% of the nodes were fully connected (Bassett et al., 2008), and (c) small‐worldness of the network was >1 (Watts & Strogatz, 1998). (See Supplementary Results for details.) In addition, this threshold range has been shown to provide robust functional brain‐network characterizations (Garrison et al., 2015) and is similar to that used in previous work assessing connectivity reconfigurations as a function of task demands (e.g., Cohen & D'Esposito, 2016; Cole et al., 2014; Hearne et al., 2017), thus enabling comparison of the results. Graph construction and analyses were performed using tools from the Brain Connectivity Toolbox (BCT; Rubinov & Sporns, 2010).
2.6. Analysis overview
We assessed age differences in functional network reorganization with WM training at three levels of progressively increased granularity. First, at the whole‐brain level, we derived community partitions for resting‐state and each task condition, separately at each time point, and assessed network modularity. Task‐exposure effects were identified by comparing the two‐time points preceding training (i.e., Time1 vs. Time2), whereas training effects were identified by comparing pre‐training versus post‐training (i.e., Time2 vs. Time3). Then, significant training effects at the whole‐brain level were followed‐up at the individual‐network level, separately within each group. Here, we focused on measures of within‐ and between‐network communication, specifically global efficiency and the participation coefficient. To avoid circularity, node‐module assignments independently derived at Time1 were used for pre‐training versus post‐training comparisons (Time2 vs. Time3). Finally, we examined training effects at the level of pairwise relations between brain regions, using network‐based statistics (NBS; Zalesky et al., 2010).
2.6.1. Whole‐brain network analyses
Modularity calculations
To assess the strength of network segregation at the whole‐brain level, we employed the Louvain algorithm (Blondel, Guillaume, Lambiotte, & Lefebvre, 2008). The algorithm optimizes a modularity quality function (Q) comparing the observed intra‐module connectivity with that which would be expected by chance (Newman, 2006; Newman & Girvan, 2004). Higher modularity values indicate more segregation whereas lower modularity values indicate less segregation between modules or subnetworks. The modularity index is formally defined as follows:
where E is the number of graph edges, A is the adjacency matrix, γ is the resolution parameter, e is the null model [here, e = k i k j/2E, where k i and k j are the degrees of the nodes i and j], and δ is an indicator that equals 1 if nodes i and j belong to the same module and 0 otherwise. Because the Louvain algorithm is non‐deterministic, modularity was calculated as the average over 1,000 runs of the algorithm. In addition, because differences in total connectivity strength between groups may influence the results, modularity scores for each participant and condition were normalized by dividing them by the average modularity of a null distribution, calculated by randomly rewiring each original network 1,000 times (Maslov & Sneppen, 2002). This approach has been previously validated in the context of working memory training (Finc et al., 2020), thus enabling comparison of the results. Of note, age differences in mean connectivity did not occur during resting state, but were driven by within‐group differential responses to changing task demands and were modulated by training (see Supplementary Results). Because such differences cannot be simply attributed to physiological noise, regression of mean connectivity was not applied (for a discussion, see Geerligs et al., 2017). (See Supplementary Results for a control analysis using regression of mean connectivity.)
We ran the Louvain algorithm over a range of the resolution parameter gamma (γ) from 1 to 2 in increments of 0.1, based on previous evidence (Hughes, Faskowitz, Cassidy, Sporns, & Krendl, 2020) that gamma values in this range are adequate for comparing community structure in younger and older adults. Robustness analyses showed overall consistent results over this gamma range (see Supplementary Results and Table S1). For subsequent analyses, the resolution parameter was set to γ = 1.3, a value that generated resting‐state community structures with the following properties: (a) high similarity with the Power et al. (2011) canonical networks, (b) comparable number of detected networks for younger and older adults, and (c) low number of singletons (i.e., nodes with unclear network affiliation; for details, see Supplementary Results). Of note, this gamma value is similar to those employed by other related investigations (e.g., Cohen & D'Esposito, 2016; Iordan et al., 2018), allowing comparison of the results. In addition, we replicated the results using a different parcellation, by Schaefer et al. (2018) (see Supplementary Results and Figure S1).
Modularity scores for each participant, condition, and time point were exported to SPSS (IBM Corporation, Armonk, NY) and analyzed within the ANOVA framework. A Greenhouse–Geisser correction for violation of sphericity was applied as needed, for all ANOVA models. Effect sizes are reported as partial eta squared (η p 2). First, we focused on the switch between resting‐state and task mode (i.e., load of 1) and examined effects on modularity across all three time points, using a Group × Time × Mode mixed‐effects ANOVA. Then, we focused on the WM loads common to both groups (i.e., loads 5–8) and examined the effects on modularity across all three time points using a Group × Time × Load mixed‐effects ANOVA. Significant effects of Load were followed‐up with linear trend analyses, whereas significant effects of Time were followed‐up by separately assessing task‐exposure (Time1 vs. Time2) and training effects (i.e., Time2 vs. Time3) between and within groups. Of note, between‐group comparisons were performed using Group × Time × Load ANOVAs across WM loads common to both groups (i.e., loads 5–8), whereas within‐group comparisons were performed using Time × Load ANOVAs across group‐specific loads (i.e., loads 4–8 for older and loads 5–9 for younger adults). Matching on load provided us with a set of reliable parameters for analyzing WM performance across the different time points. Specifically, whereas nominal load was fixed over time, the difficulty associated with a specific load was assumed to vary, that is, decrease with training.
Individual and group‐level consensus partitions
To achieve a community structure representative of each group, for every experimental condition, we used consensus clustering (Lancichinetti & Fortunato, 2012). This capitalizes on the consistency of each node's module affiliation across a set of partitions, thus circumventing the known degeneracy of the Louvain algorithm (Good, de Montjoye, & Clauset, 2010). To account for potential differences in network configuration due to age or experimental condition, we used a “purely” data‐driven approach (i.e., no node‐community affiliation priors were employed). Consensus clustering was applied first at the individual level, to generate a robust partition for each participant, and then at the group level, to generate a representative partition for each group. First, to generate a robust partition for each participant, the Louvain algorithm was run 1,000 times. For each participant, we constructed an agreement matrix representing the fraction of runs in which each pair of nodes was assigned to the same module. The Louvain algorithm was then iteratively run on the agreement matrix (1,000 Louvain runs at each step), to generate a consensus partition for each participant. For each iteration, the agreement matrix was recalculated and thresholded, until a single representative partition was obtained for each participant. Second, to generate a group‐level representative partition, an agreement matrix was calculated based on the consensus partitions of all participants in one group. The Louvain algorithm was then run on the agreement matrix to obtain a consensus partition for each group, as described above. The thresholding parameter for the agreement matrix was set to τ = 0.4, a value similar to those used in other investigations (e.g., Cohen & D'Esposito, 2016; Iordan et al., 2018); a range of commonly employed values, τ = [0.3, 0.4, 0.5] (Lancichinetti & Fortunato, 2012), yielded broadly similar results (see Supplementary Results).
To assess between‐ and within‐subject differences in community structure across rest/task conditions and time points (i.e., network reconfiguration), we calculated variation of information (VIn), which is a metric of the distance between two partitions (Meilă, 2007). Low VIn values indicate greater similarity, whereas high VIn values indicate less similarity between the two partitions. Similar to the approach employed for the modularity analyses presented above, first we assessed between‐groups differences in network reconfiguration from resting‐state to task mode. Specifically, we calculated VIn between each participant's resting‐state and task mode (i.e., load of 1) partitions, separately for each time point, and then examined between‐group differences in VIn across all three time points, using a Group × Time mixed‐effects ANOVA; for a similar approach, see Gallen, Turner, et al. (2016). Second, we assessed within‐group differences in network reconfiguration across WM loads and time, separately for older and younger adults. We used a repeated‐measures permutation procedure to compare the observed variation of information with null models, similar to procedures previously employed by Dwyer et al. (2014) and Hearne et al. (2017). Specifically, for each contrast of interest, half of the participants’ condition labels were randomly switched, resulting in two new sets of individual‐level module structures. Then, these shuffled module structures were run through the previously described partitioning pipeline, to generate randomized group‐level module partitions. For computational efficiency, we iteratively ran the Louvain algorithm on the agreement matrix 100 times at each step. Finally, the difference between these partitions was calculated using VIn. To build a null distribution, the procedure was repeated 1,000 times for each contrast of interest, and statistical significance was ascribed by comparing the actual data with the null distribution.
2.6.2. Network‐level analyses
Training effects at the whole‐brain level were followed‐up at the individual‐network level, separately within each group. We specifically targeted the frontoparietal and default‐mode modules due to these networks' sensitivity to both aging and training effects (Salmi, Nyberg, & Laine, 2018; Spreng et al., 2010). To avoid circularity, node‐module assignments independently derived at Time1 were used for pre‐ vs. post‐training comparisons (Time2 vs. Time3); see Iordan et al. (2020) for a similar approach. Furthermore, to enable comparability across conditions, each module was represented only by those nodes that were consistently assigned to the same module, across all loads (i.e., logical “AND” conjunction of affiliations across all loads), based on the Time1 group‐level consensus partitions (Geerligs et al., 2015; Iordan et al., 2018). We focused on two commonly used network measures indexing within‐network and between‐network communication, namely global efficiency and the participation coefficient. Training effects on these network measures were tested using Time × Load ANOVAs performed separately, within each group, for each targeted brain network.
Global efficiency
To assess within‐network communication, we calculated global efficiency within each module. Global efficiency (Latora & Marchiori, 2003) is formally defined as follows:
where N is the number of nodes in the graph and L ij is the shortest path length between nodes i and j. At the level of functional brain networks, global efficiency is thought to index the capacity for parallel information transfer and integrated processing among all components part of a network (Achard & Bullmore, 2007; Rubinov & Sporns, 2010). Here, we used global efficiency to examine training effects on network communication within modules, based on previous evidence linking high global brain‐network efficiency with enhanced cognitive performance (e.g., Bassett et al., 2009; Meunier, Stamatakis, & Tyler, 2014; Shine et al., 2016; van den Heuvel et al., 2009). Global efficiency was separately calculated for each individual network by creating a sub‐graph containing only the nodes part of that specific network.
Participation coefficient
To assess between‐network communication, we calculated the participation coefficient for each module. The participation coefficient (Guimerà & Amaral, 2005) indexes inter‐network connectivity by quantifying the distribution of each node's connections across different modules. The participation coefficient of a node i is defined as follows:
where M is the number of modules in the graph, and k i(m) is the degree of node i within its own module m, and k i is the degree of node i regardless of module membership. Participation coefficients of all nodes within a module were averaged to provide an estimate of mean participation for a module.
2.6.3. Pairwise connectivity analysis
To identify training effects at a sub‐network level, we employed the network‐based statistic approach (Zalesky et al., 2010), a procedure that tests for differences in pairwise connectivity between brain regions while controlling for family‐wise error (FWE) at the network level. Using a general linear model, we tested for differences due to training and load, separately within each group. For simplicity of interpretation, we limited these analyses to the lowest versus highest loads within each group (i.e., loads 4 vs. 8 for older adults, and loads 5 vs. 9 for younger adults). We ran the following contrasts: Time3 > Time2, to identify increased connectivity with training; Time2 > Time3, to identify decreased connectivity with training; High Load > Low Load, to identify increased connectivity with load; Low Load > High Load, to identify decreased connectivity with load. Analyses were performed on unthresholded functional connectivity matrices (positive and negative values) and links between any two regions were independently tested against the null hypothesis using paired t tests. The threshold was set to p < .002 (one‐tailed) within each group, a value that enabled detection of medium‐sized network components while eliminating small and/or spurious effects; see, for example, Finc et al. (2017) and Hearne et al. (2017) for a similar approach. Robustness analysis for a range of thresholds, .001 < p < .005, yielded broadly similar results (see Supplementary Results and Tables S2 and S3). Permutation tests (5,000 permutations) were employed to calculate p values for the detected components and only components that survived p < .05, FWE‐corrected at the whole‐network level, were reported. This analysis allowed identification of training effects at the level of network components and thus provided results complementary to the graph analyses described above.
3. RESULTS
3.1. Behavioral analyses
Behavioral results showed that WM performance improved with training for both groups, and were presented elsewhere (Iordan et al., 2020). Briefly, effects of task‐exposure and training on WM performance were examined with loads 5–8, which were common to both groups, using Group × Time × Load ANOVAs on WM accuracy scores. The main effect of Load was significant at p < .001 for all ANOVA models. First, the task‐exposure analysis (Time1 vs. Time2) showed that, while younger adults performed overall better than older adults (Group: F 1,40 = 5.91, p = .02, η p 2 = 0.13), this group difference was reduced with task exposure (Group × Time: F 1,40 = 6.17, p = .017, η p 2 = 0.13). The main effect of Time was not significant (F 1,40 = 0.26, p = .611, η p 2 = 0.01). Second, analysis of training effects (Time2 vs. Time3) showed that performance improved with training for both groups (Time: F 1,40 = 13.04, p = .001, η p 2 = 0.25). The main effect of Group was not significant (Group: F 1,40 = 2.34, p = .134, η p 2 = 0.06). Similar results were obtained when including only participants who had complete fMRI data. Specifically, the task‐exposure analysis showed that younger adults performed overall better than older adults (Group: F 1,36 = 5.5, p = .025, η p 2 = 0.13) and that this group difference was reduced with task exposure (Group × Time: F 1,36 = 4.5, p = .041, η p 2 = 0.11), whereas analysis of training effects similarly showed that performance improved with training for both groups (Time: F 1,36 = 10.57, p = .003, η p 2 = 0.23).
Here, we assessed age differences in functional network reorganization with WM training at three levels. First, we examined task‐exposure and training effects on brain‐wide modularity and community structure. Then, we examined training effects at the level of individual brain networks, focusing on within‐ and between‐network communication, and using the network metrics of global efficiency and participation coefficient. Finally, we examined training effects at the level of pairwise relations between brain regions, using network‐based statistics.
3.2. Brain‐wide effects of task‐exposure and training
3.2.1. Exposure and training effects on brain‐wide modularity
Modularity is a measure of network segregation, indexing the extent to which a graph is organized into separable modules with dense connections within and sparse connections between modules. Here, we tested whether age and training influence the decrement in modularity typically observed when (a) switching between resting‐state and task mode and (b) operating under increased task demand. To allow between‐groups comparisons, each modularity score was normalized relative to a null distribution (Section 2). First, we focused on the switch between resting‐state and task mode (i.e., load of 1) and examined the effects on modularity across all three time points (Figure 2a). A Group × Time × Mode ANOVA on estimates of modularity indicated greater overall modularity in younger than older adults (Group: F 1,36 = 31.99, p < .001, η p 2 = 0.47) and greater modularity during resting‐state than task mode (Mode: F 1,36 = 141.51, p < .001, η p 2 = 0.8). In addition, results showed greater decrement in modularity when switching from resting‐state to task mode, in older compared to younger adults (Group × Mode: F 1,36 = 19.14, p < .001, η p 2 = 0.35). No other effects were significant (ps > .17).
FIGURE 2.

Training effects on brain‐wide modularity for older and younger adults. Each line represents an fMRI session. Sessions 1 and 2 (Time1 and Time2) preceded the training intervention, whereas session 3 (Time3) was conducted immediately after training. (a) Effect of switching between resting‐state and task mode (i.e., WM load of 1) on modularity. Although modularity decreased when shifting from rest to task for both groups, older adults showed lower modularity overall and greater decrement with the rest‐to‐task shift. (b) Modularity as a function of WM load (L). Only younger adults showed increased modularity with training. Error bars display standard error of the mean. Abbreviations: OA, older adults; YA, younger adults; WM, working memory
Second, we focused on WM loads common to both groups (i.e., loads 5–8) and examined the effects on modularity across all three time points (Figure 2b). A Group × Time × Load ANOVA on estimates of modularity (loads 5–8) again indicated greater overall modularity in younger than older adults (Group: F 1,36 = 37.38, p < .001, η p 2 = 0.51), as well as a main effect of Load (F 3,108 = 5.89, p = .001, η p 2 = 0.14), qualified by a significant linear trend (F 1,36 = 13.52, p = .001, η p 2 = 0.27), indicating lower modularity with increasing load. Furthermore, a significant Group × Load interaction (F 3,108 = 3.21, p = .026, η p 2 = 0.08) indicated that modularity had a steeper decrease as a function of Load in older compared to younger adults. Finally, there was a significant Group × Time interaction (F 2,72 = 4.64, p = .013, η p 2 = 0.11), which we followed‐up as planned, by separately assessing task‐exposure (Time1 vs. Time2) and training effects (Time2 vs. Time3). Both analyses showed greater modularity in younger compared to older adults (ps < .001) and no main effects of Time (ps > .08). Critically, a significant Group × Time interaction was obtained with training (F 1,36 = 7.97, p = .008, η p 2 = 0.18) but not with task‐exposure (F 1,36 = 1.14, p = .293, η p 2 = 0.03), indicating greater training‐related gains in brain‐wide modularity for younger compared to older adults. Furthermore, analyses of task‐exposure and training effects performed across group‐specific loads (i.e., loads 4–8 in older and loads 5–9 in younger adults), separately within each age group, showed greater modularity with WM training only for younger adults (see Supplementary Results).
Overall, these results suggest that training increases brain‐wide modularity specifically in younger adults. Of note, the results reported here used the brain parcellation by Power et al. (2011). For robustness tests, we performed the same analyses using the Schaefer et al. (2018) parcellation, and obtained similar results (see Supplementary Results and Figure S1). Finally, an ancillary analysis employing a recently proposed measure of network segregation (Chan et al., 2014; Wig, 2017) provided results that were overall consistent with the modularity findings (see Supplementary Results and Figure S2). However, as expected, the effects of training on segregation were relatively less specific when employing the Power et al. (2011) intrinsic (i.e., resting‐state) node‐module affiliations, instead of the data‐driven community structure detected for each individual condition. This suggests that differences in community structure, such as those that occur when shifting from resting‐state to task mode (see below), may bias the segregation, but not the modularity, metric.
3.2.2. Age and rest‐to‐task shift effects on community structure
While the modularity index characterizes the segregation/integration quality of a network partition, it does not inform about its community structure (i.e., composition of the modules). Hence, we also examined the community structure at rest and during task performance, as well as potential effects of task exposure and training on module composition, in older and younger adults. Community detection analyses identified five major modules during resting‐state, for both older and younger adults, which broadly correspond to the visual, sensorimotor, salience/cingulo‐opercular, frontoparietal, and default‐mode networks (Power et al., 2011; Yeo et al., 2011). This is consistent with previous, related studies that used a similar data‐driven approach in older and younger adult samples comparable in size (e.g., Geerligs et al., 2015; Hearne et al., 2017; Vatansever et al., 2015). (See Figure 3 for a depiction of community structure at Time1.) However, switching between resting‐state and task mode (i.e., load of 1) led to a different module configuration, and this was more evident in older adults. Specifically, for older adults, task‐mode was associated with the emergence of a module comprising mainly salience and sensorimotor nodes (i.e., a salience/sensorimotor module), whereas, for younger adults, the reorganization from resting‐state to task mode better preserved the distinction between these two modules. To ascribe statistical significance to observed differences, we calculated the variation of information metric (Meilă, 2007), which indexes the distance between two partitions; in this case, we estimated the distance between each participant's resting‐state and task mode partitions, separately for each time point. A Group × Time mixed‐effects ANOVA on variation of information scores indicated greater rest to task network reconfiguration in older than younger adults (Group: F 1,36 = 75.89, p < .001, η p 2 = 0.68), as well as a Group × Time interaction (F 2,72 = 4.19, p = .019, η p 2 = 0.10). The main effect of Time was not significant (p > .8). Together with the modularity results presented above, these findings indicate greater network reorganization supporting enhanced integration when transitioning from resting‐state to task mode, in older compared to younger adults.
FIGURE 3.

Community structure across conditions for older (a) and younger adults (b). The alluvial diagram illustrates the flow of node‐module affiliations across conditions (RS, resting‐state; L, WM load) at Time1. Each individual streamline represents a node in the network, colored by its original resting‐state affiliation. Labels on the left identify main functional networks at rest, whereas labels on the right identify main functional networks during task performance. Results are shown for 20% network density, but statistics were performed across multiple thresholds (Section 2). Abbreviations: DMN, default‐mode network; FPN, frontoparietal network; FPN/Sal, emerging frontoparietal/salience network in younger adults; Sal, salience network; Sal/SMN, emerging salience‐sensorimotor network in older adults; SMN, sensorimotor network; Vis, visual network; WM, working memory. Figure displayed using Alluvial Generator (http://mapequation.org)
Regarding network reorganization with WM load, the community structure attained by older adults for the task mode was largely preserved with increasing task load (loads 4–8). In contrast, for younger adults, a module emerged with increased WM load (loads 5–9), which conjoined the frontoparietal and salience networks (i.e., a frontoparietal/salience module). Given these descriptive results, we next tested for statistical differences in community structure as a function of Time and Load, separately for older and younger adults. First, permutation tests (Section 2) identified differences in the community structure of resting‐state compared to all WM loads, for both groups (Figure 4a); at the same time, there were no consistent differences in community structure between the different loads (i.e., loads 4–8 in older and loads 5–9 in younger adults). Second, comparing task‐exposure (Time1 vs. Time2) and training effects (Time2 vs. Time3) for each load indicated no significant differences in community structure across time (Figure 4b). Together, these results suggest that community structure varies mainly between resting‐state and task mode, and once the task‐specific configuration is established, increasing WM load or task‐exposure/training do not substantially alter community structure in older or younger adults.
FIGURE 4.

Differences in community structure as a function of time and load. Heat maps reflect variation of information between any two partitions, averaged across network density thresholds (Section 2). (a) Differences in community structure across conditions, for each scanning session (i.e., time point). Only resting‐state (RS) was systematically different from working memory load conditions (L). (b) There were no significant differences in community structure across time for any condition. * p < .05; ** p < .01; *** p < .001. Abbreviations: OA, older adults; YA, younger adults
3.3. Training effects at the network level
The analyses of community structure presented above‐identified similar modules across time and WM loads within each group. Because brain‐wide changes in segregation/integration may be driven by changes in communication within and between specific networks, we next examined training effects at the level of individual networks, in older and younger adults. To analyze training effects on brain networks while avoiding circularity, we used the community structure independently identified at Time1 to compare network properties pre‐training versus post‐training (Time2 vs. Time3). Because graph measures depend on the number of nodes in a graph, each module was represented only by those nodes that were consistently assigned to the same module across loads at Time1 (Geerligs et al., 2015; Iordan et al., 2018; see Figure 5). We targeted two a priori associative networks critical for WM/executive function, that is, the frontoparietal/salience and default‐mode networks. Of note, because the emergence of a salience/sensorimotor module with WM load in older adults was not initially anticipated, analyses pertaining to this module were deemed exploratory. To assess within‐ and between‐network communication, we calculated global efficiency and the participation coefficient for each network.
FIGURE 5.

Group‐level community structure across WM loads, for older (a) and younger adults (b). Anatomical projections identify nodes consistently assigned to modules across loads 4–8 in older adults (a) and loads 5–9 in younger adults (b) at Time1. Nodes are colored depending on their module affiliation. Dark shades identify nodes that were assigned to the same module across all loads (i.e., logical “AND” conjunction of affiliations across all WM loads; Section 2). Light shades identify nodes that were assigned to a module across most loads (i.e., mode of the set of affiliations). Two singletons (i.e., nodes with uncertain module affiliation) for older adults are displayed in gray. Abbreviations: DMN, default‐mode network; FPN, frontoparietal network; FPN/Sal, frontoparietal/salience network; L, left; R, right; Sal/SMN, salience/sensorimotor network; SMN, sensorimotor network; Vis, visual network. Figure displayed using BrainNet Viewer (https://www.nitrc.org/projects/bnv/)
3.3.1. Training effects on network efficiency
For older adults, a Time × Load ANOVA indicated no training effects on global efficiency for the frontoparietal or default‐mode networks (ps > .3); however, there were main effects of Load for both networks (frontoparietal: F 4,68 = 3.64, p = .01, η p 2 = 0.18; default‐mode: F 4,68 = 2.88, p = .029, η p 2 = 0.15), qualified by linear trends (frontoparietal: F 1,17 = 9.59, p = .007, η p 2 = 0.36; default‐mode: F 1,17 = 6.46, p = .021, η p 2 = 0.28), indicating lower efficiency with increasing WM load in both networks. In contrast, training was associated with greater global efficiency within the combined salience/sensorimotor network (Time: F 1,17 = 8.91, p = .008, η p 2 = 0.34; Figure 6a). For younger adults, results showed greater global efficiency with training in the default‐mode network (Time: F 1,19 = 11.11, p = .003, η p 2 = 0.37), whereas the training effect for the frontoparietal/salience network did not reach significance (Time: F 1,19 = 3.53, p = .076, η p 2 = 0.16), although the general direction was increased efficiency with training (Figure 6b).
FIGURE 6.

Training effects on network global efficiency for older (a) and younger adults (b). Older adults showed increased global efficiency within Sal/SMN with training, whereas younger adults showed increased global efficiency within DMN with training. Error bars display standard error of the mean. Abbreviations: DMN, default‐mode network; FPN, frontoparietal network; FPN/Sal, frontoparietal/salience network; OA, older adults; Sal/SMN, salience/sensorimotor network; WM, working memory; YA, younger adults
3.3.2. Training effects on network participation
For older adults, a Time × Load ANOVA indicated no significant effects for the frontoparietal network (ps > .4), whereas for the default‐mode network there was only a main effect of Load (F 4,68 = 11.45, p < .001, η p 2 = 0.4), qualified by a linear trend (F 1,17 = 26.72, p < .001, η p 2 = 0.61), indicating greater default‐mode network participation with increasing load. In addition, there were no significant effects on the salience/sensorimotor module (ps > .2; Figure 7a). In younger adults, results showed lower participation coefficients with training for both the frontoparietal/salience (Time: F 1,19 = 7.74, p = .012, η p 2 = 0.29) and default‐mode networks (Time: F 1,19 = 20.73, p < .001, η p 2 = 0.52), consistent with the general trend of greater network segregation with training (Figure 7b).
FIGURE 7.

Training effects on network participation for older (a) and younger adults (b). Younger adults showed lower participation of FPN and DMN with training. There were no significant training effects for older adults. Error bars display standard error of the mean. Abbreviations: DMN, default‐mode network; FPN, frontoparietal network; FPN/Sal, frontoparietal/salience network; OA, older adults; Sal/SMN, salience/sensorimotor network; YA, younger adults; WM, working memory
3.4. Training effects on pairwise connectivity
To investigate training‐related reconfigurations at a subnetwork level, we further assessed changes in pairwise connectivity between brain regions, separately within each group, using network‐based statistics (Zalesky et al., 2010). For simplicity of interpretation, we included only the lowest and highest WM loads within each group (i.e., loads 4 and 8 in older adults, and loads 5 and 9 in younger adults), and tested for effects of WM training (Time2 vs. Time3) and load (Section 2).
First, regarding effects of training, results showed opposite changes in between‐network connectivity for younger and older adults (Figure 8a). Specifically, training decreased between‐network connectivity, further segregating the default‐mode from the task‐specific frontoparietal/salience and visual networks in younger adults. Results identified a network component comprising 97 nodes and 120 edges (p = .001, FWE‐corrected), with 78% of edges involving the default‐mode network, and out of these, 94% showing decreased connectivity of the default‐mode with the frontoparietal/salience and visual networks. In contrast, training diffusely increased functional connectivity between task‐related brain networks in older adults, with results identifying a network component comprising 52 nodes and 55 edges (p = .045, FWE‐corrected) roughly evenly distributed across the main networks.
FIGURE 8.
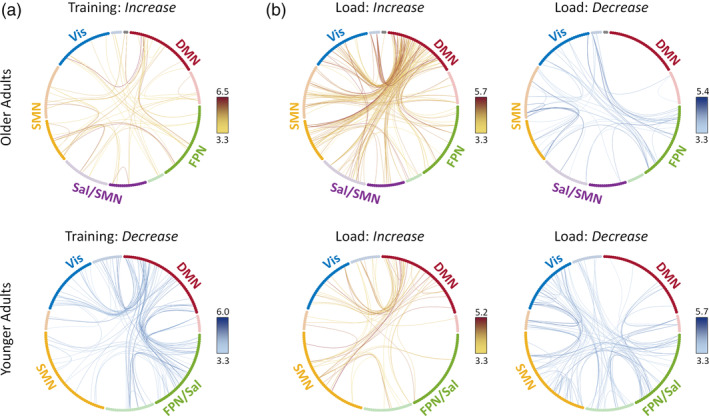
Differences in pairwise connectivity with training (a) and load (b) in older (top) and younger adults (bottom). (a) With training, older adults showed diffusely increased functional connectivity between brain networks, whereas younger adults showed greater decreased connectivity, further segregating DMN from FPN/Sal and Vis networks. (b) Older and younger adults showed similar patterns of increased versus decrease connectivity under high load, although the magnitude of load‐related changes in connectivity differed between age groups. Circular diagrams identify nodes consistently assigned to modules across loads 4–8 in older adults and loads 5–9 in younger adults, at Time1. Nodes are colored depending on their module affiliation. Dark and light shades identify nodes with stable and variable affiliation across WM loads, respectively (see legend of Figure 5 for details). Two singletons (i.e., nodes with uncertain module affiliation) for older adults are displayed in gray. Each line identifies a significantly increasing or decreasing connection between two regions. Lines are color‐coded according to the color bars on the right (t values). Results are displayed at an initial threshold of p = .002 and p < .05, FWE‐corrected at the whole‐network level (Section 2). Abbreviations: DMN, default‐mode network; FPN, frontoparietal network; FPN/Sal, frontoparietal/salience network; Sal/SMN, salience/sensorimotor network; SMN, sensorimotor network; Vis, visual network. Figure displayed using NeuroMArVL (https://immersive.erc.monash.edu/neuromarvl/)
Second, regarding effects of WM load, results showed similar patterns of increased versus decreased connectivity for younger and older adults, although their magnitude differed with age (Figure 8b). Specifically, for older adults, greater WM load strongly increased between‐network connectivity of the default‐mode with other networks. Results identified a network component comprising 112 nodes and 191 edges (p < .001, FWE‐corrected), with 86% of edges involving the default‐mode network and out of these, 89% showing increased connectivity of the default‐mode with the salience/sensorimotor, sensorimotor, and visual networks. By comparison, younger adults showed a relatively weaker response to increased WM load (58 nodes and 64 edges; p = .021, FWE‐corrected). However, younger adults showed a more extensive pattern of decreased connectivity under high versus low WM load (90 nodes and 106 edges; p = .001, FWE‐corrected), with 51% of edges involving the task‐specific frontoparietal/salience network. In contrast, older adults showed relatively less decreased connectivity under high WM load (45 nodes and 52 edges; p = .023, FWE‐corrected).
4. DISCUSSION
The goal of the present study was to assess age differences in the reconfiguration of functional brain networks elicited by training on a demanding WM task. According to the Global Workspace Theory (Dehaene et al., 1998), whereas “lower‐level” (e.g., perceptual, motor) or automated functions can be well supported by the operation of relatively segregated neural modules, “higher‐level” or effortful cognitive processes, such as WM, require a more integrated neuronal workspace. This implies that the performance of demanding cognitive tasks may be critically dependent on the reconfiguration of the functional brain networks from their canonical (i.e., resting) state, and that novice and expert performance of those tasks should differ in respect to this network (re)organization. Given previously reported age differences in network segregation or modularity, we hypothesized that younger and older adults would show different patterns of network reconfiguration with WM training. Our results identified such differences at the level of brain‐wide modularity, at the level of individual network properties, and at the level of pairwise connections between different brain regions. These results are discussed, in turn, below, while emphasizing links between the different levels of analysis.
4.1. Age and training effects on brain‐wide modularity
4.1.1. Lower overall network modularity for older compared to younger adults
First, at the whole‐brain level, our results showed lower network modularity in older compared to younger adults, across both resting‐state and task performance. This finding is in line with an increasing body of evidence indicating a trend toward decreased segregation or modularity with increasing age (reviewed in Damoiseaux, 2017). Although the majority of investigations so far have been based on resting‐state data (Achard & Bullmore, 2007; Betzel et al., 2014; Cao et al., 2014; Chan et al., 2014; Chong et al., 2019; Geerligs et al., 2015; Meunier, Achard, Morcom, & Bullmore, 2009; Onoda & Yamaguchi, 2013; Song et al., 2014; Varangis, Razlighi, Habeck, Fisher, & Stern, 2019), emerging evidence points to lower modularity in older than younger adults also during cognitive task performance (Gallen, Turner, et al., 2016). For instance, using a visual N‐back task, Gallen, Turner, et al. (2016) have shown lower modularity in older than younger adults during WM task performance, suggesting that global age differences in brain network organization are expressed not only during rest but also during cognitive task performance (see also Iordan & Reuter‐Lorenz, 2017). Thus, available functional evidence largely converges on the observation that older adults show generally lower within‐ and higher between‐network connectivity, suggesting decreased segregation and loss of functional specificity of the brain networks with aging (Damoiseaux, 2017; Ferreira & Busatto, 2013; Naik, Banerjee, Bapi, Deco, & Roy, 2017).
4.1.2. Lower modularity with increasing task demand for younger and older adults
Furthermore, the present results showed that modularity decreased when shifting from resting to task mode, as well as with increasing task demands during WM task performance, for both younger and older adults. This is consistent with previous evidence in younger adults, showing lower modularity during cognitive task performance than during resting‐state, as well as lower modularity with increasing task demand (Bola & Sabel, 2015; Braun et al., 2015; Cohen & D'Esposito, 2016; Cole et al., 2014; Finc et al., 2017; Finc et al., 2020; Godwin, Barry, & Marois, 2015; Hearne et al., 2017; Kitzbichler, Henson, Smith, Nathan, & Bullmore, 2011; Lebedev, Nilsson, & Lovden, 2018; Liang, Zou, He, & Yang, 2016; Shine et al., 2016; Vatansever et al., 2015; Westphal, Wang, & Rissman, 2017; Yue et al., 2017). Although relevant studies so far have been based mainly on young adult samples, more recent investigations (Gallen, Turner, et al., 2016; Lebedev et al., 2018) have confirmed this pattern for both young and older adults. These findings complement previous results showing load‐dependent alterations in between‐ and within‐network connectivity in younger and older adults (Grady, Sarraf, Saverino, & Campbell, 2016; Huang, Klein, & Leung, 2016; Nagel et al., 2009; Salami et al., 2018). Thus, available evidence indicates that modularity decreases with increasing cognitive demand and suggests that this reconfiguration is necessary for task performance.
4.1.3. Greater cost for switching from rest to task in older adults
Critically, we report here for the first time that, compared to younger adults, older adults show greater decrement in modularity when switching from rest to task mode. From a network perspective, brains are thought to minimize wiring costs and metabolism by favoring a small‐world structure with dense short‐range connections and sparse long‐range connections, because the latter are more costly (Achard & Bullmore, 2007; Bullmore & Sporns, 2009). The present results suggest that, to switch from resting‐state to task mode, older brains need to expend a higher cost for integrating multiple modules, putatively via long‐range connections. Thus, the present results suggest that aging affects not only network integration and segregation but also the balance between these two neural processes (Damoiseaux, 2017). It should be noted, however, that wiring costs can only be approximated in functional networks, because two functionally connected regions do not necessarily share a direct structural link (Rubinov & Sporns, 2010; Zalesky et al., 2012).
The present results also extend previous evidence in older adults based mainly on binary load manipulations (i.e., low vs. high load) and block designs (e.g., Gallen, Turner, et al., 2016) in two more ways. First, we have demonstrated parametric effects on modularity over a larger range of loads, comprising both span and supra‐span loads (Reuter‐Lorenz & Iordan, 2018). Our results showed an overall steeper decrease in modularity with increasing load in older compared to younger adults, suggesting that the negative linear trend is more evident in older adults. However, this difference was likely driven by network modularity being substantially more responsive to the training intervention in younger compared to older adults, as we elaborate below. Interestingly, though, even with supra‐span loads, modularity did not asymptote but continued to descend in older adults, suggesting that participants remained engaged in the task even at high WM loads (i.e., they did not revert to more rest‐like states). Second, in contrast with the N‐back task, which has a block design, the event‐related format of the Sternberg task is able to differentiate between different phases of a WM trial (i.e., encoding, maintenance, and retrieval). Here, we show that effects reported during N‐back blocks (e.g., Gallen, Turner, et al., 2016) replicate when focusing on the maintenance interval, which is relatively free of sensory and motor demands, enabling us to compare directly connectivity between resting‐state and task modes.
4.1.4. Age differences in the effects of training on modularity
Regarding WM training, our results showed increased modularity post‐relative to pre‐training for younger but not for older adults. Critically, this effect was observed during WM performance under load and was not observed during either resting‐state or task mode (i.e., load of 1), suggesting demand‐related plasticity. Furthermore, the effect was specific to the training intervention and was not observed with simple task exposure. Our findings replicate recent results by Finc et al. (2020) in a sample of young adults. Using a dual N‐back task, in conjunction with adaptive training and multiple fMRI sessions, Finc et al. (2020) identified a gradual increase in modularity with training, suggesting more segregated, and thus less costly, cognitive processing with increasing task automation. Also in line with Finc et al. (2020), we showed that cognitive training leads to increased baseline network segregation, extending their results to a parametric context. Specifically, although segregation increases with training, a certain level of modularity breakdown with increasing load is still preserved, as illustrated by consistent negative trends in modularity with increasing load, both pre‐training and post‐training.
In contrast to the effects of training on modularity in younger adults, we did not observe similar trends in older adults. This suggests that, despite training‐related gains with WM training (see Supplementary Results), information processing per se remains costly for older adults. Taken together, these different effects of training for younger and older adults suggest a potential age‐related dissociation, whereby a mastered cognitive task could be supported by a more segregated network (i.e., via operation of specialized brain modules) for younger adults, but would still require a more integrated workspace for older adults, which is functionally costly and behaviorally effortful (see Finc et al., 2020).
The present results also have further implications for assessing the value of modularity as a biomarker of intervention‐related plasticity in older adults (Gallen & D'Esposito, 2019). Specifically, whereas high pre‐training modularity, particularly during resting‐state, may reflect a more “optimal” functional network organization that promotes cognitive improvements with training (e.g., Gallen, Baniqued, et al., 2016; Iordan et al., 2018), older adults may be less able to increase network segregation with training, as an expression of overall diminishing neural plasticity (Park & Reuter‐Lorenz, 2009; Reuter‐Lorenz & Park, 2014). Another possibility is that modularity may be beneficial for older adults’ cognitive functioning, and local declines in brain function may be compensated by a more integrated workspace. However, correlations between changes in modularity and WM gains with training (during fMRI task performance) were not significant. Alternatively, it is possible that the lack of training effects on modularity in older adults could be related to the relatively short intervention employed (i.e., 10 training days over ~2 weeks). For instance, using a longer WM training intervention (20 sessions over ~4 weeks), Lebedev et al. (2018) have recently reported increased modularity with training in older adults. The increase in older adults’ network segregation may be sensitive to varying the duration and/or intensity of training. Thus, future training studies with longer/more intensive interventions should further clarify whether network modularity can be influenced by cognitive training in older adults. Elucidation of these aspects is critically important for designing future cognitive training interventions to prevent or alleviate age‐related cognitive decline.
A main goal of the present investigation was to compare the community structure between age groups and across different network states/configurations (i.e., “resting‐state,” “task‐mode,” and “increased task demand”). Therefore, we adopted a data‐driven approach where the community structure was independently calculated for each experimental condition. This was achieved by optimizing a modularity quality function (i.e., Q; Section 2), which also provided the estimate of network segregation (i.e., higher/lower modularity values indicate more/less segregation). A similar estimate can be provided by a recently proposed measure (i.e., “segregation”; Chan et al., 2014; Wig, 2017) which simply calculates the difference in within‐ versus between‐network connectivity, relative to within‐network connectivity, given a predetermined community structure. However, using a predetermined community structure (e.g., the Power et al. canonical networks, which were derived based on young adult and resting‐state data) would not have been ideal because here we show that (a) community structure differs between younger and older adults and (b) community structure changes between rest and task mode (see also Geerligs et al., 2015; Hearne et al., 2017). Indeed, we show in the Supplementary Results that segregation analyses using the Power et al. canonical networks yield less specific training effects, whereas segregation analyses using data‐driven communities based on modularity maximization yield training effects consistent with the modularity findings. We posit that modularity is the preferred metric for comparing brain network integration/segregation balance across distinct states, particularly when differences in community structure between states might occur. Together with the converging results using a different parcellation scheme (Schaefer et al., 2018; see Supplementary Results), these findings demonstrate that the present results hold across different measures of network segregation/integration, as well as across different brain parcellations.
4.2. Age effects on rest‐to‐task reconfiguration
Regarding topological changes in network configuration, we identified distinct patterns of rest‐to‐task network reorganization in younger and older adults, as well as preserved within‐groups modular architecture with increasing demand and training. First, for younger adults, increasing WM load led to the emergence of a conjoined frontoparietal/salience module. This is consistent with evidence for an “executive meta‐system” formed via enhanced communication between frontoparietal and salience/cingulo‐opercular regions under high‐demand task conditions (Cocchi, Zalesky, Fornito, & Mattingley, 2013). Specifically, whereas the frontoparietal network, anchored in the dorsolateral PFC and lateral parietal cortex, has been implicated in phasic aspects of cognitive control (e.g., moment‐to‐moment adjustments of behavior) the salience/cingulo‐opercular network, anchored in the dorsal ACC and frontal operculum/anterior insula, has been implicated in stable set‐maintenance and multimodal sensory integration (Bressler & Menon, 2010; Dosenbach et al., 2006; Dosenbach et al., 2007; Dosenbach, Fair, Cohen, Schlaggar, & Petersen, 2008; Menon, 2011; Power & Petersen, 2013; Seeley et al., 2007). Thus, the present findings are in line with accumulating evidence that functional connectivity within this executive meta‐system is dynamic and depends on task processing demands (Cocchi et al., 2013; Liang et al., 2016).
In contrast, for older adults, switching from rest to task mode led to the emergence of a salience/sensorimotor module, formed by enhanced communication between cortical and subcortical components of the salience/cingulo‐opercular and sensorimotor networks identified during rest. Sensorimotor reconfiguration during WM task performance is consistent with evidence showing that parts of the motor system are implicated in (internal) information processing that parallels (external) object manipulation (here, covert rehearsal of the memory set), and may play a role in WM gains with training (for a recent discussion, see Simmonite & Polk, 2019). While not initially anticipated during task performance, these findings are in line with recent evidence showing greater participation coefficients at rest for older than younger adults (Geerligs et al., 2015; Iordan et al., 2018), probably reflecting age‐related dedifferentiation of the salience and sensorimotor networks (Cassady et al., 2019, 2020; Corte et al., 2016; He et al., 2014; Meier et al., 2012; Onoda, Ishihara, & Yamaguchi, 2012).
The present results showing steeper modularity decline, greater network reorganization, and higher number of subnetworks when switching from rest to task, for older compared to younger adults, are consistent with recent evidence showing that older adults' network organization is more diffuse (i.e., less distinct) during task than during rest (Hughes et al., 2020). Together with the results of the network segregation analysis (see Supplementary Results), these findings provide converging evidence that older adults show a disproportionately weaker network configuration during task. Specifically, older adults show not only lower overall segregation across both rest and task, but also steeper segregation decrement with shifting from rest to task mode, compared to younger adults. Thus, although the task‐related community structure for older adults may comprise more modules than for younger adults, overall segregation is weaker in older adults, consistent with the modularity results (see also Hughes et al., 2020).
4.3. Training effects at the network level
Our results also showed that, once the resting‐state networks achieve the configuration characteristic of task performance, further changes in connectivity with increased WM load or training do not significantly alter this task‐related modular structure (see also Hearne et al., 2017). Nevertheless, we identified changes with increasing WM load and training at the level of individual brain networks, and for younger adults, these paralleled the changes in whole‐brain modularity discussed above, which further highlights the links across the two different levels of analysis. First, younger adults showed both increased default‐mode network efficiency and decreased default‐mode and frontoparietal/salience network participation with training. These results suggest that enhanced modularity with training in younger adults may be driven by (a) strengthening of information exchange within the default‐mode network and (b) further segregation of the frontoparietal/salience and default‐mode networks from other functional brain modules. This is not surprising, given that the frontoparietal and default‐mode networks are frequently described as being anti‐correlated (Fox et al., 2005) and their competitive relationship is thought to be important for attention‐demanding task performance (e.g., Kelly, Uddin, Biswal, Castellanos, & Milham, 2008). Furthermore, these findings are in line with recent evidence that segregation of the default‐mode and frontoparietal systems supports WM task performance improvements in younger adults (Finc et al., 2020).
In contrast, older adults showed increased efficiency only within the task‐related salience/sensorimotor network with training. Of note, the identification of the salience/sensorimotor module, emergent only during task performance, was independent of the analysis of training effects. Specifically, identification of network (re)configuration with increasing task demand was performed based on Time1 data, whereas the analysis of training effects compared Time2 versus Time3 data. For this reason, we interpret the present training results as providing converging evidence that network reorganization leading to the emergence of this module under increasing task demand supports WM performance in older adults. However, because the emergence of the salience/sensorimotor module was not considered a priori, these findings should be interpreted with caution. Finally, regarding the effects of WM load, older adults also showed lower efficiency in the frontoparietal and default mode networks, as well as greater participation of the default‐mode network, with increasing WM load. This suggests that load effects on within‐ and between‐network communication involving the frontoparietal and default‐mode networks likely drive the load effects on brain‐wide modularity in older adults discussed above.
4.4. Training effects on pairwise connectivity
Finally, pairwise connectivity analyses identified group‐specific subnetworks whose connectivity patterns changed with training and high demand, suggesting that the global and network‐level changes discussed above are supported by both increases and decreases in functional connectivity, which span multiple brain networks. First, regarding WM training, results showed opposite changes in between‐network connectivity for younger and older adults. Specifically, while training decreased between‐network connectivity in younger adults, amplifying segregation of the default‐mode from other networks, it diffusely increased between‐network connectivity in older adults. These results suggest that increased network segregation with training is more specific to younger adults, consistent with more automated processing with enhanced expertise (Finc et al., 2020). In contrast, older adults seem to persist in, and potentially amplify, a more integrated and costly global workspace. This suggests that, despite training‐related performance gains regardless of age, younger and older adults may exhibit different trajectories in functional network reorganization with WM training. Future investigations, comprising lengthier, more extensive training interventions are needed to clarify whether this is a specific pattern or whether older adults eventually show increased modularity with training (cf. Lebedev et al., 2018).
Second, while the response to high vs. low WM load showed similarities across age, the magnitude of effects differed between younger and older adults. Specifically, while younger adults showed greater decreases in connectivity between the task‐specific frontoparietal/salience and sensory networks under high load, older adults showed greater increases in connectivity between default‐mode and sensory networks. These age differences at a sub‐network level are consistent with the brain‐wide results showing overall steeper drop in modularity with increasing load in older adults, and with the network‐level results indicating decreased efficiency and increased participation of the default‐mode network with higher WM load in older adults. Together, they suggest that decreased segregation of the default‐mode with increasing demand may be a hallmark of functional dysregulation in older adults during cognitive task performance (e.g., Sambataro et al., 2010).
Finally, while we acknowledge the integration between different levels of analysis (i.e., brain‐wide community structure, individual networks, pairwise connections), we also recognize that there are important distinctions between these levels, and thus they are not simply reducible to one‐another (for a similar perspective, see Hearne et al., 2017). For instance, first, we show that community structure differs with age and changes with switching from rest to task. That is, no single community structure explains these different contexts/states, which are characterized by large differences in connectivity patterns. Second, once the resting‐state networks reconfigure to their task‐specific state, changes with WM load and with training occur within specific networks, without substantially altering the gross task‐related community structure.
5. CONCLUSION
In sum, we provide novel evidence for age differences in functional network reconfiguration with increasing task demand and WM training. Modularity is a fundamental property of brain network organization, thought to support the brain's functional segregation and integration. While modularity generally decreases with aging, it has been linked with better training outcomes and shown to be responsive to cognitive training. Our results showed that, while modularity decreases with greater task demand regardless of age, older adults are more sensitive to increasing demand and less sensitive to training, at least with the relatively low number of training sessions used here, compared to younger adults. Furthermore, changes in modularity were accompanied by age differences in functional network reconfiguration with training. In particular, whereas younger adults showed increased segregation of the frontoparietal/salience and default‐mode networks, accompanied by increased efficiency within the default‐mode network, older adults showed increased efficiency within a task‐related salience/sensorimotor network and diffusely increased between‐network connectivity, with WM training. The present findings advance our understanding of the effects of aging and training on large‐scale functional organization and provide evidence for different trajectories of functional network reconfiguration with WM training in younger and older adults.
CONFLICT OF INTEREST
Martin Buschkuehl is employed at the MIND Research Institute, whose interest is related to this work. None of the other authors declares any competing interests.
AUTHOR CONTRIBUTIONS
Patricia A. Reuter‐Lorenz, John Jonides, Thad A. Polk, Martin Buschkuehl, Susanne M. Jaeggi, Benjamin Katz, Katherine A. Cooke, Kyle D. Moored, and Scott J. Peltier designed the study. Katherine A. Cooke and Kyle D. Moored collected the behavioral and brain imaging data. Alexandru D. Iordan analyzed the brain imaging data and wrote the original draft. All authors reviewed and edited the final manuscript.
ETHICS STATEMENT
The University of Michigan Institutional Review Board approved all procedures, and all participants provided informed consent prior to participating.
Supporting information
Appendix S1 Supporting information.
ACKNOWLEDGMENTS
This research was supported by a National Institute on Aging grant to P.A.R.‐L [R21‐AG‐045460]. Alexandru D. Iordan was supported by the Michigan Institute for Clinical and Health Research [KL2 TR 002241, PI Ellingrod; UL1 TR 002240, PI Mashour]. Neuroimaging took place at the Functional MRI Laboratory of the University of Michigan, which is supported by and a National Institutes of Health grant [1S10OD012240‐01A1, PI Noll]. The authors thank Krisanne Litinas for assistance with MRI data reconstruction.
Iordan AD, Moored KD, Katz B, et al. Age differences in functional network reconfiguration with working memory training. Hum Brain Mapp. 2021;42:1888–1909. 10.1002/hbm.25337
Funding information National Center for Advancing Translational Sciences, Grant/Award Numbers: KL2 TR 002241, UL1 TR 002240; National Institute on Aging, Grant/Award Number: R21‐AG‐045460; NIH Office of the Director, Grant/Award Number: 1S10OD012240‐01A1
DATA AVAILABILITY STATEMENT
The MRI and behavioral data that were used in this study are available to researchers from the corresponding author upon request.
REFERENCES
- Achard, S. , & Bullmore, E. (2007). Efficiency and cost of economical brain functional networks. PLoS Computational Biology, 3(2), e17. 10.1371/journal.pcbi.0030017 [DOI] [PMC free article] [PubMed] [Google Scholar]
- Alakorkko, T. , Saarimaki, H. , Glerean, E. , Saramaki, J. , & Korhonen, O. (2017). Effects of spatial smoothing on functional brain networks. The European Journal of Neuroscience, 46, 2471–2480. 10.1111/ejn.13717 [DOI] [PMC free article] [PubMed] [Google Scholar]
- Ashburner, J. (2007). A fast diffeomorphic image registration algorithm. NeuroImage, 38(1), 95–113. 10.1016/j.neuroimage.2007.07.007 [DOI] [PubMed] [Google Scholar]
- Bassett, D. S. , Bullmore, E. , Verchinski, B. A. , Mattay, V. S. , Weinberger, D. R. , & Meyer‐Lindenberg, A. (2008). Hierarchical organization of human cortical networks in health and schizophrenia. The Journal of Neuroscience, 28(37), 9239–9248. 10.1523/jneurosci.1929-08.2008 [DOI] [PMC free article] [PubMed] [Google Scholar]
- Bassett, D. S. , Bullmore, E. T. , Meyer‐Lindenberg, A. , Apud, J. A. , Weinberger, D. R. , & Coppola, R. (2009). Cognitive fitness of cost‐efficient brain functional networks. Proceedings of the National Academy of Sciences of the United States of America, 106(28), 11747–11752. 10.1073/pnas.0903641106 [DOI] [PMC free article] [PubMed] [Google Scholar]
- Behzadi, Y. , Restom, K. , Liau, J. , & Liu, T. T. (2007). A component based noise correction method (CompCor) for BOLD and perfusion based fMRI. NeuroImage, 37(1), 90–101. 10.1016/j.neuroimage.2007.04.042 [DOI] [PMC free article] [PubMed] [Google Scholar]
- Betzel, R. F. , Byrge, L. , He, Y. , Goñi, J. , Zuo, X.‐N. , & Sporns, O. (2014). Changes in structural and functional connectivity among resting‐state networks across the human lifespan. NeuroImage, 102, 345–357. 10.1016/j.neuroimage.2014.07.067 [DOI] [PubMed] [Google Scholar]
- Blondel, V. D. , Guillaume, J.‐L. , Lambiotte, R. , & Lefebvre, E. (2008). Fast unfolding of communities in large networks. Journal of Statistical Mechanics: Theory and Experiment, 2008(10), P10008. 10.1088/1742-5468/2008/10/p10008 [DOI] [Google Scholar]
- Bola, M. , & Sabel, B. A. (2015). Dynamic reorganization of brain functional networks during cognition. NeuroImage, 114, 398–413. 10.1016/j.neuroimage.2015.03.057 [DOI] [PubMed] [Google Scholar]
- Braun, U. , Schäfer, A. , Walter, H. , Erk, S. , Romanczuk‐Seiferth, N. , Haddad, L. , … Bassett, D. S. (2015). Dynamic reconfiguration of frontal brain networks during executive cognition in humans. Proceedings of the National Academy of Sciences, 112(37), 11678–11683. 10.1073/pnas.1422487112 [DOI] [PMC free article] [PubMed] [Google Scholar]
- Bressler, S. L. , & Menon, V. (2010). Large‐scale brain networks in cognition: Emerging methods and principles. Trends in Cognitive Sciences, 14(6), 277–290. 10.1016/j.tics.2010.04.004 [DOI] [PubMed] [Google Scholar]
- Bullmore, E. , & Sporns, O. (2009). Complex brain networks: Graph theoretical analysis of structural and functional systems. Nature Reviews Neuroscience, 10(3), 186–198. 10.1038/nrn2575 [DOI] [PubMed] [Google Scholar]
- Cao, H. , Plichta, M. M. , Schäfer, A. , Haddad, L. , Grimm, O. , Schneider, M. , … Tost, H. (2014). Test–retest reliability of fMRI‐based graph theoretical properties during working memory, emotion processing, and resting state. NeuroImage, 84, 888–900. 10.1016/j.neuroimage.2013.09.013 [DOI] [PubMed] [Google Scholar]
- Cao, M. , Wang, J.‐H. , Dai, Z.‐J. , Cao, X.‐Y. , Jiang, L.‐L. , Fan, F.‐M. , … He, Y. (2014). Topological organization of the human brain functional connectome across the lifespan. Developmental Cognitive Neuroscience, 7, 76–93. 10.1016/j.dcn.2013.11.004 [DOI] [PMC free article] [PubMed] [Google Scholar]
- Cappell, K. A. , Gmeindl, L. , & Reuter‐Lorenz, P. A. (2010). Age differences in prefontal recruitment during verbal working memory maintenance depend on memory load. Cortex, 46(4), 462–473. 10.1016/j.cortex.2009.11.009 [DOI] [PMC free article] [PubMed] [Google Scholar]
- Cassady, K. , Gagnon, H. , Freiburger, E. , Lalwani, P. , Simmonite, M. , Park, D. C. , … Polk, T. A. (2020). Network segregation varies with neural distinctiveness in sensorimotor cortex. NeuroImage, 212, 116663. 10.1016/j.neuroimage.2020.116663 [DOI] [PMC free article] [PubMed] [Google Scholar]
- Cassady, K. , Gagnon, H. , Lalwani, P. , Simmonite, M. , Foerster, B. , Park, D. , … Polk, T. A. (2019). Sensorimotor network segregation declines with age and is linked to GABA and to sensorimotor performance. NeuroImage, 186, 234–244. 10.1016/j.neuroimage.2018.11.008 [DOI] [PMC free article] [PubMed] [Google Scholar]
- Chai, X. J. , Castanon, A. N. , Ongur, D. , & Whitfield‐Gabrieli, S. (2012). Anticorrelations in resting state networks without global signal regression. NeuroImage, 59(2), 1420–1428. 10.1016/j.neuroimage.2011.08.048 [DOI] [PMC free article] [PubMed] [Google Scholar]
- Chan, M. Y. , Park, D. C. , Savalia, N. K. , Petersen, S. E. , & Wig, G. S. (2014). Decreased segregation of brain systems across the healthy adult lifespan. Proceedings of the National Academy of Sciences of the United States of America, 111(46), E4997–E5006. 10.1073/pnas.1415122111 [DOI] [PMC free article] [PubMed] [Google Scholar]
- Chong, J. S. X. , Ng, K. K. , Tandi, J. , Wang, C. , Poh, J.‐H. , Lo, J. C. , … Zhou, J. H. (2019). Longitudinal changes in the cerebral cortex functional Organization of Healthy Elderly. The Journal of Neuroscience, 39(28), 5534–5550. 10.1523/JNEUROSCI.1451-18.2019 [DOI] [PMC free article] [PubMed] [Google Scholar]
- Cocchi, L. , Zalesky, A. , Fornito, A. , & Mattingley, J. B. (2013). Dynamic cooperation and competition between brain systems during cognitive control. Trends in Cognitive Sciences, 17(10), 493–501. 10.1016/j.tics.2013.08.006 [DOI] [PubMed] [Google Scholar]
- Cohen, J. R. , & D'Esposito, M. (2016). The segregation and integration of distinct brain networks and their relationship to cognition. Journal of Neuroscience, 36(48), 12083–12094. 10.1523/jneurosci.2965-15.2016 [DOI] [PMC free article] [PubMed] [Google Scholar]
- Cole, M. W. , Ito, T. , Schultz, D. , Mill, R. , Chen, R. , & Cocuzza, C. (2019). Task activations produce spurious but systematic inflation of task functional connectivity estimates. NeuroImage, 189, 1–18. 10.1016/j.neuroimage.2018.12.054 [DOI] [PMC free article] [PubMed] [Google Scholar]
- Cole, M. W. , Reynolds, J. R. , Power, J. D. , Repovs, G. , Anticevic, A. , & Braver, T. S. (2013). Multi‐task connectivity reveals flexible hubs for adaptive task control. Nature Neuroscience, 16(9), 1348–1355. 10.1038/nn.3470 [DOI] [PMC free article] [PubMed] [Google Scholar]
- Cole, M. W. , Bassett, D. S. , Power, J. D. , Braver, T. S. , & Petersen, S. E. (2014). Intrinsic and task‐evoked network architectures of the human brain. Neuron, 83(1), 238–251. 10.1016/j.neuron.2014.05.014 [DOI] [PMC free article] [PubMed] [Google Scholar]
- Corte, V. L. , Sperduti, M. , Malherbe, C. , Vialatte, F. , Lion, S. , Gallarda, T. , … Piolino, P. (2016). Cognitive decline and reorganization of functional connectivity in healthy aging: The pivotal role of the salience network in the prediction of age and cognitive performances. Frontiers in Aging Neuroscience, 8, 204. 10.3389/fnagi.2016.00204 [DOI] [PMC free article] [PubMed] [Google Scholar]
- Crossley, N. A. , Mechelli, A. , Vertes, P. E. , Winton‐Brown, T. T. , Patel, A. X. , Ginestet, C. E. , … Bullmore, E. T. (2013). Cognitive relevance of the community structure of the human brain functional coactivation network. Proceedings of the National Academy of Sciences of the United States of America, 110(28), 11583–11588. 10.1073/pnas.1220826110 [DOI] [PMC free article] [PubMed] [Google Scholar]
- Damoiseaux, J. S. (2017). Effects of aging on functional and structural brain connectivity. NeuroImage, 160, 32–40. 10.1016/j.neuroimage.2017.01.077 [DOI] [PubMed] [Google Scholar]
- Dehaene, S. , Kerszberg, M. , & Changeux, J. P. (1998). A neuronal model of a global workspace in effortful cognitive tasks. Proceedings of the National Academy of Sciences of the United States of America, 95(24), 14529–14534. 10.1073/pnas.95.24.14529 [DOI] [PMC free article] [PubMed] [Google Scholar]
- Dosenbach, N. U. F. , Fair, D. A. , Cohen, A. L. , Schlaggar, B. L. , & Petersen, S. E. (2008). A dual‐networks architecture of top‐down control. Trends in Cognitive Sciences, 12(3), 99–105. 10.1016/j.tics.2008.01.001 [DOI] [PMC free article] [PubMed] [Google Scholar]
- Dosenbach, N. U. F. , Fair, D. A. , Miezin, F. M. , Cohen, A. L. , Wenger, K. K. , Dosenbach, R. A. T. , … Petersen, S. E. (2007). Distinct brain networks for adaptive and stable task control in humans. Proceedings of the National Academy of Sciences of the United States of America, 104(26), 11073–11078. 10.1073/pnas.0704320104 [DOI] [PMC free article] [PubMed] [Google Scholar]
- Dosenbach, N. U. F. , Visscher, K. M. , Palmer, E. D. , Miezin, F. M. , Wenger, K. K. , Kang, H. C. , … Petersen, S. E. (2006). A core system for the implementation of task sets. Neuron, 50(5), 799–812. 10.1016/j.neuron.2006.04.031 [DOI] [PMC free article] [PubMed] [Google Scholar]
- Dwyer, D. B. , Harrison, B. J. , Yucel, M. , Whittle, S. , Zalesky, A. , Pantelis, C. , … Fornito, A. (2014). Large‐scale brain network dynamics supporting adolescent cognitive control. The Journal of Neuroscience, 34(42), 14096–14107. 10.1523/jneurosci.1634-14.2014 [DOI] [PMC free article] [PubMed] [Google Scholar]
- Ferreira, L. K. , & Busatto, G. F. (2013). Resting‐state functional connectivity in normal brain aging. Neuroscience & Biobehavioral Reviews, 37(3), 384–400. 10.1016/j.neubiorev.2013.01.017 [DOI] [PubMed] [Google Scholar]
- Finc, K. , Bonna, K. , He, X. , Lydon‐Staley, D. M. , Kühn, S. , Duch, W. , & Bassett, D. S. (2020). Dynamic reconfiguration of functional brain networks during working memory training. Nature Communications, 11(1), 2435. 10.1038/s41467-020-15631-z [DOI] [PMC free article] [PubMed] [Google Scholar]
- Finc, K. , Bonna, K. , Lewandowska, M. , Wolak, T. , Nikadon, J. , Dreszer, J. , … Kuhn, S. (2017). Transition of the functional brain network related to increasing cognitive demands. Human Brain Mapping, 38(7), 3659–3674. 10.1002/hbm.23621 [DOI] [PMC free article] [PubMed] [Google Scholar]
- Fornito, A. , Zalesky, A. , & Breakspear, M. (2013). Graph analysis of the human connectome: Promise, progress, and pitfalls. NeuroImage, 80, 426–444. 10.1016/j.neuroimage.2013.04.087 [DOI] [PubMed] [Google Scholar]
- Fox, M. D. , Snyder, A. Z. , Vincent, J. L. , Corbetta, M. , Van Essen, D. C. , & Raichle, M. E. (2005). The human brain is intrinsically organized into dynamic, anticorrelated functional networks. Proceedings of the National Academy of Sciences of the United States of America, 102(27), 9673–9678. 10.1073/pnas.0504136102 [DOI] [PMC free article] [PubMed] [Google Scholar]
- Gallen, C. L. , Baniqued, P. L. , Chapman, S. B. , Aslan, S. , Keebler, M. , Didehbani, N. , & D'Esposito, M. (2016). Modular brain network organization predicts response to cognitive training in older adults. PLoS One, 11(12), e0169015. 10.1371/journal.pone.0169015 [DOI] [PMC free article] [PubMed] [Google Scholar]
- Gallen, C. L. , & D'Esposito, M. (2019). Brain modularity: A biomarker of intervention‐related plasticity. Trends in Cognitive Sciences, 23(4), 293–304. 10.1016/j.tics.2019.01.014 [DOI] [PMC free article] [PubMed] [Google Scholar]
- Gallen, C. L. , Turner, G. R. , Adnan, A. , & D'Esposito, M. (2016). Reconfiguration of brain network architecture to support executive control in aging. Neurobiology of Aging, 44, 42–52. 10.1016/j.neurobiolaging.2016.04.003 [DOI] [PMC free article] [PubMed] [Google Scholar]
- Garrison, K. A. , Scheinost, D. , Finn, E. S. , Shen, X. , & Constable, R. T. (2015). The (in)stability of functional brain network measures across thresholds. NeuroImage, 118, 651–661. 10.1016/j.neuroimage.2015.05.046 [DOI] [PMC free article] [PubMed] [Google Scholar]
- Geerligs, L. , Renken, R. J. , Saliasi, E. , Maurits, N. M. , & Lorist, M. M. (2015). A brain‐wide study of age‐related changes in functional connectivity. Cerebral Cortex, 25(7), 1987–1999. 10.1093/cercor/bhu012 [DOI] [PubMed] [Google Scholar]
- Geerligs, L. , Tsvetanov, K. A. , & Henson, R. N. (2017). Challenges in measuring individual differences in functional connectivity using fMRI: The case of healthy aging. Human Brain Mapping, 38(8), 4125–4156. 10.1002/hbm.23653 [DOI] [PMC free article] [PubMed] [Google Scholar]
- Godwin, D. , Barry, R. L. , & Marois, R. (2015). Breakdown of the brain's functional network modularity with awareness. Proceedings of the National Academy of Sciences of the United States of America, 112(12), 3799–3804. 10.1073/pnas.1414466112 [DOI] [PMC free article] [PubMed] [Google Scholar]
- Good, B. H. , de Montjoye, Y.‐A. , & Clauset, A. (2010). Performance of modularity maximization in practical contexts. Physical Review E, 81(4), 046106. 10.1103/PhysRevE.81.046106 [DOI] [PubMed] [Google Scholar]
- Grady, C. (2012). The cognitive neuroscience of ageing. Nature Reviews. Neuroscience, 13(7), 491–505. 10.1038/nrn3256 [DOI] [PMC free article] [PubMed] [Google Scholar]
- Grady, C. , Sarraf, S. , Saverino, C. , & Campbell, K. (2016). Age differences in the functional interactions among the default, frontoparietal control, and dorsal attention networks. Neurobiology of Aging, 41, 159–172. 10.1016/j.neurobiolaging.2016.02.020 [DOI] [PubMed] [Google Scholar]
- Guimerà, R. , & Amaral, L. A. N. (2005). Cartography of complex networks: Modules and universal roles. Journal of Statistical Mechanics: Theory and Experiment, 2005(02), P02001. [DOI] [PMC free article] [PubMed] [Google Scholar]
- He, X. , Qin, W. , Liu, Y. , Zhang, X. , Duan, Y. , Song, J. , … Yu, C. (2014). Abnormal salience network in normal aging and in amnestic mild cognitive impairment and Alzheimer's disease. Human Brain Mapping, 35(7), 3446–3464. 10.1002/hbm.22414 [DOI] [PMC free article] [PubMed] [Google Scholar]
- Hearne, L. J. , Cocchi, L. , Zalesky, A. , & Mattingley, J. B. (2017). Reconfiguration of brain network architectures between resting‐state and complexity‐dependent cognitive reasoning. The Journal of Neuroscience, 37(35), 8399–8411. 10.1523/JNEUROSCI.0485-17.2017 [DOI] [PMC free article] [PubMed] [Google Scholar]
- Heinzel, S. , Lorenz, R. C. , Brockhaus, W. R. , Wustenberg, T. , Kathmann, N. , Heinz, A. , & Rapp, M. A. (2014). Working memory load‐dependent brain response predicts behavioral training gains in older adults. The Journal of Neuroscience, 34(4), 1224–1233. 10.1523/jneurosci.2463-13.2014 [DOI] [PMC free article] [PubMed] [Google Scholar]
- Huang, A. S. , Klein, D. N. , & Leung, H. C. (2016). Load‐related brain activation predicts spatial working memory performance in youth aged 9‐12 and is associated with executive function at earlier ages. Developmental Cognitive Neuroscience, 17, 1–9. 10.1016/j.dcn.2015.10.007 [DOI] [PMC free article] [PubMed] [Google Scholar]
- Hughes, C. , Faskowitz, J. , Cassidy, B. S. , Sporns, O. , & Krendl, A. C. (2020). Aging relates to a disproportionately weaker functional architecture of brain networks during rest and task states. NeuroImage, 209, 116521. 10.1016/j.neuroimage.2020.116521 [DOI] [PubMed] [Google Scholar]
- Iordan, A. D. , Cooke, K. A. , Moored, K. D. , Katz, B. , Buschkuehl, M. , Jaeggi, S. M. , … Reuter‐Lorenz, P. A. (2018). Aging and network properties: Stability over time and links with learning during working memory training. Frontiers in Aging Neuroscience, 9, 419. 10.3389/fnagi.2017.00419 [DOI] [PMC free article] [PubMed] [Google Scholar]
- Iordan, A. D. , Cooke, K. A. , Moored, K. D. , Katz, B. , Buschkuehl, M. , Jaeggi, S. M. , … Reuter‐Lorenz, P. A. (2020). Neural correlates of working memory training: Evidence for plasticity in older adults. NeuroImage, 217, 116887. 10.1016/j.neuroimage.2020.116887 [DOI] [PMC free article] [PubMed] [Google Scholar]
- Iordan, A. D. , & Reuter‐Lorenz, P. A. (2017). Age‐related change and the predictive value of the “resting state”: A commentary on Campbell and Schacter (2016). Language, Cognition and Neuroscience, 32(6), 674–677. 10.1080/23273798.2016.1242759 [DOI] [PMC free article] [PubMed] [Google Scholar]
- Kelly, A. M. , Uddin, L. Q. , Biswal, B. B. , Castellanos, F. X. , & Milham, M. P. (2008). Competition between functional brain networks mediates behavioral variability. NeuroImage, 39(1), 527–537. 10.1016/j.neuroimage.2007.08.008 [DOI] [PubMed] [Google Scholar]
- Kitzbichler, M. G. , Henson, R. N. , Smith, M. L. , Nathan, P. J. , & Bullmore, E. T. (2011). Cognitive effort drives workspace configuration of human brain functional networks. The Journal of Neuroscience, 31(22), 8259–8270. 10.1523/jneurosci.0440-11.2011 [DOI] [PMC free article] [PubMed] [Google Scholar]
- Klein, A. , Andersson, J. , Ardekani, B. A. , Ashburner, J. , Avants, B. , Chiang, M. C. , … Parsey, R. V. (2009). Evaluation of 14 nonlinear deformation algorithms applied to human brain MRI registration. NeuroImage, 46(3), 786–802. 10.1016/j.neuroimage.2008.12.037 [DOI] [PMC free article] [PubMed] [Google Scholar]
- Korhonen, O. , Saarimäki, H. , Glerean, E. , Sams, M. , & Saramäki, J. (2017). Consistency of regions of interest as nodes of fMRI functional brain networks. Network Neuroscience, 1(3), 254–274. 10.1162/NETN_a_00013 [DOI] [PMC free article] [PubMed] [Google Scholar]
- Krienen, F. M. , Yeo, B. T. T. , & Buckner, R. L. (2014). Reconfigurable task‐dependent functional coupling modes cluster around a core functional architecture. Philosophical Transactions of the Royal Society, B: Biological Sciences, 369(1653), 20130526. 10.1098/rstb.2013.0526 [DOI] [PMC free article] [PubMed] [Google Scholar]
- Lancichinetti, A. , & Fortunato, S. (2012). Consensus clustering in complex networks. Scientific Reports, 2, 336. 10.1038/srep00336 [DOI] [PMC free article] [PubMed] [Google Scholar]
- Latora, V. , & Marchiori, M. (2003). Economic small‐world behavior in weighted networks. The European Physical Journal B ‐ Condensed Matter, 32(2), 249–263. 10.1140/epjb/e2003-00095-5 [DOI] [Google Scholar]
- Lebedev, A. V. , Nilsson, J. , & Lovden, M. (2018). Working memory and reasoning benefit from different modes of large‐scale brain dynamics in healthy older adults. Journal of Cognitive Neuroscience, 30(7), 1033–1046. 10.1162/jocn_a_01260 [DOI] [PubMed] [Google Scholar]
- Li, H. J. , Hou, X. H. , Liu, H. H. , Yue, C. L. , Lu, G. M. , & Zuo, X. N. (2015). Putting age‐related task activation into large‐scale brain networks: A meta‐analysis of 114 fMRI studies on healthy aging. Neuroscience and Biobehavioral Reviews, 57, 156–174. 10.1016/j.neubiorev.2015.08.013 [DOI] [PubMed] [Google Scholar]
- Liang, X. , Zou, Q. , He, Y. , & Yang, Y. (2016). Topologically reorganized connectivity architecture of default‐mode, executive‐control, and salience networks across working memory task loads. Cerebral Cortex, 26(4), 1501–1511. 10.1093/cercor/bhu316 [DOI] [PMC free article] [PubMed] [Google Scholar]
- Malagurski, B. , Liem, F. , Oschwald, J. , Mérillat, S. , & Jäncke, L. (2020). Functional dedifferentiation of associative resting state networks in older adults—A longitudinal study. NeuroImage, 214, 116680. 10.1016/j.neuroimage.2020.116680 [DOI] [PubMed] [Google Scholar]
- Maslov, S. , & Sneppen, K. (2002). Specificity and stability in topology of protein networks. Science, 296(5569), 910–913. 10.1126/science.1065103 [DOI] [PubMed] [Google Scholar]
- Meier, T. B. , Desphande, A. S. , Vergun, S. , Nair, V. A. , Song, J. , Biswal, B. B. , … Prabhakaran, V. (2012). Support vector machine classification and characterization of age‐related reorganization of functional brain networks. NeuroImage, 60(1), 601–613. 10.1016/j.neuroimage.2011.12.052 [DOI] [PMC free article] [PubMed] [Google Scholar]
- Meilă, M. (2007). Comparing clusterings—An information based distance. Journal of Multivariate Analysis, 98(5), 873–895. 10.1016/j.jmva.2006.11.013 [DOI] [Google Scholar]
- Menon, V. (2011). Large‐scale brain networks and psychopathology: A unifying triple network model. Trends in Cognitive Sciences, 15(10), 483–506. 10.1016/j.tics.2011.08.003 [DOI] [PubMed] [Google Scholar]
- Meunier, D. , Achard, S. , Morcom, A. , & Bullmore, E. (2009). Age‐related changes in modular organization of human brain functional networks. NeuroImage, 44(3), 715–723. 10.1016/j.neuroimage.2008.09.062 [DOI] [PubMed] [Google Scholar]
- Meunier, D. , Stamatakis, E. A. , & Tyler, L. K. (2014). Age‐related functional reorganization, structural changes, and preserved cognition. Neurobiology of Aging, 35(1), 42–54. 10.1016/j.neurobiolaging.2013.07.003 [DOI] [PubMed] [Google Scholar]
- Murphy, K. , Birn, R. M. , Handwerker, D. A. , Jones, T. B. , & Bandettini, P. A. (2009). The impact of global signal regression on resting state correlations: Are anti‐correlated networks introduced? NeuroImage, 44(3), 893–905. 10.1016/j.neuroimage.2008.09.036 [DOI] [PMC free article] [PubMed] [Google Scholar]
- Muschelli, J. , Nebel, M. B. , Caffo, B. S. , Barber, A. D. , Pekar, J. J. , & Mostofsky, S. H. (2014). Reduction of motion‐related artifacts in resting state fMRI using aCompCor. NeuroImage, 96, 22–35. 10.1016/j.neuroimage.2014.03.028 [DOI] [PMC free article] [PubMed] [Google Scholar]
- Nagel, I. E. , Preuschhof, C. , Li, S. C. , Nyberg, L. , Backman, L. , Lindenberger, U. , & Heekeren, H. R. (2009). Performance level modulates adult age differences in brain activation during spatial working memory. Proceedings of the National Academy of Sciences of the United States of America, 106(52), 22552–22557. 10.1073/pnas.0908238106 [DOI] [PMC free article] [PubMed] [Google Scholar]
- Naik, S. , Banerjee, A. , Bapi, R. S. , Deco, G. , & Roy, D. (2017). Metastability in senescence. Trends in Cognitive Sciences, 21(7), 509–521. 10.1016/j.tics.2017.04.007 [DOI] [PubMed] [Google Scholar]
- Newman, M. E. J. (2006). Modularity and community structure in networks. Proceedings of the National Academy of Sciences of the United States of America, 103(23), 8577–8582. 10.1073/pnas.0601602103 [DOI] [PMC free article] [PubMed] [Google Scholar]
- Newman, M. E. J. , & Girvan, M. (2004). Finding and evaluating community structure in networks. Physical Review E, 69(2), 026113. 10.1103/physreve.69.026113 [DOI] [PubMed] [Google Scholar]
- Onoda, K. , Ishihara, M. , & Yamaguchi, S. (2012). Decreased functional connectivity by aging is associated with cognitive decline. Journal of Cognitive Neuroscience, 24(11), 2186–2198. 10.1162/jocn_a_00269 [DOI] [PubMed] [Google Scholar]
- Onoda, K. , & Yamaguchi, S. (2013). Small‐worldness and modularity of the resting‐state functional brain network decrease with aging. Neuroscience Letters, 556, 104–108. 10.1016/j.neulet.2013.10.023 [DOI] [PubMed] [Google Scholar]
- Park, D. C. , Polk, T. A. , Park, R. , Minear, M. , Savage, A. , & Smith, M. R. (2004). Aging reduces neural specialization in ventral visual cortex. Proceedings of the National Academy of Sciences of the United States of America, 101(35), 13091–13095. 10.1073/pnas.0405148101 [DOI] [PMC free article] [PubMed] [Google Scholar]
- Park, D. C. , & Reuter‐Lorenz, P. (2009). The adaptive brain: Aging and neurocognitive scaffolding. Annual Review of Psychology, 60, 173–196. 10.1146/annurev.psych.59.103006.093656 [DOI] [PMC free article] [PubMed] [Google Scholar]
- Park, J. , Carp, J. , Hebrank, A. , Park, D. C. , & Polk, T. A. (2010). Neural specificity predicts fluid processing ability in older adults. The Journal of Neuroscience, 30(27), 9253–9259. 10.1523/jneurosci.0853-10.2010 [DOI] [PMC free article] [PubMed] [Google Scholar]
- Power, J. D. , Cohen, A. L. , Nelson, S. M. , Wig, G. S. , Barnes, K. A. , Church, J. A. , … Petersen, S. E. (2011). Functional network organization of the human brain. Neuron, 72(4), 665–678. 10.1016/j.neuron.2011.09.006 [DOI] [PMC free article] [PubMed] [Google Scholar]
- Power, J. D. , & Petersen, S. E. (2013). Control‐related systems in the human brain. Current Opinion in Neurobiology, 23(2), 223–228. 10.1016/j.conb.2012.12.009 [DOI] [PMC free article] [PubMed] [Google Scholar]
- Reuter‐Lorenz, P. A. , & Cappell, K. A. (2008). Neurocognitive aging and the compensation hypothesis. Current Directions in Psychological Science, 17(3), 177–182. [Google Scholar]
- Reuter‐Lorenz, P. A. , & Iordan, A. D. (2018). From cognitive tasks to cognitive theories and Back again: Fitting data to the real world. Journal of Applied Research in Memory and Cognition, 7(4), 510–513. 10.1016/j.jarmac.2018.09.007 [DOI] [Google Scholar]
- Reuter‐Lorenz, P. A. , & Park, D. C. (2014). How does it STAC up? Revisiting the scaffolding theory of aging and cognition. Neuropsychology Review, 24(3), 355–370. 10.1007/s11065-014-9270-9 [DOI] [PMC free article] [PubMed] [Google Scholar]
- Rubinov, M. , & Sporns, O. (2010). Complex network measures of brain connectivity: Uses and interpretations. NeuroImage, 52(3), 1059–1069. 10.1016/j.neuroimage.2009.10.003 [DOI] [PubMed] [Google Scholar]
- Salami, A. , Rieckmann, A. , Karalija, N. , Avelar‐Pereira, B. , Andersson, M. , Wåhlin, A. , … Nyberg, L. (2018). Neurocognitive profiles of older adults with working‐memory dysfunction. Cerebral Cortex, 28(7), 2525–2539. 10.1093/cercor/bhy062 [DOI] [PMC free article] [PubMed] [Google Scholar]
- Salmi, J. , Nyberg, L. , & Laine, M. (2018). Working memory training mostly engages general‐purpose large‐scale networks for learning. Neuroscience and Biobehavioral Reviews, 93, 108–122. 10.1016/j.neubiorev.2018.03.019 [DOI] [PubMed] [Google Scholar]
- Sambataro, F. , Murty, V. P. , Callicott, J. H. , Tan, H. Y. , Das, S. , Weinberger, D. R. , & Mattay, V. S. (2010). Age‐related alterations in default mode network: Impact on working memory performance. Neurobiology of Aging, 31(5), 839–852. 10.1016/j.neurobiolaging.2008.05.022 [DOI] [PMC free article] [PubMed] [Google Scholar]
- Schaefer, A. , Kong, R. , Gordon, E. M. , Laumann, T. O. , Zuo, X. N. , Holmes, A. J. , … Yeo, B. T. T. (2018). Local‐global Parcellation of the human cerebral cortex from intrinsic functional connectivity MRI. Cerebral Cortex, 28(9), 3095–3114. 10.1093/cercor/bhx179 [DOI] [PMC free article] [PubMed] [Google Scholar]
- Schneider‐Garces, N. J. , Gordon, B. A. , Brumback‐Peltz, C. R. , Shin, E. , Lee, Y. , Sutton, B. P. , … Fabiani, M. (2010). Span, CRUNCH, and beyond: Working memory capacity and the aging brain. Journal of Cognitive Neuroscience, 22(4), 655–669. 10.1162/jocn.2009.21230 [DOI] [PMC free article] [PubMed] [Google Scholar]
- Schölvinck, M. L. , Maier, A. , Ye, F. Q. , Duyn, J. H. , & Leopold, D. A. (2010). Neural basis of global resting‐state fMRI activity. Proceedings of the National Academy of Sciences of the United States of America, 107(22), 10238–10243. 10.1073/pnas.0913110107 [DOI] [PMC free article] [PubMed] [Google Scholar]
- Seeley, W. W. , Menon, V. , Schatzberg, A. F. , Keller, J. , Glover, G. H. , Kenna, H. , … Greicius, M. D. (2007). Dissociable intrinsic connectivity networks for salience processing and executive control. The Journal of Neuroscience, 27(9), 2349–2356. 10.1523/JNEUROSCI.5587-06.2007 [DOI] [PMC free article] [PubMed] [Google Scholar]
- Shine, J. M. , Bissett, P. G. , Bell, P. T. , Koyejo, O. , Balsters, J. H. , Gorgolewski, K. J. , … Poldrack, R. A. (2016). The dynamics of functional brain networks: Integrated network states during cognitive task performance. Neuron, 92(2), 544–554. 10.1016/j.neuron.2016.09.018 [DOI] [PMC free article] [PubMed] [Google Scholar]
- Simmonite, M. , & Polk, T. A. (2019). Independent components of neural activation associated with 100 days of cognitive training. Journal of Cognitive Neuroscience, 31(6), 808–820. 10.1162/jocn_a_01396 [DOI] [PubMed] [Google Scholar]
- Song, J. , Birn, R. M. , Boly, M. , Meier, T. B. , Nair, V. A. , Meyerand, M. E. , & Prabhakaran, V. (2014). Age‐related reorganizational changes in modularity and functional connectivity of human brain networks. Brain Connectivity, 4(9), 662–676. 10.1089/brain.2014.0286 [DOI] [PMC free article] [PubMed] [Google Scholar]
- Spreng, R. N. , Wojtowicz, M. , & Grady, C. L. (2010). Reliable differences in brain activity between young and old adults: A quantitative meta‐analysis across multiple cognitive domains. Neuroscience and Biobehavioral Reviews, 34(8), 1178–1194. 10.1016/j.neubiorev.2010.01.009 [DOI] [PubMed] [Google Scholar]
- Stanley, M. , Moussa, M. , Paolini, B. , Lyday, R. , Burdette, J. , & Laurienti, P. (2013). Defining nodes in complex brain networks. Frontiers in Computational Neuroscience, 7, 169. 10.3389/fncom.2013.00169 [DOI] [PMC free article] [PubMed] [Google Scholar]
- Sternberg, S. (1966). High‐speed scanning in human memory. Science, 153(3736), 652–654. [DOI] [PubMed] [Google Scholar]
- Summerfield, C. , Greene, M. , Wager, T. , Egner, T. , Hirsch, J. , & Mangels, J. (2006). Neocortical connectivity during episodic memory formation. PLoS Biology, 4(5), e128. 10.1371/journal.pbio.0040128 [DOI] [PMC free article] [PubMed] [Google Scholar]
- Sun, F. T. , Miller, L. M. , & D'Esposito, M. (2004). Measuring interregional functional connectivity using coherence and partial coherence analyses of fMRI data. NeuroImage, 21(2), 647–658. 10.1016/j.neuroimage.2003.09.056 [DOI] [PubMed] [Google Scholar]
- Sutton, B. P. , Noll, D. C. , & Fessler, J. A. (2003). Fast, iterative image reconstruction for MRI in the presence of field inhomogeneities. IEEE Transactions on Medical Imaging, 22(2), 178–188. 10.1109/TMI.2002.808360 [DOI] [PubMed] [Google Scholar]
- Triana, A. M. , Glerean, E. , Saramäki, J. , & Korhonen, O. (2020). Effects of spatial smoothing on group‐level differences in functional brain networks. Network Neuroscience, 4(3), 556–574. 10.1162/netn_a_00132 [DOI] [PMC free article] [PubMed] [Google Scholar]
- Turk‐Browne, N. B. (2013). Functional interactions as big data in the human brain. Science, 342(6158), 580–584. 10.1126/science.1238409 [DOI] [PMC free article] [PubMed] [Google Scholar]
- van den Heuvel, M. P. , de Lange, S. C. , Zalesky, A. , Seguin, C. , Yeo, B. T. T. , & Schmidt, R. (2017). Proportional thresholding in resting‐state fMRI functional connectivity networks and consequences for patient‐control connectome studies: Issues and recommendations. NeuroImage, 152, 437–449. 10.1016/j.neuroimage.2017.02.005 [DOI] [PubMed] [Google Scholar]
- van den Heuvel, M. P. , Stam, C. J. , Kahn, R. S. , & Hulshoff Pol, H. E. (2009). Efficiency of functional brain networks and intellectual performance. The Journal of Neuroscience, 29(23), 7619–7624. 10.1523/jneurosci.1443-09.2009 [DOI] [PMC free article] [PubMed] [Google Scholar]
- Varangis, E. , Razlighi, Q. , Habeck, C. G. , Fisher, Z. , & Stern, Y. (2019). Between‐network functional connectivity is modified by age and cognitive task domain. Journal of Cognitive Neuroscience, 31(4), 607–622. 10.1162/jocn_a_01368 [DOI] [PMC free article] [PubMed] [Google Scholar]
- Vatansever, D. , Menon, D. K. , Manktelow, A. E. , Sahakian, B. J. , & Stamatakis, E. A. (2015). Default mode dynamics for global functional integration. The Journal of Neuroscience, 35(46), 15254–15262. 10.1523/jneurosci.2135-15.2015 [DOI] [PMC free article] [PubMed] [Google Scholar]
- Wang, L. , Zhu, C. , He, Y. , Zang, Y. , Cao, Q. , Zhang, H. , … Wang, Y. (2009). Altered small‐world brain functional networks in children with attention‐deficit/hyperactivity disorder. Human Brain Mapping, 30(2), 638–649. 10.1002/hbm.20530 [DOI] [PMC free article] [PubMed] [Google Scholar]
- Watts, D. J. , & Strogatz, S. H. (1998). Collective dynamics of ‘small‐world’ networks. Nature, 393(6684), 440–442. 10.1038/30918 [DOI] [PubMed] [Google Scholar]
- Westphal, A. J. , Wang, S. , & Rissman, J. (2017). Episodic memory retrieval benefits from a less modular brain network organization. The Journal of Neuroscience, 37(13), 3523–3531. 10.1523/jneurosci.2509-16.2017 [DOI] [PMC free article] [PubMed] [Google Scholar]
- Whitfield‐Gabrieli, S. , & Nieto‐Castanon, A. (2012). Conn: A functional connectivity toolbox for correlated and Anticorrelated brain networks. Brain Connectivity, 2(3), 125–141. 10.1089/brain.2012.0073 [DOI] [PubMed] [Google Scholar]
- Wig, G. S. (2017). Segregated Systems of Human Brain Networks. Trends in Cognitive Sciences, 21(12), 981–996. 10.1016/j.tics.2017.09.006 [DOI] [PubMed] [Google Scholar]
- van Wijk, B. C. M. , Stam, C. J. , & Daffertshofer, A. (2010). Comparing brain networks of different size and connectivity density using graph theory. PLoS One, 5(10), e13701. 10.1371/journal.pone.0013701 [DOI] [PMC free article] [PubMed] [Google Scholar]
- Yeo, B. T. T. , Krienen, F. M. , Sepulcre, J. , Sabuncu, M. R. , Lashkari, D. , Hollinshead, M. , … Buckner, R. L. (2011). The organization of the human cerebral cortex estimated by intrinsic functional connectivity. Journal of Neurophysiology, 106(3), 1125–1165. 10.1152/jn.00338.2011 [DOI] [PMC free article] [PubMed] [Google Scholar]
- Yue, Q. , Martin, R. C. , Fischer‐Baum, S. , Ramos‐Nunez, A. I. , Ye, F. , & Deem, M. W. (2017). Brain modularity mediates the relation between task complexity and performance. Journal of Cognitive Neuroscience, 29(9), 1532–1546. 10.1162/jocn_a_01142 [DOI] [PubMed] [Google Scholar]
- Zalesky, A. , Fornito, A. , & Bullmore, E. (2012). On the use of correlation as a measure of network connectivity. NeuroImage, 60(4), 2096–2106. 10.1016/j.neuroimage.2012.02.001 [DOI] [PubMed] [Google Scholar]
- Zalesky, A. , Fornito, A. , & Bullmore, E. T. (2010). Network‐based statistic: Identifying differences in brain networks. NeuroImage, 53(4), 1197–1207. 10.1016/j.neuroimage.2010.06.041 [DOI] [PubMed] [Google Scholar]
- Zalesky, A. , Fornito, A. , Cocchi, L. , Gollo, L. L. , van den Heuvel, M. P. , & Breakspear, M. (2016). Connectome sensitivity or specificity: Which is more important? NeuroImage, 142, 407–420. 10.1016/j.neuroimage.2016.06.035 [DOI] [PubMed] [Google Scholar]
- Zuo, N. , Yang, Z. , Liu, Y. , Li, J. , & Jiang, T. (2018). Core networks and their reconfiguration patterns across cognitive loads. Human Brain Mapping, 39(9), 3546–3557. 10.1002/hbm.24193 [DOI] [PMC free article] [PubMed] [Google Scholar]
Associated Data
This section collects any data citations, data availability statements, or supplementary materials included in this article.
Supplementary Materials
Appendix S1 Supporting information.
Data Availability Statement
The MRI and behavioral data that were used in this study are available to researchers from the corresponding author upon request.