

Abstract
The deviation between chronological age and age predicted using brain MRI is a putative marker of overall brain health. Age prediction based on structural MRI data shows high accuracy in common brain disorders. However, brain aging is complex and heterogenous, both in terms of individual differences and the underlying biological processes. Here, we implemented a multimodal model to estimate brain age using different combinations of cortical area, thickness and sub‐cortical volumes, cortical and subcortical T1/T2‐weighted ratios, and cerebral blood flow (CBF) based on arterial spin labeling. For each of the 11 models we assessed the age prediction accuracy in healthy controls (HC, n = 750) and compared the obtained brain age gaps (BAGs) between age‐matched subsets of HC and patients with Alzheimer's disease (AD, n = 54), mild (MCI, n = 90) and subjective (SCI, n = 56) cognitive impairment, schizophrenia spectrum (SZ, n = 159) and bipolar disorder (BD, n = 135). We found highest age prediction accuracy in HC when integrating all modalities. Furthermore, two‐group case–control classifications revealed highest accuracy for AD using global T1‐weighted BAG, while MCI, SCI, BD and SZ showed strongest effects in CBF‐based BAGs. Combining multiple MRI modalities improves brain age prediction and reveals distinct deviations in patients with psychiatric and neurological disorders. The multimodal BAG was most accurate in predicting age in HC, while group differences between patients and HC were often larger for BAGs based on single modalities. These findings indicate that multidimensional neuroimaging of patients may provide a brain‐based mapping of overlapping and distinct pathophysiology in common disorders.
Keywords: arterial spin labeling, brain age, brain disorders, cerebral blood flow, machine learning, MRI, multimodal imaging, T1w/T2w ratio
The deviation between chronological age and age predicted using brain MRI is a marker of overall brain health. Here, we implemented a multimodal model to estimate brain age using different combinations of cortical area, thickness and sub‐cortical volumes, cortical and subcortical T1/T2‐weighted ratios, and cerebral blood flow (CBF). We found that, combining multiple MRI modalities improves brain age prediction and reveals distinct deviations in patients with psychiatric and neurological disorders.
1. INTRODUCTION
Brain age gap (BAG) ‐ the difference between an individual's chronological and predicted age based on imaging data may serve as a surrogate marker of general brain health and disease‐related deterioration of the brain (Cole & Franke, 2017). Previous studies have focused on morphometric and volumetric features derived from T1‐weighted (T1w) images. While this single‐modality approach has the benefit of reducing analytic complexity, it does not take into consideration the vast biological heterogeneity of the developing and aging brain, and comes at the cost of reduced sensitivity to biological processes that are not primarily reflected in gross brain anatomy or morphology (Richard et al., 2018).
Normative brain development and aging, as well as emerging disease mechanisms in common brain and mental disorders, are highly heterogenous both in terms of spatial distribution and underlying neurobiology. As brain disorders disrupt brain structure and function on different levels by divergent pathophysiological mechanisms, it is reasonable to assume that such variety cannot be fully captured by a brain estimate derived from a single MRI modality. Therefore, single‐modality approaches may diminish sensitivity and specificity to clinical conditions with distinct pathophysiology, and interpreting clinical brain aberrations based solely on T1w‐data may conceal relevant information. In fact, various brain imaging modalities reveal unique patterns and trajectories across the lifespan, and possibly capture distinct biological contributions to brain aging and disease development. While the large majority of brain age prediction studies have focused on T1w data only, some studies have simultaneously considered numerous imaging modalities in order to model multiple biologically distinct brain ages (Brown et al., 2012; Cole, 2020; Engemann et al., 2020; Liem et al., 2017; Niu, Zhang, Kounios, & Liang, 2020; Richard et al., 2018; Smith et al., 2020). However, few attempts have been made to model multiple biologically distinct brain ages in patient populations. In addition to overall increased age prediction accuracy offered by the complementary information, considering a range of MRI modalities may provide more insight into specific deleterious neurobiological processes associated with different clinical conditions.
A number of brain disorders have been associated with increased BAG, with schizophrenia spectrum disorders (SZ) and Alzheimer's disease (AD) among those showing largest effects, primarily driven by apparent cortical thinning and aberrant subcortical volumes (Kaufmann et al., 2019). BAG has been shown to be more accurate in predicting the conversion of mild cognitive impairment (MCI) to AD compared to T1‐based MRI features such as cortical thickness and regional brain volumes (Gaser & Franke, 2013) and potentially can be used as a biomarker for early dementia risk screening (Wang et al., 2019). Bipolar disorder (BD) and SZ are severe mental disorders with overlapping symptoms and shared neurobiological underpinnings (Ruderfer et al., 2018). Whereas previous imaging studies aiming at identifying brain morphometric correlates of the disorders have revealed diverging results, differences in BAG between SZ and HC were shown to be larger than differences between BD and HC (Hajek et al., 2017; Kaufmann et al., 2019).
Several structural imaging modalities and markers have been proposed. Myelin deficiencies and abnormal expression of myelin genes are common in brain disorders, and, while conflicting evidence exists (Stokowy et al., 2018), oligodendroglial dysfunction and abnormalities in myelin maintenance and repair have been implicated in SZ (Davis et al., 2003; Jungerius et al., 2008; Lee & Douglas Fields, 2009). Previous studies have demonstrated that intra‐cortical myelin content, as assessed using T1/T2‐weighted (T1w/T2w) ratio, shows a characteristic pattern of aging‐related effects (Grydeland et al., 2018; Grydeland, Walhovd, Tamnes, Westlye, & Fjell, 2013a) and is affected in both SZ (Ganzetti, Wenderoth, & Mantini, 2015; Iwatani et al., 2015) and BD (Ishida et al., 2017). Furthermore, associations between risk of developing psychosis, cognitive ability and apparent myelin content were found in children and adolescents (Norbom et al., 2019). Myelin‐related processes are also relevant for age‐related cognitive decline. An influential myelin model suggests a close relationship between degenerative disorders such as AD and myelination (Bartzokis, 2011), yet, recent studies using T1w/T2w ratio revealed contradicting results, reporting both cortical demyelination (Luo et al., 2019) and higher apparent cortical myelin content (Pelkmans et al., 2019) in AD.
While the T1w/T2w ratio partly reflects the cortical myeloarchitecture, arterial spin labeling (ASL) enables a non‐invasive assessment of cerebral blood flow (CBF), serving as a proxy for clinically relevant neurovascular and metabolic processes in the brain (Biagi et al., 2007; Haller et al., 2016). Accordingly, recent studies reported case–control differences in CBF in individuals with SZ (Pinkham et al., 2011; Stegmayer et al., 2017), sub‐clinical psychotic‐type experiences (Modinos et al., 2018), and in various forms and severities of neurodegenerative disorders (Zhang, Gordon, & Goldberg, 2017).
In this study, we tested for dissociable brain deviations in common neurological and psychiatric disorders based on BAG defined using measures of brain morphology (cortical thickness, cortical area, subcortical volumes), T1w/T2w ratio maps partially reflecting cortical and subcortical myelin content, and cortical and subcortical CBF maps reflecting neurovascular and metabolic processes in the brain. We used data from HC as training sets and for comparison of age prediction accuracy across modalities. We included data from patients with aging‐related cognitive and neurodegenerative disorders, including subjective cognitive impairment (SCI), MCI and AD, as well as severe mental disorders with a neurodevelopmental etiology, including SZ and BD. All subjects were scanned on the same scanner with a standardized protocol. Based on the assumption that the different imaging modalities provide complementary information of brain structure and function, we hypothesized that the model fusing all modalities would show highest age prediction accuracy. Based on previous studies, we anticipated overall abnormalities in BAG across disorders, yet given the differential etiology and pathophysiology of the neurodegenerative and neurodevelopmental spectrum disorders, we expected that the single‐modality BAGs would show differential sensitivity in the distinct groups.
2. METHODS
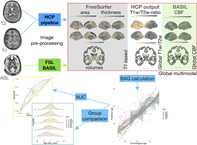
Figure 1 shows an overview of the general approach.
FIGURE 1.
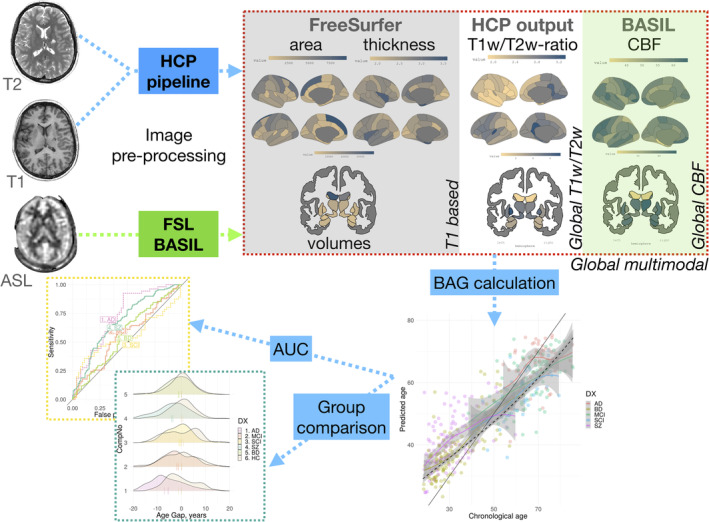
Pipeline. Three MRI sequences were used to generate 11 feature sets used to build brain age prediction models. These models were trained on HC and applied on patient samples. Subsequently, pairwise group comparisons between each patient group and an age‐ and sex‐matched subset of HC using linear models
2.1. Participants
T1w, T2w and ASL data were available from 1,452 participants. Among these, 208 were excluded due to insufficient T1w image quality (n = 73), errors occurring during the Freesurfer pipeline (n = 7), errors in estimation of T1w/T2w ratio maps (n = 41), errors in CBF calculations (n = 18) and unspecific or unknown clinical diagnosis (n = 69). The final sample thus consisted of data from 1,244 individuals. All participants were recruited from the greater Oslo region as part of three studies: the Thematically Organized Psychosis (TOP) study, the Norwegian register of persons assessed for cognitive symptoms (NorCog), and STROKEMRI study (Richard et al., 2018). Key demographics are described in details in Table 1, and Supplementary Figure S1 and Table S1. Clinical information is summarized in Supplementary Table S2.
TABLE 1.
Participant demographics summarized by diagnosis
| Group | N | Mean age, years | SD age | Min age | Max age | % male |
|---|---|---|---|---|---|---|
| HC | 750 | 45.0 | 16.1 | 18.0 | 85.8 | 46.3 |
| AD | 54 | 69.4 | 6.8 | 54.2 | 85.3 | 38.9 |
| MCI | 90 | 65.8 | 9.6 | 38.6 | 85.5 | 56.7 |
| SCI | 56 | 59.4 | 8.7 | 39.6 | 79.3 | 42.9 |
| SZ | 159 | 31.0 | 9.2 | 18.4 | 59.7 | 56.0 |
| BD | 135 | 32.8 | 10.8 | 18.4 | 63.9 | 34.1 |
| Total | 1,244 | 45.1 | 17.3 | 18.0 | 85.8 | 46.5 |
Abbreviations: N, number of participants; SD, standard deviation.
Inclusion criteria for participants in TOP were meeting the DSM‐IV diagnostic criteria for broad schizophrenia and bipolar spectrum diagnoses, age between 18 and 65 years, no history of severe head injury or other disorders affecting the central nervous system, and an IQ > 70. The participants were referred to the study by their clinicians from local hospitals. HC were recruited through a stratified random selection from national records. Upon inclusion in the TOP study, the HC were screened with the Primary Care Evaluation of Mental Disorders (PRIME‐MD) in order to confirm no history of psychiatric disorder.
NorCog participants were recruited from the memory clinic at Oslo University Hospital. Diagnosis of AD was based on ICD‐10 criteria, while MCI was defined according to Winblad criteria (Winblad et al., 2004). Patients with subjective cognitive disturbances who did not meet the Winblad criteria were also included in the study as SCI. The diagnoses were confirmed by experienced specialists in geriatric medicine, neurology or psychiatry.
HC in STROKEMRI were recruited through local newspapers and social media, were required to be at least 18 years old and reported no history of stroke, dementia, or other neurological and psychiatric disorders, alcohol and substance abuse or intake of medications significantly affecting the nervous system.
The studies were approved by the Regional Committee for Medical Research Ethics and the Norwegian Data Inspectorate and written informed consent was obtained from all participants.
2.2. MRI acquisition
MRI data was collected on a 3 T DiscoveryTM (MR750) scanner (GE Healthcare, Milwaukee, WI, US) located at the Oslo University Hospital equipped with the vendor's 32‐channel head coil. Whole brain isotropic T1w structural data was acquired using an inversion recovery‐fast spoiled gradient echo sequence (BRAVO) with the following parameters: TR = 8.16 ms, TE = 3.18 ms, TI = 450 ms, flip angle = 12°, field of view = 256 mm, acquisition matrices = 256 × 256, 188 sagittal slices, slice thickness = 1.0 mm, voxel size = 1 × 1 × 1 mm3. Whole brain isotropic T2w structural image was acquired using a 3D fast spin echo (FSE) sequence (CUBE) with following parameters: TR = 2,500 ms, TE = 7.5 ms, field of view = 256 mm, acquisition matrices = 256 × 256, 188 sagittal slices, slice thickness = 1 mm, voxel size = 1 × 1 × 1 mm3. The ASL scan being a pseudo‐Continuous ASL (pCASL) with a 3D FSE interleaved stack‐of‐spirals (3D spiral) readout with 512 points on 8 spirals and an acquisition resolution of 4 × 4 × 3.0 mm3, reconstructed by default to a 2 × 2 × 3 mm3, TE = 11.072 ms, TR = 5,025 ms, labeling duration (LD) = 1,450 ms, post labeling Delay (PLD) = 2025 ms, number of excitations (NEX) = 3. The PLD was chosen as recommended by the review article of (Alsop et al., MRM, 2015) for clinical patients. All scans were performed in the same session.
2.3. Image quality control
Image quality control was performed as a two‐step process. First all T1w images were processed with MRIQC (Esteban & Birman, 2017). The images classified by a default machine learning algorithm to an exclude node with a probability of at least .6 were removed from subsequent analyses. In the second step, all the final cortical maps (area, T1w/T2w ratio and CBF) were visually quality checked. In the second step, quality assessment of the area, thickness, T1w/T2w ratio and CBF maps was performed by careful visual inspection of lateral and medial snapshots of all the maps by a trained researcher. The participant was excluded if the surface values included negative or extreme values, clearly uncharacteristic patterns or strong value disbalance between hemispheres.
2.4. Image pre‐processing
Cortical thickness and T1w/T2w ratio maps were created using Human Connectome Project (HCP) pipeline based on Freesurfer v6.0 (Fischl, 2012). Briefly, the T2w images were co‐registered to the T1w images, followed by registration to the MNI space. Subsequently, cortical surfaces were extracted using Freesurfer and used for estimation of cortical thickness and area. We modified the original Freesurfer pipeline by removing ‐t2pial flag after careful considerations of quality control.
CBF maps were estimated using Bayesian Inference for Arterial Spin Labeling MRI (BASIL) (Chappell, Groves, Whitcher, & Woolrich, 2009) in FSL (Jenkinson, Beckmann, Behrens, Woolrich, & Smith, 2012), with the following parameters: tissue T1 = 1.2 s, arterial T1 = 1.6 s, labeling efficiency = 0.6, bolus arrival time = 1.45 s, bolus duration = 1.45 s, inversion time TI = 3.475 s, delay between the end of labeling and the start of the acquisition 2.025 s and blood–brain barrier coefficient 0.98 ml/g. Equilibrium blood magnetisation was estimated voxel‐wise by using the M0 image. The CBF map was spatially smoothed using an adaptive filter, which exploited neighboring voxel signals on an intensity‐dependent basis, without interacting with non‐linear kinetics where smoothing was unnecessary (Groves, Chappell, & Woolrich, 2009). Due to low spatial resolution of the perfusion image, partial volume error correction was performed to improve the accuracy of CBF estimation (Chappell et al., 2011). CBF maps were mapped to the individual cortical surface from Freesurfer for further analysis.
For between‐subject analysis we extracted values for cortical thickness and area, CBF and T1w/T2w surface ratio from 34 cortical regions of interest (ROIs) in each hemisphere based on the Desikan‐Killiany atlas (Desikan et al., 2006). In addition, we computed the mean CBF and T1w/T2w ratio within 35 subcortical regions based on the automated volume segmentation in Freesurfer (Fischl et al., 2002) (Supplementary material 3).
2.5. Brain age gap calculation
For brain age prediction we subdivided our measures in four cortical feature sets: thickness, area, T1w/T2w ratio and CBF, and three subcortical sets: volumes, T1w/T2w ratio and CBF. We also integrated all T1w image derived measures (area, thickness and volume) into one composite set comprising 171 features, referred as “global‐T1w”. The same procedure was repeated for cortical and subcortical T1w/T2w ratio and CBF. This yielded a set of 103 features for each modality. Finally, we gathered data from all modalities to a single set with 377 features, referred as “global‐multimodal”. We investigated 11 feature sets in total.
Brain age of each individual was calculated by using randomForest package in R (Breiman, 2001), which was chosen for both its resilience to overfitting, few hyperparameters to tune, and its robustness to noise (Boehmke & Greenwell, 2019; Breiman, 2001). To determine the optimal value of predictors sampled for splitting at each node we used tuneRF function from the same library. We grew 5,000 trees, as the more trees provide more robust and stable error estimates and variable importance measures (Boehmke & Greenwell, 2019). First, we divided our sample into HC and patients. For HC, we used 10‐fold cross validation, whereas for the patients the model was trained on all the HC data and subsequently applied to the individual patients. This approach was chosen to keep the relatively few HCs aged 75 years and older (n = 23) in the training set in order to retain predictive power at older ages. Cortical thickness, T1w/T2w ratio and CBF features were residualized for sex using linear models, whereas subcortical volumes and cortical areas were residualized for both sex and intracortical volume (ICV). To account for a well‐known bias in brain age prediction, we residualized brain age with respect to age using linear models (G de Lange & Cole, 2020) (Figures S16‐S17). It was shown that this bias cannot be eliminated neither by selection of the modeling method, nor is dictated by underlying data, but rather by regression to the mean. That is, evaluation extremely deviating from the mean will move closer to the mean, when next prediction is done (Liang, Zhang, & Niu, 2019). Furthermore, to assess their complementary value we estimated Spearman's correlation between BAGs derived from different modalities in HC and applied hierarchical clustering based on Ward's minimum variance criterion (Ward, 1963), as implemented in corrplot R package (Wei & Simko, 2017).
We report root mean squared error (RMSE), mean absolute error (MAE) and shared variance (r2) and Pearson's correlation r between predicted and chronological age as measures of prediction accuracy for all models. Additionally, we calculated 95% confidence intervals for r2 and r using bootstrapping with 5,000 resamplings.
To compare the prediction accuracy of different models, a Z test for correlated samples (Zimmerman, 2012) was performed on run on model‐specific correlations between predicted and chronological age using
where “m1” and “m2” represent model 1 and model 2, the r terms represent the Pearson's r values from the correlations between predicted and chronological age, the σ terms represent the standard errors on the r values, and ρ represents the correlation between predicted age from the two models (we calculated both absolute and adjusted for chronological age).
In order to estimate the features contributing the most to brain age prediction we used mean increase in mean squared error (MSE). This measure quantifies the difference in MSE between randomly shuffled and actual values for the investigated feature, while keeping the rest of the features intact when applied on unseen data. To visualize feature importance MSE was mapped onto segmented brain surface using ggseg R package (Mowinckel & Vidal‐Pieiro, 2019).
2.6. Group comparison
In order to assess group differences between patients and controls we matched subjects to controls with respect to age and sex using nearest neighbor matching with 1:1 ratio and logistic regression distance as implemented in the R package matchIt (Ho, Imai, King, & Stuart, 2007). Demographics for each group comparison are listed in Table S3. Subsequent group tests were performed building a linear model for each case control pair while controlling for age and sex.To correct for multiple tests (5 disorders × 11 modalities, 55 in total), reported p‐values were adjusted using a false discovery rate (FDR) threshold. Additionally, to assess effect sizes we converted t‐statistics to Cohen's d. Lastly, to evaluate classification accuracy of each modality we calculated AUC of ROC for pairwise group classifications of cases and controls for each clinical group directly on BAGs derived from each model. Furthermore, we computed sensitivity and specificity at the optimal cut‐off point. To estimate significance of AUC we performed 5,000 permutations with random shuffling of the group label to build null distributions. The associated p‐value based on the empirical null distribution was adjusted for number of modalities and patient groups using FDR. A two‐class design was chosen due to modest overlap in age between distinct patient groups.
3. RESULTS
3.1. Predicting brain age in healthy controls
To train the model we used data obtained from 750 healthy individuals. The model integrating all modalities and feature sets showed the best fit with r 2 = .77 (MAE = 6.4 years), with global T1w/T2w ratio and global T1w derived features having very similar fits: r 2 = .74 (MAE = 7.0) and r 2 = .72 (MAE = 6.9), respectively (Figure 2(a)). The age prediction performance of the multimodal model was significantly better than all other models (Supplementary Table S4).
FIGURE 2.
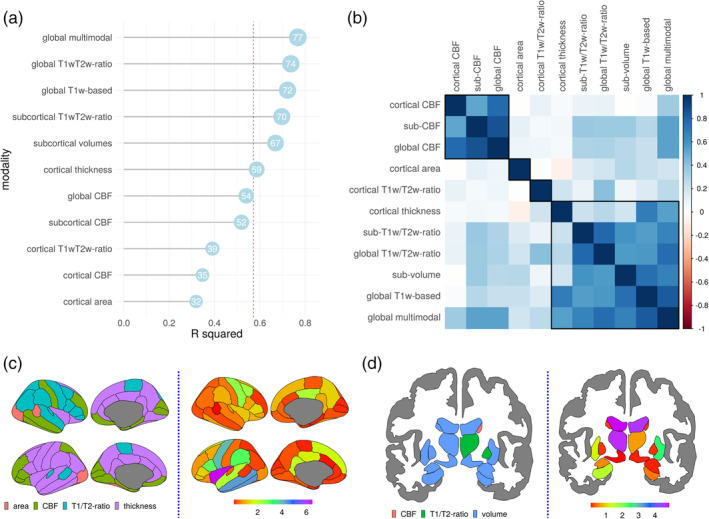
HC model fit. BAGs ranked from the most (top) to the least (bottom) accurate based on out of sample r 2 (multiplied by 100) of the model, shown as a number in a blue circle (a) and BAG Spearman's correlation matrix with four clusters marked by black lines (b). Modality from which a given feature was derived (left) and feature importance measured as increase of MSE (right) shown as a colormap overlaid on the brain for the best model integrating all modalities in cortex (c) and in subcortical structures (d)
Clustering based on Ward's criterion (Figure 2(b)) suggested four main BAG clusters: (a) CBF modalities, (b) cortical T1w/T2w ratio, (c) cortical area, and (d) cortical thickness, subcortical volumes, subcortical T1w/T2w ratio, global T1w/T2w ratio, global T1w based and global multimodal. Fit for other modalities and feature sets with corresponding MAE are listed in Supplementary Table S5. Mean values for each modality were summarized by decades (Figures S2‐S8) as well trajectories of mean cortical (Figures S9‐S12) and hippocampal (S13‐S15) values.
The features contributing most to age prediction in the model comprising all features were predominantly derived from cortical thickness, subcortical volumes and T1w/T2w ratio (Figure 2(c)). The three most contributing features in cortex were T1w/T2w ratio and volume of the third ventricle, and volume of choroid plexus in the left hemisphere. Among the cortical features, the strongest contributors were thickness of insula, followed by left inferior temporal and middle temporal thickness (Figure 2(d)). Among the 20 most predictive features 13 were subcortical (three T1w/T2w ratio and eight subcortical volumes, two CBF), and 7 were cortical (six thickness and one T1w/T2w ratio based). The top 20 features with importance estimates for the best model are given in Supplementary Table S6. Feature importance for other modalities is presented in Supplementary Figures S18 and S19.
3.2. Group differences in BAG
In the second step we applied the models trained on HC to the clinical samples and performed case–control comparison of the resulting BAGs. The results are shown in Figure 3 and Supplementary Figure S20. All modalities apart from the cortical T1w/T2w ratio showed significantly higher BAG in AD compared to HC, with global T1w‐BAG exhibiting largest effect (7.4 years, p < .001, Cohen's d = 1.04), followed by cortical thickness (6.4 years, p < .001, d = 0.98) and cortical CBF (7.9 years, p < .001, d = 0.94).
FIGURE 3.
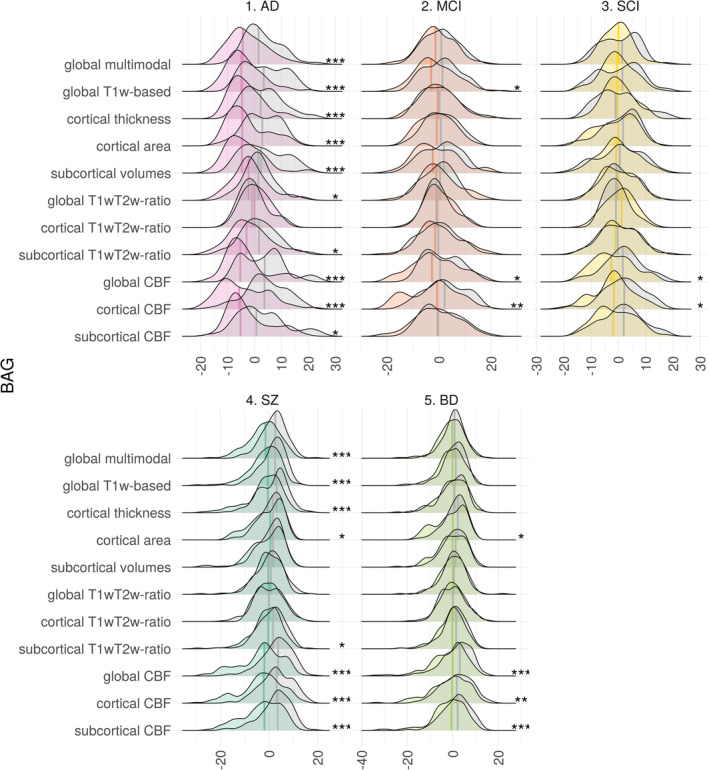
Group comparison of BAG in HC vs patient groups. Both distributions and medians are shown. Asterisks on the right side indicate significant results (FDR corrected), with p < .05, p < .01 and p < .001 being marked as 1 to 3 asterisks, respectively. Distributions for HC are shown in gray
BAG based on global T1w/T2w ratio showed group differences only in AD patients (p < .05, d = 0.50), while having the second best fit in brain age prediction in HC.
Across modalities, mean BAG for AD was on average 5.2 years (d = 0.52) higher than for HC. For MCI and SCI the difference was 1.6 (d = 0.22) and 1.1 (d = 0.21) years, respectively. For MCI and SCI the largest differences from HC were seen in CBF‐based BAGs. For individuals with MCI cortical‐CBF BAG was 4.6 years higher than HC (p < .01, d = 0.53), followed by global CBF (3.2 years, p < .05, d = 0.40) and global T1‐based (2.6 years, p < .05, d = 0.36). For individuals with SCI largest BAG deviations from matched HC were based on cortical CBF with 3.9 years (p < .05, d = 0.54), followed by global CBF (3.7 years, p < .05, d = 0.50). These were the only two BAGs showing significant case–control differences for SCI.
BAG was significantly higher in SZ compared to HC for almost all modalities. The strongest group differences were found for global CBF‐BAG (6.4 years, p < .001, d = 0.84), followed by cortical CBF (6.1 years, p < .001, d = 0.78). Apart from the CBF models, the global multimodal model yielded similar effect size (4.0 years, p < .001, d = 0.70). Across modalities, the average BAG in SZ was 3.1 (d = 0.47) years higher than HC.
For BD, global CBF‐BAG showed largest effect size (3.7 years, p < .001, d = 0.51), followed by subcortical CBF‐BAG (3.2 years, p < .001, d = 0.48) and cortical CBF‐BAG (3.2 years, p < .01, d = 0.41). Across modalities, average BAG in BD was 1.6 (d = 0.27) years higher than HC.
A complete list of results is summarized in Supplementary Table S7.
3.3. BAG classification accuracy
To evaluate classification accuracy of each modality we calculated AUC of ROC for pairwise group classifications of cases and controls for each clinical group. Then, we built a null distribution using 5,000 random permutations to estimate p‐value associated with AUC and FDR corrected it for number of modalities and patient groups. Figure 4 summarizes the main results, and Supplementary Tables S8‐S11 provide a full list of AUC for each modality together with sensitivity and specificity at optimal cut‐off point. Briefly, we found that for AD global‐T1w measures were the most accurate (AUC = 0.78, p < .001) followed by cortical thickness (AUC = 0.77, p < .001) and subcortical volumes together with global‐CBF (both, AUC = 0.75, p < .001). For MCI cortical CBF‐BAG (AUC = 0.63, p < .01), followed by global T1w‐based together with global‐CBF (both, AUC = 0.60, p < .05). Lastly, for SCI global and cortical CBF‐BAG were most discriminative (both, AUC = 0.65, p < .01). In psychiatric disorders, SZ was most distinguishable using BAG based on CBF based features global (AUC = 0.72, p < .001), cortical CBF (AUC = 0.71, p < .001) and subcortical (AUC = 0.71, p < .001). BD showed consistently lower accuracy as compared to SZ, with highest AUC scores again from CBF modalities global‐ (AUC = 0.63, p < .001), subcortical (AUC = 0.63, p < .001) and cortical CBF (both AUC = 0.64, p < .01).
FIGURE 4.
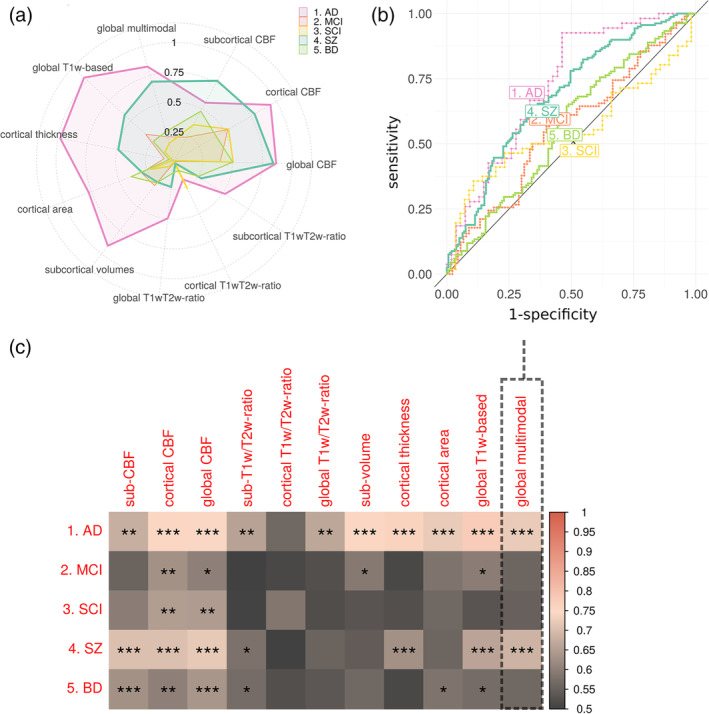
AUC for each group comparison and modality. Spider plot of effect sizes for disorders (a). Receiver operating characteristics (b) are shown for the most accurate model in HC (multimodal) in the AUC matrix. Asterisks indicate significant results (FDR corrected), with p < .05, p < .01 and p < .001 being marked as one to three asterisks, respectively (c)
4. DISCUSSION
In this study, we investigated deviations between chronological age and brain age based on multiple brain imaging modalities, including T1w, T2w and ASL data, which all convey distinct biological information. We found high age prediction accuracy for most of the included MRI features in healthy participants, with highest accuracy for the model including all available features. Subsequent case–control comparisons revealed high sensitivity to group differences, with varying performance of the single‐modality BAGs, likely corresponding to the distinct underlying neurobiology of each disorder. This demonstrates that brain age aberrations of brain diseases are better characterized and differentiated using multimodal as compared to unimodal imaging approaches.
Highest age prediction accuracy in HC was achieved when integrating all features from all modalities, followed by global T1w/T2w ratio and global T1w‐based features. Estimates of feature importance revealed that the model integrating all modalities was mostly driven by cortical thickness, T1w/T2w ratio and subcortical volumes. The lifespan trajectories derived from these features have been described in several studies. For example, cortical thickness and subcortical volumes decrease monotonically throughout the adult lifespan (Fjell et al., 2015; Li et al., 2014; Westlye et al., 2010). Conversely, the lifespan trajectory of the intra‐cortical T1w/T2w ratio has been characterized by a global increase until the end of the 30s, followed by a period of relative stability and subsequent decrease from the end of sixth decade of life (Grydeland, Walhovd, et al., 2013a), which is largely in line with our observations. The models with the lowest age prediction accuracy in HC were based on CBF as well as the features derived from cortical area. Previous studies have shown that CBF is highest in children, followed by slow decreases into adolescence until early adulthood, and a period of modest and relatively stable decline until the age of 80 (Biagi et al., 2007; Haller et al., 2016). Such trajectories are in line with our data, and correspond with the moderate performance of CBF for brain age prediction. Additionally, cortical area, while showing a steady age‐related decrease starting in the early twenties, is less affected throughout the adult lifespan as compared to cortical thickness or volumes (Storsve et al., 2014).
The prediction performance in the patient populations varied across the different disorders. T1w‐based BAGs were most robust in classifying AD, and also to some extent in SZ and BD. In general, the results were in line with a recent large‐scale implementation focusing on T1w‐based age prediction (Kaufmann et al., 2019) and deep neural networks implementation of brain age prediction (Bashyam et al., 2020). Comparison of effect sizes and AUC with (Kaufmann et al., 2019) and (Bashyam et al., 2020) studies are given in supplementary Tables S12 and S13. Consistent with (Bashyam et al., 2020), the most accurate modalities in age prediction did not necessarily lead to the best results in discriminating between disorders as features informative for aging are not necessarily involved in the pathophysiological mechanisms of brain disorders.
Model fit discrepancies between the current and prior T1w based BAG studies (Bashyam et al., 2020; Beheshti, Maikusa, & Matsuda, 2018; Beheshti, Mishra, Sone, Khanna, & Matsuda, 2020) could presumably be partly explained by the application of voxelwise features versus summary statistics based on Freesurfer atlases and parcellation schemes, as well as differences in analysis pipelines and algorithms used. Furthermore, age prediction accuracy has been shown to depend on sample characteristics including sample size and age range (de Lange et al., 2020).
We identified significantly higher BAG in SZ but not in BD compared to HC using T1w based features, though effect sizes in both cases were comparable to (Kaufmann et al., 2019). Compared to healthy participants, patients with SZ and BD were shown to have thinner cortex as well as smaller global and regional brain volumes (Boos, Aleman, Cahn, Pol, & Kahn, 2007; Hibar et al., 2016; Hibar et al., 2018), with smaller effects in BD patients (Yao et al., 2017). In line with previous studies (Hajek et al., 2017; Kaufmann et al., 2019) our current analysis supported that T1w based BAG in BD was lower than in SZ. Additionally, CBF based features and cortical area showed significantly increased BAG for BD patients. Compared to their healthy peers, patients with BD have also previously been shown to have lower CBF (Toma, MacIntosh, Swardfager, & Goldstein, 2018). In general, our results are comparable with classification accuracies reported in other T1w based studies (Nunes et al., 2018; Rocha‐Rego et al., 2014; Schnack et al., 2014).
CBF‐based BAG also revealed large deviations between HC and SZ. Altered CBF has previously been reported in patients with SZ across a range of brain regions including temporal and parietal lobes, middle frontal gyrus, left putamen as well as superior corona radiata (Pinkham et al., 2011; Stegmayer et al., 2017). Several of these features, including CBF in the inferior temporal lobe were also among top features in our age prediction model trained on HC. Hence, the deviations in blood flow may index biological processes mimicking pathogenic brain aging in this patient group, contributing to the structural and functional detrimental alterations corroborated by previous studies (Miho, Noriko, & Junko, 2018; Pinkham et al., 2011; Stegmayer et al., 2017).
Assuming that AD reflects a clinical endpoint of chronic deleterious neurodegenerative processes emerging decades prior to symptom onset (Elliott et al., 2019), it is crucial to identify surrogate biomarkers that would be sensitive to early changes when the potential for interventions may be largest. In the neurodegeneration model of AD, the structural brain changes captured by T1w are preceded by metabolic modulations (Jack et al., 2010). Regions with altered metabolism have been linked with altered perfusion in patients with AD (Riederer et al., 2018). Interestingly, BAG based on cortical CBF had the highest prediction accuracy both in SCI and in MCI, supporting the overall utility of CBF as a sensitive imaging marker of neurovascular and metabolic processes in early phases of dementia. No other modalities revealed significant differences between HC and SCI.
Global T1w/T2w ratio resulted in the second highest age prediction accuracy in HC, but the corresponding BAGs showed only modest case–control difference in AD patients. The global model was mostly driven by subcortical T1w/T2w ratio, whereas the cortical T1w/T2w ratio had poorer performance in predicting age in HC. The T1w/T2w ratio intensity measure is assumed to be inversely proportional to cortical myelination and informative for cortical parcellation and structure–function brain mapping (Glasser et al., 2016). However, T1w/T2w ratio is probably not specifically related to myelin content, suggesting a more complex underlying biology (Hagiwara et al., 2018; Ritchie, Pantazatos, & French, 2018). We found global T1w/T2w based BAG to be affected in patients with AD. This is in line with evidence indicating lower cortical and subcortical T1w/T2w ratio in patients with AD (Luo et al., 2019), though conflicting reports exist (Pelkmans et al., 2019).
Brain aging is a highly heterogenous process and the current study could be improved by inclusion of white matter diffusion MRI (dMRI) measures, which comprises distinct tissue class with largely differential biological and environmental modifiers and age trajectories (Beck et al., 2021; Westlye et al., 2010b). Brain age of white matter can be assessed using modalities derived from diffusion tensor imaging (DTI) and serves to represent a partly independent process of brain aging compared to brain age based on gray matter measures (Richard et al., 2018). Diffusion weighted imaging‐based metrics were shown to have high sensitivity to age, with conventional DTI modalities being among the best in age prediction (Beck et al., 2021). In addition, DTI‐based brain age prediction revealed group differences between patients with SZ and HC in a recent multi‐site study (Tønnesen et al., 2020). Further, DTI in combination with other modalities has been shown to be beneficial to brain age prediction accuracy (Cherubini et al., 2016; Niu et al., 2020) and is one of the possible future directions towards better prediction and characterization of brain age.
The current results should be interpreted in light of some limitations. First, the prediction performance (AUC < 0.70) in the patient populations is too low for clinical utility, and was used in the present study to compare the different models. Second, our cross‐sectional design does not allow us to disentangle the temporal dynamics of the brain aging process, and it remains unclear to which degree the increased BAG in a range of investigated disorders was due to age‐related deterioration of the brain or already present since early childhood. Third, we had a modest number of subjects from a relatively small geographical area, therefore an independent validation and generalization of our results is warranted. Further, we had only 23 HC above 75 years of age, therefore results related to mentioned age range should be treated with caution. Lastly, disorders spanned over disparate age ranges, hence we could not compare them directly. Future studies are also needed to delineate the unique and additive contribution of genetic and environmental variables on the observed group differences. For example, in line with most clinical studies our study design does not allow us to differentiate the effects of disease mechanisms from secondary causes such as lifestyle and medication. This study has several advantages, our study while being cross‐sectional covered the whole adult age span. Moreover, all imaging data were obtained on the same scanner using identical sequences and processed using an identical pipeline.
In summary, we have demonstrated that combining all MRI features yields the highest age prediction accuracy in healthy individuals. Still, global‐T1w based BAG also shows high accuracy in HC and is among the most accurate in discriminating disorders. Nevertheless, it is beneficial to add modalities as it can improve disorder discrimination accuracy, suggesting metabolic and neurovascular aberrations in prodromal phases of neurodegenerative diseases and SZ. Together, these findings indicate that multidimensional neuroimaging of patients may provide a brain‐based mapping of overlapping and distinct pathophysiology in common disorders of the brain using multimodal imaging.
Supporting information
Appendix S1: Supporting Information
ACKNOWLEDGMENTS
The study is supported by ERA‐Net Cofund through the ERA PerMed project “IMPLEMENT”, the Research Council of Norway (223273, 249795, 248238, 276082, 286838, 298646, 300767), the South‐Eastern Norway Regional Health Authority (2014097, 2015044, 2015073, 2016083, 2018037, 2018076, 2019101), the Norwegian ExtraFoundation for Health and Rehabilitation (2015/FO5146), the Novo Nordisk Foundation (NNF16OC0019856), KG Jebsen Stiftelsen, and the European Research Council under the European Union's Horizon 2020 research and Innovation program (ERC StG, Grant 802998). Open access funding enabled and organized by Projekt DEAL.
Rokicki J, Wolfers T, Nordhøy W, et al. Multimodal imaging improves brain age prediction and reveals distinct abnormalities in patients with psychiatric and neurological disorders. Hum Brain Mapp. 2021;42:1714–1726. 10.1002/hbm.25323
Funding information ERA PerMed, Grant/Award Number: IMPLEMENT; Horizon 2020 Framework Programme, Grant/Award Number: ERC StG, Grant 802998; Norges Forskningsråd, Grant/Award Numbers: 223273, 248238, 249795, 276082, 286838, 298646, 300767; the Norwegian ExtraFoundation for Health and Rehabilitation, Grant/Award Number: 2015/FO5146; the Novo Nordisk Foundation, Grant/Award Number: NNF16OC0019856; the South‐Eastern Norway Regional Health Authority, Grant/Award Numbers: 2014097, 2015044, 2015073, 2016083, 2018037, 2018076, 2019101
Contributor Information
Jaroslav Rokicki, Email: jaroslav.rokicki@psykologi.uio.no.
Lars T. Westlye, Email: l.t.westlye@psykologi.uio.no.
DATA AVAILABILITY STATEMENT
Due to ethical and data security issues related to the sensitive nature of the clinical data we are not allowed to share the data without specific IRB approval and data use agreements with the relevant institution. More information can be obtained through the corresponding authors: Jaroslav Rokicki (jaroslav.rokicki@psykologi.uio.no) or Lars Tjelta Westlye (l.t.westlye@psykologi.uio.no)
REFERENCES
- Bartzokis, G. (2011). Alzheimer's disease as homeostatic responses to age‐related myelin breakdown. Neurobiology of Aging, 32(8), 1341–1371. 10.1016/j.neurobiolaging.2009.08.007 [DOI] [PMC free article] [PubMed] [Google Scholar]
- Bashyam, V. M. , Erus, G. , Doshi, J. , Habes, M. , Nasralah, I. , Truelove‐Hill, M. , et al. (2020). MRI signatures of brain age and disease over the lifespan based on a deep brain network and 14 468 individuals worldwide. Brain, 143(7), 2312–2324. 10.1093/brain/awaa160 [DOI] [PMC free article] [PubMed] [Google Scholar]
- Beck, D. , de Lange, A.‐M. G. , Maximov, I. I. , Richard, G. , Andreassen, O. A. , Nordvik, J. E. , & Westlye, L. T. (2021). White matter microstructure across the adult lifespan: A mixed longitudinal and cross‐sectional study using advanced diffusion models and brain‐age prediction. NeuroImage, 224, 117441. 10.1016/j.neuroimage.2020.117441 [DOI] [PubMed] [Google Scholar]
- Beheshti, I. , Maikusa, N. , & Matsuda, H. (2018). The association between “brain‐age score” (bas) and traditional neuropsy‐ chological screening tools in alzheimer's disease. Brain and Behavior, 8(8), e01020. [DOI] [PMC free article] [PubMed] [Google Scholar]
- Beheshti, I. , Mishra, S. , Sone, D. , Khanna, P. , & Matsuda, H. (2020). T1‐weighted mri‐driven brain age estimation in alzheimer's disease and parkinson's disease. Aging and Disease, 11(3), 618–628. [DOI] [PMC free article] [PubMed] [Google Scholar]
- Biagi, L. , Abbruzzese, A. , Bianchi, M. C. , Alsop, D. C. , Del Guerra, A. , & Tosetti, M. (2007). Age dependence of cerebral perfusion assessed by magnetic resonance continuous arterial spin labeling. Journal of Magnetic Resonance Imaging, 25(4), 696–702. 10.1002/jmri.20839 [DOI] [PubMed] [Google Scholar]
- Boehmke, Brad , and Greenwell Brandon. 2019. Hands‐on machine learning with R. Boca Raton, FL: CRC Press. [Google Scholar]
- Boos, H. B. M. , Aleman, A. , Cahn, W. , Pol, H. H. , & Kahn, R. S. (2007). Brain volumes in relatives of patients with schizophrenia: A meta‐analysis. Archives of General Psychiatry, 64(3), 297–304. 10.1001/archpsyc.64.3.297 [DOI] [PubMed] [Google Scholar]
- Breiman, L. (2001). Random forests. Machine Learning, 45(1), 5–32. 10.1023/A:1010933404324 [DOI] [Google Scholar]
- Brown, T. , Kuperman, J. , Chung, Y. , Erhart, M. , McCabe, C. , Hagler, D. J. , et al. (2012). Neuroanatomical assessment of biological maturity. Current Biology, 22(18), 1693–1698. 10.1016/j.cub.2012.07.002 [DOI] [PMC free article] [PubMed] [Google Scholar]
- Chappell, M. A. , Groves, A. R. , MacIntosh, B. J. , Donahue, M. J. , Jezzard, P. , & Woolrich, M. W. (2011). Partial volume correction of multiple inversion time arterial spin labeling Mri data. Magnetic Resonance in Medicine, 65(4), 1173–1183. 10.1002/mrm.22641 [DOI] [PubMed] [Google Scholar]
- Chappell, M. A. , Groves, A. R. , Whitcher, B. , & Woolrich, M. W. (2009). Variational Bayesian inference for a nonlinear forward model. IEEE Transactions on Signal Processing, 57(1), 223–236. 10.1109/TSP.2008.2005752 [DOI] [Google Scholar]
- Cherubini, A. , Caligiuri, M. E. , Péran, P. , Sabatini, U. , Cosentino, C. , & Amato, F. (2016). Importance of multimodal Mri in characterizing brain tissue and its potential application for individual age prediction. IEEE Journal of Biomedical and Health Informatics, 20(5), 1232–1239. 10.1109/JBHI.2016.2559938 [DOI] [PubMed] [Google Scholar]
- Cole, J. H. (2020). Multimodality neuroimaging brain‐age in UKbiobank: Relationship to biomedical, lifestyle, and cognitive factors. Neurobiology of Aging, 92, 34–42. 10.1016/j.neurobiolaging.2020.03.014 [DOI] [PMC free article] [PubMed] [Google Scholar]
- Cole, J. H. , & Franke, K. (2017). Predicting age using neuroimaging: Innovative brain ageing biomarkers. Trends in Neurosciences, 40(12), 681–690. 10.1016/j.tins.2017.10.001 [DOI] [PubMed] [Google Scholar]
- Davis, K. L. , Stewart, D. G. , Friedman, J. I. , Buchsbaum, M. , Harvey, P. D. , Hof, P. R. , … Haroutunian, V. (2003). White matter changes in schizophrenia: Evidence for myelin‐related dysfunction. Archives of General Psychiatry, 60(5), 443–456. 10.1001/archpsyc.60.5.443 [DOI] [PubMed] [Google Scholar]
- Lange, d. , Ann‐Marie, G. , Anatürk, M. , Suri, S. , Kaufmann, T. , Cole, J. H. , et al. (2020). Multimodal brain‐age prediction and cardiovascular risk: The Whitehall ii Mri sub‐study. NeuroImage, 222, 117292. 10.1016/j.neuroimage.2020.117292 [DOI] [PMC free article] [PubMed] [Google Scholar]
- Desikan, R. S. , Ségonne, F. , Fischl, B. , Quinn, B. T. , Dickerson, B. C. , Blacker, D. , … Killiany, R. J. (2006). An automated labeling system for subdividing the human cerebral cortex on Mri scans into Gyral based regions of interest. NeuroImage, 31(3), 968–980. 10.1016/j.neuroimage.2006.01.021 [DOI] [PubMed] [Google Scholar]
- Elliott, M. L. , Belsky, D. W. , Knodt, A. R. , Ireland, D. , Melzer, T. R. , Poulton, R. , … Hariri, A. R. (2019). Brain‐age in midlife is associated with accelerated biological aging and cognitive decline in a longitudinal birth cohort. Molecular Psychiatry. 10.1038/s41380-019-0626-7 [DOI] [PMC free article] [PubMed] [Google Scholar]
- Engemann, D. A. , Kozynets, O. , Sabbagh, D. , Lemaître, G. , Varoquaux, G. , Liem, F. , & Gramfort, A. (2020). “Combining magnetoencephalography with magnetic resonance imaging enhances learning of surrogate‐biomarkers.” edited by Alexander Shackman. eLife, 9, e54055. 10.7554/eLife54055 [DOI] [PMC free article] [PubMed] [Google Scholar]
- Esteban, D. A. N. D. S. , & Birman, O. A. N. D. (2017). MRIQC: Advancing the automatic prediction of image quality in Mri from unseen sites. PLoS One, 12(9), 1–21. 10.1371/journal.pone.0184661 [DOI] [PMC free article] [PubMed] [Google Scholar]
- Fischl, B. (2012). FreeSurfer. NeuroImage, 62(2), 774–781. 10.1016/j.neuroimage.2012.01.021 [DOI] [PMC free article] [PubMed] [Google Scholar]
- Fischl, B. , Salat, D. H. , Busa, E. , Albert, M. , Dieterich, M. , Haselgrove, C. , … Dale, A. M. (2002). Whole brain segmentation: Automated labeling of neuroanatomical structures in the human brain. Neuron, 33, 341–355. [DOI] [PubMed] [Google Scholar]
- Fjell, A. M. , Grydeland, H. , Krogsrud, S. K. , Amlien, I. , Rohani, D. A. , Ferschmann, L. , … Walhovd, K. B. (2015). Development and aging of cortical thickness correspond to genetic organization patterns. Proceedings of the National Academy of Sciences, 112(50), 15462–15467. 10.1073/pnas.1508831112 [DOI] [PMC free article] [PubMed] [Google Scholar]
- Ganzetti, M. , Wenderoth, N. , & Mantini, D. (2015). Mapping pathological changes in brain structure by combining T1‐ and T2‐weighted Mr imaging data. Neuroradiology, 57(9), 917–928. 10.1007/s00234-015-1550-4 [DOI] [PMC free article] [PubMed] [Google Scholar]
- Gaser, K. A. N. D. K. , & Franke, C. A. N. D. (2013). BrainAGE in mild cognitive impaired patients: Predicting the conversion to Alzheimer's disease. PLoS One, 8(6), 1–15. 10.1371/journal.pone.0067346 [DOI] [PMC free article] [PubMed] [Google Scholar]
- de Lange G, Ann‐Marie, and Cole James. 2020. “Commentary: Correction procedures in brain‐age prediction.” NeuroImage: Clinical 26: 102229. 10.1016/j.nicl.2020.102229. [DOI] [PMC free article] [PubMed] [Google Scholar]
- Glasser, M. F. , Coalson, T. S. , Robinson, E. C. , Hacker, C. D. , Harwell, J. , Yacoub, E. , … van Essen, D. C. (2016). A multi‐modal Parcellation of human cerebral cortex. Nature, 536(7615), 171–178. 10.1038/nature18933 [DOI] [PMC free article] [PubMed] [Google Scholar]
- Groves, A. R. , Chappell, M. A. , & Woolrich, M. W. (2009). Combined spatial and non‐spatial prior for inference on Mri time‐series. NeuroImage, 45(3), 795–809. 10.1016/j.neuroimage.2008.12.027 [DOI] [PubMed] [Google Scholar]
- Grydeland, H. , Vértes, P. E. , Váša, F. , Romero‐Garcia, R. , Whitaker, K. , Alexander‐Bloch, A. F. , … Bullmore, E. T. (2018). Waves of maturation and senescence in micro‐structural MRI markers of human cortical myelination over the lifespan. Cerebral Cortex, 29(3), 1369–1381. 10.1093/cercor/bhy330 [DOI] [PMC free article] [PubMed] [Google Scholar]
- Grydeland, H. , Walhovd, K. B. , Tamnes, C. K. , Westlye, L. T. , & Fjell, A. M. (2013a). Intracortical myelin links with performance variability across the human lifespan: Results from T1‐ and T2‐weighted Mri myelin mapping and diffusion tensor imaging. Journal of Neuroscience, 33(47), 18618–18630. 10.1523/JNEUROSCI.2811-13.2013 [DOI] [PMC free article] [PubMed] [Google Scholar]
- Hagiwara, A. , Hori, M. , Kamagata, K. , Warntjes, M. , Matsuyoshi, D. , Nakazawa, M. , et al. (2018). Myelin measurement: Comparison between simultaneous tissue Relaxometry, magnetization transfer saturation index, and T(1)w/T(2)w ratio methods. Scientific Reports, 8(1), 10554–10554. 10.1038/s41598-018-28852-6 [DOI] [PMC free article] [PubMed] [Google Scholar]
- Hajek, T. , Franke, K. , Kolenic, M. , Capkova, J. , Matejka, M. , Propper, L. , … Alda, M. (2017). Brain age in early stages of bipolar disorders or schizophrenia. Schizophrenia Bulletin, 45(1), 190–198. 10.1093/schbul/sbx172 [DOI] [PMC free article] [PubMed] [Google Scholar]
- Haller, S. , Zaharchuk, G. , Thomas, D. L. , Lovblad, K.‐O. , Barkhof, F. , & Golay, X. (2016). Arterial spin labeling perfusion of the brain: Emerging clinical applications. Radiology, 281(2), 337–356. 10.1148/radiol.2016150789 [DOI] [PubMed] [Google Scholar]
- Hibar, D. P. , Westlye, L. T. , Doan, N. T. , Jahanshad, N. , Cheung, J. W. , Ching, C. R. K. , et al. (2018). Cortical abnormalities in bipolar disorder: An Mri analysis of 6503 individuals from the Enigma bipolar disorder working group. Molecular Psychiatry, 23(4), 932–942. 10.1038/mp.2017.73 [DOI] [PMC free article] [PubMed] [Google Scholar]
- Hibar, D. P. , Westlye, L. T. , van Erp, T. G. M. , Rasmussen, J. , Leonardo, C. D. , Faskowitz, J. , et al. (2016). Subcortical volumetric abnormalities in bipolar disorder. Molecular Psychiatry, 21(12), 1710–1716. 10.1038/mp.2015.227 [DOI] [PMC free article] [PubMed] [Google Scholar]
- Ho, D. E. , Imai, K. , King, G. , & Stuart, E. A. (2007). Matching as nonparametric preprocessing for reducing model dependence in parametric causal inference. Political Analysis, 15(3), 199–236. 10.1093/pan/mpl013 [DOI] [Google Scholar]
- Ishida, T. , Donishi, T. , Iwatani, J. , Yamada, S. , Takahashi, S. , Ukai, S. , … Kaneoke, Y. (2017). Elucidating the aberrant brain regions in bipolar disorder using T1‐weighted/T2‐weighted magnetic resonance ratio images. Psychiatry Research: Neuroimaging, 263, 76–84. 10.1016/j.pscychresns.2017.03.006 [DOI] [PubMed] [Google Scholar]
- Iwatani, J. , Ishida, T. , Donishi, T. , Ukai, S. , Shinosaki, K. , Terada, M. , & Kaneoke, Y. (2015). Use of T1‐weighted/T2‐weighted magnetic resonance ratio images to elucidate changes in the schizophrenic brain. Brain and Behavior, 5(10), e00399–e00399. 10.1002/brb3.399 [DOI] [PMC free article] [PubMed] [Google Scholar]
- Jack, C. R. , Knopman, D. S. , Jagust, W. J. , Shaw, L. M. , Aisen, P. S. , Weiner, M. W. , … Trojanowski, J. Q. (2010). Hypothetical model of dynamic biomarkers of the Alzheimer's pathological Cascade. The Lancet Neurology, 9(1), 119–128. 10.1016/S1474-4422(09)70299-6 [DOI] [PMC free article] [PubMed] [Google Scholar]
- Jenkinson, M. , Beckmann, C. F. , Behrens, T. E. J. , Woolrich, M. W. , & Smith, S. M. (2012). FSL. NeuroImage, 62(2), 782–790. 10.1016/j.neuroimage.2011.09.015 [DOI] [PubMed] [Google Scholar]
- Jungerius, B. J. , Hoogendoorn, M. L. C. , Bakker, S. C. , van't Slot, R. , Bardoel, A. F. , Ophoff, R. A. , … Sinke, R. J. (2008). An association screen of myelin‐related genes implicates the chromosome 22q11 Pik4ca gene in schizophrenia. Molecular Psychiatry, 13(11), 1060–1068. 10.1038/sj.mp.4002080 [DOI] [PubMed] [Google Scholar]
- Kaufmann, T. , van der Meer, D. , Doan, N. T. , Schwarz, E. , Lund, M. J. , Agartz, I. , et al. (2019). Common brain disorders are associated with heritable patterns of apparent aging of the brain. Nature Neuroscience, 22(10), 1617–1623. 10.1038/s41593-019-0471-7 [DOI] [PMC free article] [PubMed] [Google Scholar]
- Lee, P. R. , & Douglas Fields, R. (2009). Regulation of myelin genes implicated in psychiatric disorders by functional activity in axons. Frontiers in Neuroanatomy, 3(June), 4–4. 10.3389/neuro.05.004.2009 [DOI] [PMC free article] [PubMed] [Google Scholar]
- Li, W. , van Tol, M.‐J. , Li, M. , Miao, W. , Jiao, Y. , Heinze, H.‐J. , … Walter, M. (2014). Regional specificity of sex effects on subcortical volumes across the lifespan in healthy aging. Human Brain Mapping, 35(1), 238–247. 10.1002/hbm.22168 [DOI] [PMC free article] [PubMed] [Google Scholar]
- Liang, H. , Zhang, F. , & Niu, X. (2019). Investigating systematic bias in brain age estimation with application to post‐traumatic stress disorders. Human Brain Mapping, 40(11), 3143–3152. 10.1002/hbm.24588 [DOI] [PMC free article] [PubMed] [Google Scholar]
- Liem, F. , Varoquaux, G. , Kynast, J. , Beyer, F. , Kharabian, S. , Masouleh, J. M. , et al. (2017). Predicting brain‐age from multimodal imaging data captures cognitive impairment. NeuroImage, 148, 179–188. 10.1016/j.neuroimage.2016.11.005 [DOI] [PubMed] [Google Scholar]
- Luo, X. , Li, K. , Zeng, Q. , Huang, P. , Jiaerken, Y. , Wang, S. , … Zhang, M. (2019). Application of T1−/T2‐weighted ratio mapping to elucidate intracortical demyelination process in the Alzheimer's disease continuum. Frontiers in Neuroscience, 13, 904. 10.3389/fnins.2019.00904 [DOI] [PMC free article] [PubMed] [Google Scholar]
- Modinos, G. , Egerton, A. , McMullen, K. , McLaughlin, A. , Kumari, V. , Barker, G. J. , … Zelaya, F. (2018). Increased resting perfusion of the hippocampus in high positive Schizotypy: A Pseudocontinuous arterial spin labeling study. Human Brain Mapping, 39(10), 4055–4064. 10.1002/hbm.24231 [DOI] [PMC free article] [PubMed] [Google Scholar]
- Mowinckel, Athanasia M. , and Vidal‐Pieiro Didac. 2019. “Visualisation of Brain Statistics with R‐Packages Ggseg and Ggseg3d.” http://arxiv.org/abs/1912.08200.
- Niu, X. , Zhang, F. , Kounios, J. , & Liang, H. (2020). Improved prediction of brain age using multimodal neuroimaging data. Human Brain Mapping, 41(6), 1626–1643. 10.1002/hbm.24899 [DOI] [PMC free article] [PubMed] [Google Scholar]
- Norbom, L. B. , Doan, N. T. , Alnæs, D. , Kaufmann, T. , Moberget, T. , Rokicki, J. , … Tamnes, C. K. (2019). Probing brain developmental patterns of myelination and associations with psychopathology in youths using Gray/White matter contrast. Biological Psychiatry, 85(5), 389–398. 10.1016/j.biopsych.2018.09.027 [DOI] [PubMed] [Google Scholar]
- Nunes, A. , Schnack, H. G. , Ching, C. R. K. , Agartz, I. , Akudjedu, T. N. , Alda, M. , et al. (2018). Using structural Mri to identify bipolar disorders – 13 site machine learning study in 3020 individuals from the Enigma bipolar disorders working group. Molecular Psychiatry, 25(9), 2130–2143. 10.1038/s41380-018-0228-9 [DOI] [PMC free article] [PubMed] [Google Scholar]
- Miho, O. , Noriko, S. , & Junko, M. (2018). Relationship between autistic Spectrum trait and regional cerebral blood flow in healthy male subjects. Psychiatry Investigation, 15(10), 956–961. 10.30773/pi.2018.07.27 [DOI] [PMC free article] [PubMed] [Google Scholar]
- Pelkmans, W. , Dicks, E. , Barkhof, F. , Vrenken, H. , Scheltens, P. , van der Flier, W. M. , & Tijms, B. M. (2019). Gray matter T1‐W/T2‐W ratios are higher in Alzheimer's disease. Human Brain Mapping, 40(13), 3900–3909. 10.1002/hbm.24638 [DOI] [PMC free article] [PubMed] [Google Scholar]
- Pinkham, A. , Loughead, J. , Ruparel, K. , Wu, W.‐C. , Overton, E. , Gur, R. , & Gur, R. (2011). Resting quantitative cerebral blood flow in schizophrenia measured by pulsed arterial spin labeling perfusion Mri. Psychiatry Research: Neuroimaging, 194(1), 64–72. 10.1016/j.pscychresns.2011.06.013 [DOI] [PMC free article] [PubMed] [Google Scholar]
- Richard, G. , Kolskår, K. , Sanders, A.‐M. , Kaufmann, T. , Petersen, A. , Doan, N. T. , et al. (2018). Assessing distinct patterns of cognitive aging using tissue‐specific brain age prediction based on diffusion tensor imaging and brain morphometry. PeerJ, 6(November), e5908. 10.7717/peerj.5908 [DOI] [PMC free article] [PubMed] [Google Scholar]
- Riederer, I. , Bohn, K. P. , Preibisch, C. , Wiedemann, E. , Zimmer, C. , Alexopoulos, P. , & Förster, S. (2018). Alzheimer disease and mild cognitive impairment: Integrated pulsed arterial spin‐labeling Mri and 18F‐Fdg pet. Radiology, 288(1), 198–206. 10.1148/radiol.2018170575 [DOI] [PubMed] [Google Scholar]
- Ritchie, J. , Pantazatos, S. P. , & French, L. (2018). Transcriptomic characterization of Mri contrast with focus on the T1‐W/T2‐W ratio in the cerebral cortex. NeuroImage, 174, 504–517. 10.1016/j.neuroimage.2018.03.027 [DOI] [PMC free article] [PubMed] [Google Scholar]
- Rocha‐Rego, V. , Jogia, J. , Marquand, A. F. , Mourao‐Miranda, J. , Simmons, A. , & Frangou, S. (2014). Examination of the predictive value of structural magnetic resonance scans in bipolar disorder: A pattern classification approach. Psychological Medicine, 44(3), 519–532. 10.1017/S0033291713001013 [DOI] [PMC free article] [PubMed] [Google Scholar]
- Ruderfer, D. M. , Ripke, S. , McQuillin, A. , Boocock, J. , Stahl, E. A. , Pavlides, J. M. W. , … Kendler, K. S. (2018). Genomic dissection of bipolar disorder and schizophrenia, including 28 subphenotypes. Cell, 173(7), 1705–1715.e16. 10.1016/j.cell.2018.05.046 [DOI] [PMC free article] [PubMed] [Google Scholar]
- Schnack, H. G. , Nieuwenhuis, M. , van Haren, N. E. M. , Abramovic, L. , Scheewe, T. W. , Brouwer, R. M. , … Kahn, R. S. (2014). Can structural Mri aid in clinical classification? A machine learning study in two independent samples of patients with schizophrenia, bipolar disorder and healthy subjects. NeuroImage, 84, 299–306. 10.1016/j.neuroimage.2013.08.053 [DOI] [PubMed] [Google Scholar]
- Smith, S. M. , Elliott, L. T. , Alfaro‐Almagro, F. , McCarthy, P. , Nichols, T. E. , Douaud, G. , & Miller, K. L. (2020). Brain aging comprises many modes of structural and functional change with distinct genetic and biophysical associations. eLife, 9, e52677. 10.7554/eLife.52677 [DOI] [PMC free article] [PubMed] [Google Scholar]
- Stegmayer, K. , Strik, W. , Federspiel, A. , Wiest, R. , Bohlhalter, S. , & Walther, S. (2017). Specific cerebral perfusion patterns in three schizophrenia symptom dimensions. Schizophrenia Research, 190, 96–101. 10.1016/j.schres.2017.03.018 [DOI] [PubMed] [Google Scholar]
- Stokowy, T. , Polushina, T. , Sønderby, I. E. , Karlsson, R. , Giddaluru, S. , Le Hellard, S. , et al. (2018). Genetic variation in 117 myelination‐related genes in schizophrenia: Replication of association to lipid biosynthesis genes. Scientific Reports, 8(1), 6915. 10.1038/s41598-018-25280-4 [DOI] [PMC free article] [PubMed] [Google Scholar]
- Storsve, A. B. , Fjell, A. M. , Tamnes, C. K. , Westlye, L. T. , Overbye, K. , Aasland, H. W. , & Walhovd, K. B. (2014). Differential longitudinal changes in cortical thickness, surface area and volume across the adult life span: Regions of accelerating and decelerating change. Journal of Neuroscience, 34(25), 8488–8498. 10.1523/JNEUROSCI.0391-14.2014 [DOI] [PMC free article] [PubMed] [Google Scholar]
- Toma, S. , MacIntosh, B. J. , Swardfager, W. , & Goldstein, B. I. (2018). Cerebral blood flow in bipolar disorder: A systematic review. Journal of Affective Disorders, 241, 505–513. 10.1016/j.jad.2018.08.040 [DOI] [PubMed] [Google Scholar]
- Tønnesen, S. , Kaufmann, T. , de Lange, A.‐M. G. , Richard, G. , Doan, N. T. , Alnæs, D. , … Sellgren, C. (2020). Brain age prediction reveals aberrant brain White matter in schizophrenia and bipolar disorder: A multisample diffusion tensor imaging study. Biological Psychiatry: Cognitive Neuroscience and Neuroimaging., 5, 1095–1103. 10.1016/j.bpsc.2020.06.014 [DOI] [PubMed] [Google Scholar]
- Wang, J. , Knol, M. J. , Tiulpin, A. , Dubost, F. , de Bruijne, M. , Vernooij, M. W. , … Roshchupkin, G. V. (2019). Gray matter age prediction as a biomarker for risk of dementia. Proceedings of the National Academy of Sciences, 116(42), 21213–21218. 10.1073/pnas.1902376116 [DOI] [PMC free article] [PubMed] [Google Scholar]
- Ward, J. H. (1963). Hierarchical grouping to optimize an objective function. Journal of the American Statistical Association, 58(301), 236–244. 10.1080/01621459.1963.10500845 [DOI] [Google Scholar]
- Wei, Taiyun , and Simko Viliam. 2017. R Package "Corrplot": Visualization of a Correlation Matrix. https://github.com/taiyun/corrplot.
- Westlye, L. T. , Walhovd, K. B. , Dale, A. M. , Bjørnerud, A. , Due‐Tønnessen, P. , Engvig, A. , … Fjell, A. M. (2010). Differentiating maturational and aging‐related changes of the cerebral cortex by use of thickness and signal intensity. NeuroImage, 52(1), 172–185. 10.1016/j.neuroimage.2010.03.056 [DOI] [PubMed] [Google Scholar]
- Westlye, L. T. , Walhovd, K. B. , Dale, A. M. , Bjørnerud, A. , Due‐Tønnessen, P. , Engvig, A. , … Fjell, A. M. (2010b). Life‐span changes of the human brain White matter: Diffusion tensor imaging (Dti) and Volumetry. Cerebral Cortex, 20(9), 2055–2068. 10.1093/cercor/bhp280 [DOI] [PubMed] [Google Scholar]
- Winblad, B. , Palmer, K. , Kivipelto, M. , Jelic, V. , Fratiglioni, L. , Wahlund, L.‐O. , … Petersen, R. C. (2004). Mild cognitive impairment – Beyond controversies, towards a consensus: Report of the international working group on mild cognitive impairment. Journal of Internal Medicine, 256(3), 240–246. 10.1111/j.1365-2796.2004.01380.x [DOI] [PubMed] [Google Scholar]
- Yao, N. , Winkler, A. M. , Barrett, J. , Book, G. A. , Beetham, T. , Horseman, R. , … Glahn, D. C. (2017). Inferring pathobiology from structural Mri in schizophrenia and bipolar disorder: Modeling head motion and neuroanatomical specificity. Human Brain Mapping, 38(8), 3757–3770. 10.1002/hbm.23612 [DOI] [PMC free article] [PubMed] [Google Scholar]
- Zhang, N. , Gordon, M. L. , & Goldberg, T. E. (2017). Cerebral blood flow measured by arterial spin labeling Mri at resting state in Normal aging and Alzheimer's disease. Neuroscience & Biobehavioral Reviews, 72, 168–175. 10.1016/j.neubiorev.2016.11.023 [DOI] [PubMed] [Google Scholar]
- Zimmerman, D. W. (2012). Correcting two‐sample "Z" and "T" tests for correlation: An alternative to one‐sample tests on difference scores. Psicologica: International Journal of Methodology and Experimental Psychology, 33(2), 391–418. [Google Scholar]
Associated Data
This section collects any data citations, data availability statements, or supplementary materials included in this article.
Supplementary Materials
Appendix S1: Supporting Information
Data Availability Statement
Due to ethical and data security issues related to the sensitive nature of the clinical data we are not allowed to share the data without specific IRB approval and data use agreements with the relevant institution. More information can be obtained through the corresponding authors: Jaroslav Rokicki (jaroslav.rokicki@psykologi.uio.no) or Lars Tjelta Westlye (l.t.westlye@psykologi.uio.no)