Abstract
Τhe accuracy of template‐based neuroimaging investigations depends on the template's image quality and representativeness of the individuals under study. Yet a thorough, quantitative investigation of how available standardized and study‐specific T1‐weighted templates perform in studies on older adults has not been conducted. The purpose of this work was to construct a high‐quality standardized T1‐weighted template specifically designed for the older adult brain, and systematically compare the new template to several other standardized and study‐specific templates in terms of image quality, performance in spatial normalization of older adult data and detection of small inter‐group morphometric differences, and representativeness of the older adult brain. The new template was constructed with state‐of‐the‐art spatial normalization of high‐quality data from 222 older adults. It was shown that the new template (a) exhibited high image sharpness, (b) provided higher inter‐subject spatial normalization accuracy and (c) allowed detection of smaller inter‐group morphometric differences compared to other standardized templates, (d) had similar performance to that of study‐specific templates constructed with the same methodology, and (e) was highly representative of the older adult brain.
Keywords: aging, atlas, brain, magnetic resonance imaging, spatial normalization, template
The purpose of this work was to construct a high‐quality standardized T1‐weighted template specifically designed for the older adult brain, and systematically compare the new template to several other standardized and study‐specific templates in terms of image quality, performance in spatial normalization of older adult data and detection of small inter‐group morphometric differences, and representativeness of the older adult brain. The new template was constructed with state‐of‐the‐art spatial normalization of high‐quality data from 222 older adults. It was shown that the new template a) exhibited high image sharpness, b) provided higher inter‐subject spatial normalization accuracy and c) allowed detection of smaller inter‐group morphometric differences compared to other standardized templates, d) had similar performance to that of study‐specific templates constructed with the same methodology, and e) was highly representative of the older adult brain.
1. INTRODUCTION
Structural T1‐weighted templates play an important role in neuroimaging and are commonly used as references for spatial normalization in voxel‐wise analyses, such as in voxel‐based morphometry (Ashburner & Friston, 2000; Goldszal et al., 1998; Good et al., 2001; Mechelli, Price, Friston, & Ashburner, 2005; Whitwell, 2009). When they are part of a comprehensive atlas, standardized structural T1‐weighted templates combined with various atlas resources, such as tissue‐probability maps and semantic labels, are also used in a plethora of other applications including region of interest analyses (Josephs et al., 2014; Pfefferbaum et al., 2013; Whitwell et al., 2012; Zhang et al., 2010), automated tissue‐segmentation (Grau, Mewes, Alcaniz, Kikinis, & Warfield, 2004; Kwon, Shinohara, Akbari, & Davatzikos, 2014; Van Leemput, Maes, Vandermeulen, & Suetens, 1999; Wang, Shi, Lin, Gilmore, & Shen, 2011), automated seed selection for functional connectivity (Braun et al., 2012; Chen et al., 2013; Faria et al., 2012; Liu et al., 2015; Pineda‐Pardo et al., 2014; Wee, Yap, Zhang, Wang, & Shen, 2014; Zhu, Fan, Feng, Huang, & Wang, 2013), and even as standards in algorithm evaluation (Gholipour et al., 2014; Shi et al., 2013; Zhou et al., 2015). Study‐specific (SS) T1‐weighted templates constructed from the data collected in individual studies are also commonly used, however they are typically not accompanied by other resources (e.g., other templates, labels, databases, software), which limits their functionality (Ashburner & Friston, 2000; Good et al., 2001; Huang et al., 2010; Thompson et al., 2001). The accuracy of the aforementioned applications of T1‐weighted templates depends on the spatial normalization accuracy achieved with the selected template (Fonov, Evans, McKinstry, Almli, & Collins, 2009; Yoon et al., 2009), which in turn depends on the template's image quality and representativeness of the individuals under study (Mazziotta et al., 2001; Zhang & Arfanakis, 2018).
It is well established that the characteristics of the older adult brain differ from those of the brain of younger and middle‐aged adults (Blatter et al., 1995; Buckner et al., 2004; Courchesne et al., 2000; Dickie, Karama, et al., 2016; Galluzzi, Beltramello, Filippi, & Frisoni, 2008; Good et al., 2001; Sowell et al., 2003). Enlarged ventricles and sulci, varying degrees of atrophy in gray and white matter, lesions such as white matter hyperintensities, microbleeds, infarcts, and enlarged perivascular spaces, are common in the older adult brain, suggesting that template‐based studies on older adults require templates that are representative of such features, to the degree possible (Dickie, Karama, et al., 2016; Dickie, Ritchie, et al., 2016; Lemaître et al., 2005; Matsumae et al., 1996; Sullivan, Marsh, Mathalon, Lim, & Pfefferbaum, 1995). Several standardized T1‐weighted templates of varying image quality are publicly available (Ashburner, 2007; Avants & Tustison, 2018; Fonov et al., 2009; Klein, 2016; Mazziotta et al., 2001; Shattuck et al., 2008; Tustison et al., 2014), few of which were constructed using older adult brain data exclusively. However, template‐based investigations on older adults often utilize standardized templates that have not been optimized for the older adult brain, such as those of the ICBM (McGovern et al., 2017; Mega et al., 2005; Moayedi, Salomons, & Atlas, 2018). Furthermore, even when older adult brain templates are used (standardized or SS), typically, little to no justification is provided for the selection of template. This lack of attention in optimizing the template selection step in most studies on older adults is due to the fact that, notably, a thorough, quantitative assessment of how available standardized and SS structural T1‐weighted templates perform in studies on older adults has not yet been conducted. This is a critical gap in the literature, as template selection may impact spatial normalization accuracy and may have important implications in the accuracy of investigations on older adults (Van Hecke et al., 2011; Zhang & Arfanakis, 2018).
The purpose of this work was twofold: (a) to construct a high‐quality, standardized T1‐weighted template of the older adult brain as part of an ongoing project to develop a comprehensive older adult brain atlas named Multichannel Illinois Institute of Technology & Rush university Aging (MIITRA) atlas, and (b) to systematically compare the new template and several other standardized and SS templates in terms of image quality, performance in spatial normalization of older adult data and detection of small inter‐group morphometric differences, and representativeness of the older adult brain. First, high‐quality T1‐weighted data were collected on a large number of well‐characterized non‐demented older adults (65–95 years of age). Second, using a template construction technique aiming at generating high quality templates, the effect of the number of persons included in the construction of a template on template performance was assessed. Next, the standardized MIITRA T1‐weighted template was generated using all the available data, and its performance was compared to that of a large number of publicly available standardized and SS templates. Finally, standardized T1‐weighted templates were generated using data from older adults with narrower age‐range (e.g., 65–75 years, 70–80 years, etc.), and their performance was compared to that of the wider age‐range (65–95 years) MIITRA T1‐weighted template.
2. METHODS
2.1. Data
Two brain magnetic resonance imaging (MRI) datasets were used in this work. Dataset 1 was used for constructing the MIITRA standardized T1‐weighted template as well as narrower age‐range templates. Dataset 2 was used for evaluating the performance of the different templates considered in this work, including a template constructed from the data of Dataset 2, therefore referred to as a SS template.
2.1.1. Dataset 1
Dataset 1 consisted of T1‐weighted brain MRI data from 222 community dwelling non‐demented older adults (65–95 years of age, mean± SD age = 80.1±8.3 years, male: female = 1:1, 174 with no cognitive impairment, 48 with mild cognitive impairment) participating in the Rush Memory and Aging Project (MAP) (Bennett et al., 2018). All participants provided written informed consent according to procedures approved by the institutional review board of Rush University Medical Center. Dataset 1 was also divided into four subsets, each including 60 MAP participants with a narrower age‐range: Dataset 165–75 (65–75 years of age, 70.0±3.0 years, male: female = 1:1); Dataset 170–80 (70–80 years of age, 74.9±3.0 years, male: female = 1:1); Dataset 175–85 (75–85 years of age, 80.2±3.0 years, male: female = 1:1); Dataset 180–95 (80–95, mean± SD age = 87.4±4.4, male: female = 1:1). All T1‐weighted data in Dataset 1 were collected on a 3 Tesla (T) Siemens (171 persons) and a 3 T Philips MRI scanner (51 persons) using a 3D magnetization prepared rapid acquisition gradient echo (MPRAGE) sequence with the following parameters: for 3 T Siemens, TR = 2,300 ms, TE = 2.98 ms, TI = 900 ms, flip‐angle = 9°, field of view = 256 mm × 256 mm, 176 slices, acquired voxel size = 1 × 1 × 1 mm3, and an acceleration factor of 2; for 3 T Philips, TR = 8 ms, TE = 3.7 ms, TI = 955 ms, flip‐angle = 8°, field of view = 240 mm × 228 mm, 181 slices, acquired voxel size = 1 × 1 × 1 mm3, and an acceleration factor of 2. The data of Dataset 1 can be accessed by submitting a request to www.radc.rush.edu.
2.1.2. Dataset 2
Dataset 2 consisted of T1‐weighted brain MRI data from 222 non‐demented older adults (65–95 years of age, mean± SD age = 80.1±5.7 years, male: female = 1:1, 131 with no cognitive impairment, 91 with mild cognitive impairment) participating in the Alzheimer's Disease Neuroimaging Initiative 3 (ADNI3) (http://adni.loni.usc.edu). ADNI was launched in 2003 as a public‐private partnership, led by Principal Investigator Michael W. Weiner, MD. The primary goal of ADNI has been to test whether serial MRI, positron emission tomography, other biological markers, and clinical and neuropsychological assessment can be combined to measure the progression of mild cognitive impairment and early Alzheimer's disease. For up‐to‐date information, see http://www.adni-info.org. Dataset 2 was also divided into four subsets, each including 60 ADNI3 participants with a narrower age‐range: Dataset 265–75 (65–75 years of age, mean± SD age = 70.9±2.6 years, male: female = 1:1); Dataset 270–80 (70–80 years of age, 75.0±2.9 years, male: female = 1:1); Dataset 275–85 (75–85 years of age, 80.0±2.9 years, male: female = 1:1); Dataset 280–95 (80–95 years of age, 84.1±3.2 years, male: female = 1:1). All T1‐weighted data in Dataset 2 were collected on 3T Siemens (163 persons) and Philips MRI scanners (59 persons) using 3D MPRAGE sequences with the following parameters: for 3 T Siemens, TR = 2,300 ms, TE = 2.98 ms, TI = 900 ms, flip‐angle = 9°, field of view = 256 mm × 240 mm, 208 slices, acquired voxel size = 1 × 1 × 1 mm3, and an acceleration factor of 2; for 3T Philips, TR = 6.5 ms, TE = 2.9 ms, TI = 900 ms, flip‐angle = 9°, field of view = 256 mm × 256 mm, 211 slices, acquired voxel size = 1 × 1 × 1 mm3, and an acceleration factor of 2.
2.2. Preprocessing
The raw T1‐weighted images in Datasets 1 and 2 were skull‐stripped using the multi‐atlas skull‐stripping method (Doshi, Erus, Ou, Gaonkar, & Davatzikos, 2013) with a set of 100 atlases (Heckemann et al., 2015). Next, the brain images were segmented into three tissue classes (gray matter: GM, white matter: WM, and cerebrospinal fluid: CSF) using CAT (Farokhian, Beheshti, Sone, & Matsuda, 2017), and were used as priors for N4 bias field inhomogeneity correction (Tustison et al., 2010). The image intensities were converted to z‐scores using the mean and SD of the intensities in the combined GM and WM masks. Finally, the gray matter in brain MRI data of Dataset 2 was segmented into the Desikan–Killiany regions using FreeSurfer (Fischl, 2012; McCarthy et al., 2015).
2.3. Template construction
The template construction approach used in this work was based on a widely used iterative process (Fonov et al., 2011; Guimond, Meunier, & Thirion, 2000; Joshi, Davis, Jomier, & Gerig, 2004) following a symmetric group‐wise normalization (SyGN) method (buildtemplateparallel.sh) (Avants et al., 2010; Avants, Epstein, Grossman, & Gee, 2008). In Step 1 of the template construction approach, preprocessed raw T1‐weighted images from different participants were rigidly registered to the 1 mm × 1 mm × 1 mm ICBM2009c template (Fonov et al., 2009) and were averaged to generate an initial template (Figure 1) (Appendix S1 provides the settings used for registration, as well as an evaluation of the rigid registration step). Mutual Information was used as the cost function for rigid registration. In Step 2, the rigidly co‐registered data were affinely registered to the initial template using ANTs SyN affine registration (Avants et al., 2008, 2011; Avants, Tustison, & Song, 2009) and both cross‐correlation and mutual information were used separately as cost functions (Appendix S1). Next, the rigid, affine, and shape‐update deformations (shape‐update was conducted using the built‐in algorithm of buildtemplateparallel.sh) were concatenated for each participant separately to map the preprocessed raw images to the corrected minimum deformation space without multiple interpolations, and the resulting images were averaged across participants to obtain a new initial template (Figure 1). Using the new template as initial reference, Step 2 was repeated in multiple iterations until the Pearson cross‐correlation similarity index across templates from subsequent iterations became higher than 0.9995. In Step 3, the template generated in the final iteration of Step 2 was used as the initial reference for undergoing ANTs SyN nonlinear registration of the aforementioned rigidly co‐registered data and a new initial template was generated. Cross‐correlation and mutual information were used separately as the cost functions in this step (Appendix S1). Using this new template as initial reference, Step 3 was repeated in multiple iterations. The same convergence criteria as in Step 2 were applied, and the final population brain template was generated (Figure 1). In order to add skull and other head structures to this brain‐only template, the strategy by Rohlfing et al. was employed (Rohlfing et al., 2012). However, only brain tissue was considered throughout the rest of this work. Application of this template construction approach on Dataset 1 generated the MIITRA T1‐weighted template with 1 mm × 1 mm × 1 mm voxel‐size (Figure 2). The MIITRA T1‐weighted template is available for download at www.nitrc.org/projects/miitra.
FIGURE 1.
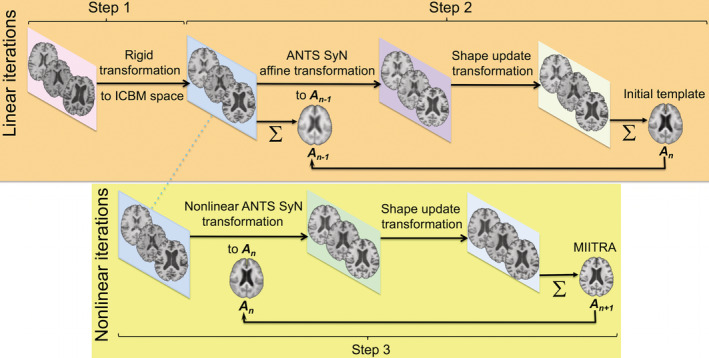
Schematic representation of the approach used to generate the Multichannel Illinois Institute of Technology & Rush university Aging (MIITRA) T1‐weighted brain template
FIGURE 2.
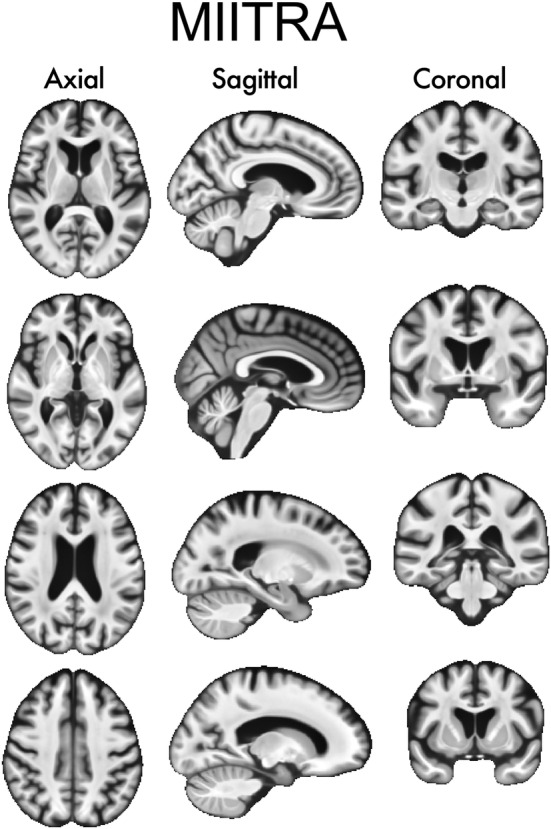
Examples of axial, sagittal, and coronal slices of the Multichannel Illinois Institute of Technology & Rush university Aging (MIITRA) T1‐weighted template
2.4. Effect of the number of persons considered in construction of standardized templates on template performance
To investigate the effect of the number of persons included in the construction of a standardized template on the performance of the resulting template, multiple templates were generated based on different numbers of persons using a bootstrap approach, and the accuracy of spatial normalization to these templates was assessed. More specifically, five templates were constructed based on each of the following numbers of participants: 210, 180, 150, 120, 90, 60, 30, 18, using the template construction approach of Section 2.3 and a bootstrap approach in which participants were selected randomly without replacement from the 222 participants of Dataset 1. The same age distribution and sex ratio (male: female = 1:1) was maintained for all templates. Each of these templates was used as reference for spatial normalization (using ANTs registration [Avants et al., 2011]) of ADNI data from Dataset 2. The spatial normalization accuracy was assessed for each template by means of the pairwise normalized cross‐correlation (Ferreira, Oliveira, & Freitas, 2014; Wang, Bovik, Rahim Sheikh, & Simoncelli, 2004) (PNCC) of spatially normalized data:
| (1) |
where Smi and Smj are the intensities in voxel m of subjects i and j, μi, σi and μj, σj are the mean and SD of the intensities of all the voxels of subjects i and j, and N is the total number of voxels. The average and SD of PNCC over all pairs of spatially normalized data (222 × 221/2 = 24,531 pairs) were computed for registration to each template. Finally, the average and SD of the average PNCC values from the five bootstrap copies of each template were computed. To further assess spatial normalization accuracy, the transformations obtained from registration of ADNI data from Dataset 2 to the different templates were applied to the corresponding gray matter labels, and the pairwise overlap of regional gray matter labels (PORGM) (Crum, Camara, & Hill, 2006) of spatially normalized ADNI data was computed as follows:
| (2) |
where Li ∩ Lj and Li ∪ Lj are the intersection and union of label L for subjects i and j. The average and SD of PORGM over all pairs of spatially normalized data (222 × 221/2 = 24,531 pairs) were computed for registration to each template. Finally, the average and SD of the average PORGM values from the five bootstrap copies of each template were computed.
2.5. Comparison of multiple standardized and SS brain templates
A number of standardized and SS brain templates were evaluated in terms of image quality, inter‐subject spatial normalization accuracy for older adult data (using Dataset 2), detection of small inter‐group morphometric differences (using Dataset 2), and representativeness of the older adult brain (using Dataset 2). The templates considered included: (a) the MIITRA T1‐weighted template, (b) a SS template generated by applying the approach of Section 2.3 on Dataset 2, (c) several other publicly available standardized templates with voxel‐size equal to or larger than 1 mm × 1 mm × 1 mm listed in Table 1 and displayed in Figure 3, and (d) narrow age‐range templates constructed by applying the approach of Section 2.3 on the subsets of Dataset 1 (generating template T65–75 from Dataset 165–75, template T70–80 from Dataset 170–80, T75–85 from Dataset 175–85, T80–95 from Dataset 180–95) (Figure 4).
TABLE 1.
T1‐weighted templates evaluated in this work
| Name | Number of persons considered in template construction | Age range (years) |
|---|---|---|
| MIITRA | 222 | 65–95 |
| SS | 222 | 65–95 |
| MCALT (Schwarz et al., 2017) https://www.nitrc.org/projects/mcalt/ | 202 | 30–92 |
| SC_80–84 (Fillmore, Phillips‐Meek, & Richards, 2015) https://jerlab.sc.edu/projects/neurodevelopmental‐mri‐database/ | 62 | 80–84 |
| ED_75–78 https://datashare.is.ed.ac.uk/handle/10283/1957 | 50 | 75–78 |
| UNC‐elderly https://www.nitrc.org/projects/unc_brain_atlas/ | 27 | >60 |
| IXI‐Dartel (Ashburner, 2007) | 550 | 17–79 |
| IXI‐ANTS (Avants & Tustison, 2018) | 560 | 20–90 |
| UNC‐adult https://www.nitrc.org/projects/unc_brain_atlas/ | 50 | 20–50 |
| SRI24 (Rohlfing, Zahr, Sullivan, & Pfefferbaum, 2010) https://www.nitrc.org/projects/sri24/) | 24 | 19–84 |
| HLN (Klein) | 12 | 23–39 |
| ICBM2009c (Fonov et al., 2009, 2011) | 152 | 18–44 |
| ICBM2009a (Fonov et al., 2009, 2011) | 152 | 18–44 |
|
ICBM452 (Mazziotta et al., 2001) |
452 | Young adults |
| ICBM305 (Evans, 1994) https://www.loni.usc.edu/research/atlases | 305 | 23±4.1 |
| LPBA40 (Shattuck et al., 2008) https://www.loni.usc.edu/research/atlases | 40 | 16–40 |
| Colin27 (Holmes et al., 1998) | 1 (27 scans) | 33 |
| OASIS (Avants & Tustison, 2018) | 30 | 18–90 |
| NKI (Avants & Tustison, 2018) | ~30 | 35–40 |
| MMRR (Avants & Tustison, 2018) | 21 | 20–61 |
| T65–75 | 60 | 65–75 |
| T70–80 | 60 | 70–80 |
| T75–85 | 60 | 75–85 |
| T80–95 | 60 | 80–95 |
FIGURE 3.
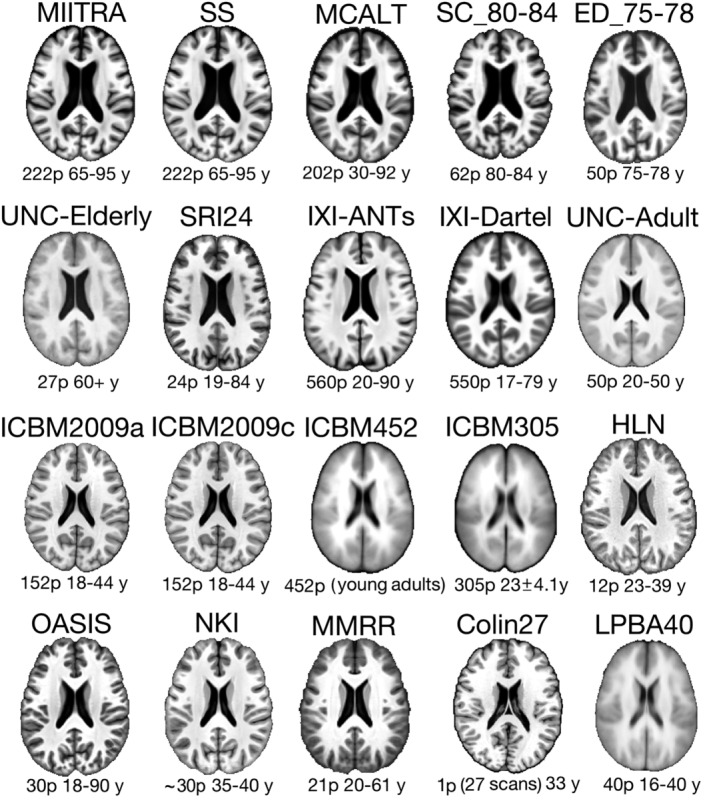
Examples of axial slices from the Multichannel Illinois Institute of Technology & Rush university Aging (MIITRA), study specific (SS), and multiple publicly available standardized T1‐weighted templates evaluated in this work for use in studies on older adults. The number of persons (p) considered in the construction of each template and their age‐range in years (y) is listed below each template
FIGURE 4.
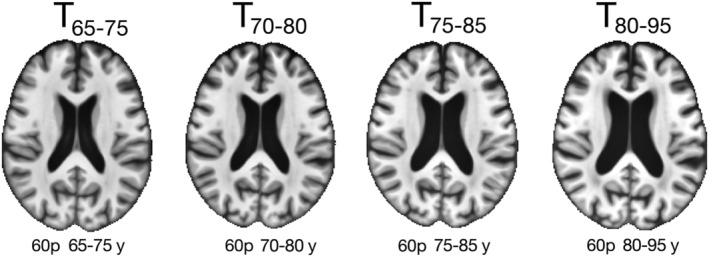
Examples of axial slices from the narrow age‐range templates constructed in the same way as the Multichannel Illinois Institute of Technology & Rush university Aging (MIITRA) template but using only participants from a narrow age‐range. The corresponding number of participants and age‐range are shown below each template
2.5.1. Comparison of template image sharpness
The evaluation of image quality of T1‐weighted templates was limited to an evaluation of image sharpness for two reasons. First, precise definition of the different brain structures is important for accurate spatial normalization. Second, all templates considered in this work were satisfactory in terms of other image quality metrics (e.g., signal to noise ratio, image artifacts). Image sharpness was assessed (a) by visual inspection, and also (b) by means of the normalized power spectra along the anterior–posterior (AP), left–right (LR), and inferior–superior axes (IS) separately (Zhang & Arfanakis, 2018; Zhang, Peng, Dawe, & Arfanakis, 2011). In the first approach, a neuroradiologist and two medical imaging graduate students, all three unfamiliar with brain templates and blinded to the names of the different templates, visually inspected and rated them on a three‐level scale (1, 2, 3), with 1 and 3 representing the lowest and highest sharpness, respectively.
2.5.2. Comparison of templates in terms of inter‐subject spatial normalization accuracy
The accuracy of inter‐subject spatial normalization attained when using each of the templates as reference was compared across templates for normalization of older adult ADNI data from Dataset 2. For evaluation of the spatial normalization accuracy achieved with narrow age‐range templates (T65–75, T70–80, T75–85, T80–95) the narrow age‐range subsets of Dataset 2 (Dataset 265–75, Dataset 270–80, Dataset 275–85, Dataset 280–95) were used for spatial normalization. Registration to the different templates was accomplished using ANTs, which is shown to be one of the top‐performing registration tools for structural MR images (Klein et al., 2009). Inter‐subject spatial normalization accuracy was assessed by means of the average pairwise normalized cross‐correlation (PNCC) and the average pairwise overlap of regional gray matter labels (PORGM) over all spatially normalized data, as described in Section 2.4. In addition, a more localized assessment of spatial normalization accuracy was conducted by means of the pairwise Jaccard index (PJI) for each gray matter label of spatially normalized data (Rohlfing, 2012):
| (3) |
where Li ∩ Lj and Li ∪ Lj are the intersection and union of label L for subjects i and j (homologous labels in contralateral hemispheres were combined). The average and SD of PJI over all pairs of spatially normalized data (222 × 221/2 = 24,531 pairs) were computed for each gray matter label, as well as for the whole gray matter, white matter and ventricles, and for registration to each template. Statistically significant differences across templates were evaluated by means of one‐way ANOVA followed by the Tukey–Kramer post‐hoc test. Differences were considered significant at p < .05. Moreover, maps and histograms of the SD of image intensities of spatially normalized data were generated for normalization to each template. Histograms of the SD were compared across templates using the one‐sided two‐sample Kolmogorov–Smirnov (KS) test and differences were considered significant at p < .05.
2.5.3. Impact of spatial normalization accuracy on the ability to detect small inter‐group differences in voxel‐based morphometry studies
Power analysis (Wicks, Vaughan, Massagli, & Heywood, 2011; Zhang & Arfanakis, 2018) was used to assess the impact of spatial normalization accuracy achieved with each of the templates on the ability to detect small inter‐group morphometric differences (Good et al., 2002; Karas et al., 2003; Radua, Canales‐Rodríguez, Pomarol‐Clotet, & Salvador, 2014; Salmond et al., 2002). More specifically, the transformations from registration of Dataset 2 to the different templates were applied to the corresponding gray matter tissue probability maps and the resulting maps were smoothed using a Gaussian filter with sigma of 4 mm, in accordance with unmodulated voxel‐based morphometry procedures (Good et al., 2002; Radua et al., 2014). Maps of the SD of the smoothed maps were then used in power analyses to assess the minimum morphometric differences that can be detected across two groups, assuming 100 participants per group, significance at p < .05, and power >.95. This analysis was conducted in Matlab (R2019b) (Mathworks, Natick, MA) using the “sampsizepwr” function for two‐sided t tests. Maps of the minimum detectable inter‐group morphometric differences were generated for all templates. Cumulative distributions of the values presented in these maps were compared between MIITRA and all other templates using the one‐sided two‐sample KS test, and differences were considered significant at p < .05.
2.5.4. Comparison of templates in terms of their representativeness of the older adult brain
To evaluate how representative different templates are of the older adult brain, maps of the log‐Jacobian determinant of the deformations obtained during spatial normalization of ADNI data from Dataset 2 to the different templates were generated and averaged over all normalized data for each template. Voxel‐wise values in these maps represent how data were deformed on average during spatial normalization (Leow et al., 2007; Yanovsky, Leow, Lee, Osher, & Thompson, 2009). Values equal to zero refer to no volume change, greater than zero signify volume expansion, and lower than zero indicate volume contraction. Histograms of the average of the log‐Jacobian determinant maps for voxel values greater than or equal to zero, and less than or equal to zero, were computed separately and compared across templates using the one‐sided two‐sample KS test, and differences were considered significant at p < .05. In order to assess the representativeness of different templates regionally, the median of the absolute of the average log‐Jacobian determinant was calculated in each gray matter label, as well as in white matter and ventricles, for spatial normalization to each template.
3. RESULTS
3.1. Effect of the number of persons considered in construction of standardized templates on template performance
Spatial normalization of ADNI data from Dataset 2 to templates constructed using data from different numbers of older adults showed that the average PNCC and average PORGM increased gradually with increasing number of individuals considered in the construction of the template and plateaued after about 120 individuals. The SD of PNCC and PORGM was high for small numbers of persons considered in the construction of the template and decreased for higher numbers of persons considered (Figure 5).
FIGURE 5.
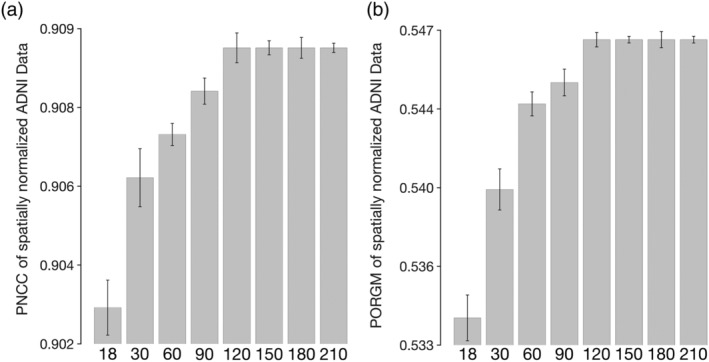
(a) Average pairwise normalized cross‐correlation (PNCC) and (b) average pairwise overlap of FreeSurfer‐generated regional gray matter labels (PORGM) of spatially normalized Alzheimer's Disease Neuroimaging Initiative (ADNI) data for T1‐weighted templates constructed using data from different numbers of older adults. The error‐bars denote the SD of PNCC and PORGM
3.2. Comparison of template image sharpness
Visual inspection of the templates under investigation showed that MIITRA, SS, ICBM2009a, ICBM2009c, NKI, and COLIN27 templates have higher image sharpness compared to other standardized templates (Table 2) (Figure 3). This finding was supported by a quantitative comparison of the normalized power spectra from different templates. The average energy at higher spatial frequencies over all axes was generally higher for the aforementioned templates compared to other standardized T1‐weighted templates (Figure 6).
TABLE 2.
Image sharpness ratings of the different templates provided by a neuroradiologist and two medical imaging graduate students
| Template | Neuroradiologist | Grad student 1 | Grad student 2 | Average |
|---|---|---|---|---|
| MCALT | 2 | 2 | 2 | 2 |
| SC_80–84 | 2 | 2 | 2 | 2 |
| SRI24 | 3 | 3 | 2 | 2.7 |
| ICBM2009c | 3 | 3 | 3 | 3 |
| SS | 3 | 3 | 3 | 3 |
| UNC‐elderly | 1 | 1 | 1 | 1 |
| IXI‐ANTs | 2 | 2 | 1 | 1.7 |
| ED_75–78 | 2 | 3 | 2 | 2.3 |
| MMRR | 2 | 2 | 2 | 2 |
| ICBM2009a | 3 | 3 | 3 | 3 |
| Colin27 | 3 | 3 | 3 | 3 |
| ICBM452 | 1 | 1 | 1 | 1 |
| NKI | 3 | 3 | 3 | 3 |
| MIITRA | 3 | 3 | 3 | 3 |
| HLN | 2 | 2 | 2 | 2 |
| ICBM305 | 1 | 1 | 1 | 1 |
| OASIS | 2 | 3 | 3 | 2.7 |
| IXI‐Dartel | 2 | 3 | 2 | 2.3 |
| UNC‐adult | 1 | 1 | 1 | 1 |
| LPBA40 | 1 | 1 | 1 | 1 |
Note: Three‐level scale: 1 represents low sharpness, 2 moderate sharpness, and 3 high sharpness.
FIGURE 6.
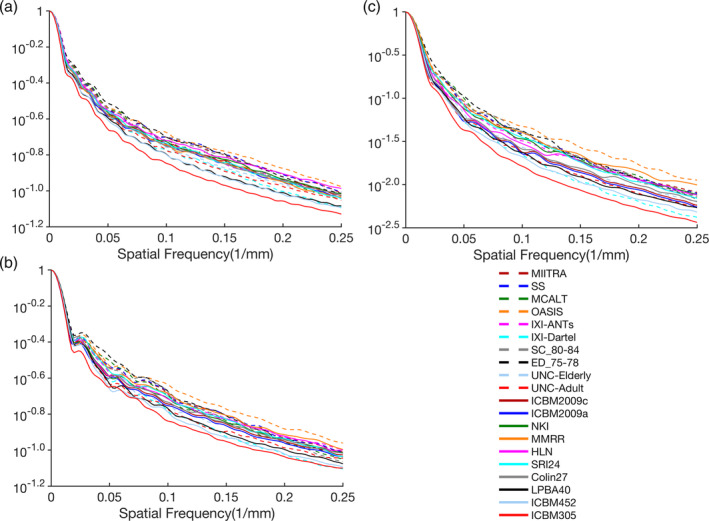
Normalized power spectra for the (a) anterior–posterior, (b) left–right, and (c) superior–inferior axes, separately, for the Multichannel Illinois Institute of Technology & Rush university Aging (MIITRA), study specific (SS), and multiple publicly available standardized T1‐weighted templates
3.3. Comparison of templates in terms of inter‐subject spatial normalization accuracy
The accuracy of inter‐subject spatial normalization of ADNI data from Dataset 2 achieved when using each of the standardized and SS T1‐weighted templates as reference was compared across templates. It was demonstrated that, compared to all publicly available standardized templates, MIITRA resulted in higher average PNCC and average PORGM (p < 10−6) (Figure 7a,b), as well as higher average PJI in the majority of brain regions (p < .02) (Figure 7c and Appendix S2), indicating higher spatial normalization accuracy. The same findings were observed when considering data of Dataset 2 from each MRI vendor separately (Appendix S3). The SS template constructed from the same ADNI data of Dataset 2 resulted in similar but slightly higher average PNCC and average PORGM than the MIITRA template, by only 0.2 and 0.6%, respectively (p = 10−6) (Figure 7a,b), as well as similar but slightly higher average PJI in individual gray matter regions, whole gray matter, white matter, and ventricles (Figure 7c and Appendix S2). The performance of MIITRA and the SS template in terms of average PJI relative to other templates was generally higher in cortical than subcortical regions. Nevertheless, in subcortical regions, there was less variation in average PJI across templates, and the performance of MIITRA and SS templates was near the top (Figure 7c and Appendix S2). Furthermore, the SD of image intensities of normalized ADNI data was in general lower for MIITRA compared to all other publicly available standardized templates as shown in maps and histograms (p < 10−10) of SD (Figure 8). Only the SS template resulted in slightly lower SDs than MIITRA (p < 10−10) (Figure 8).
FIGURE 7.
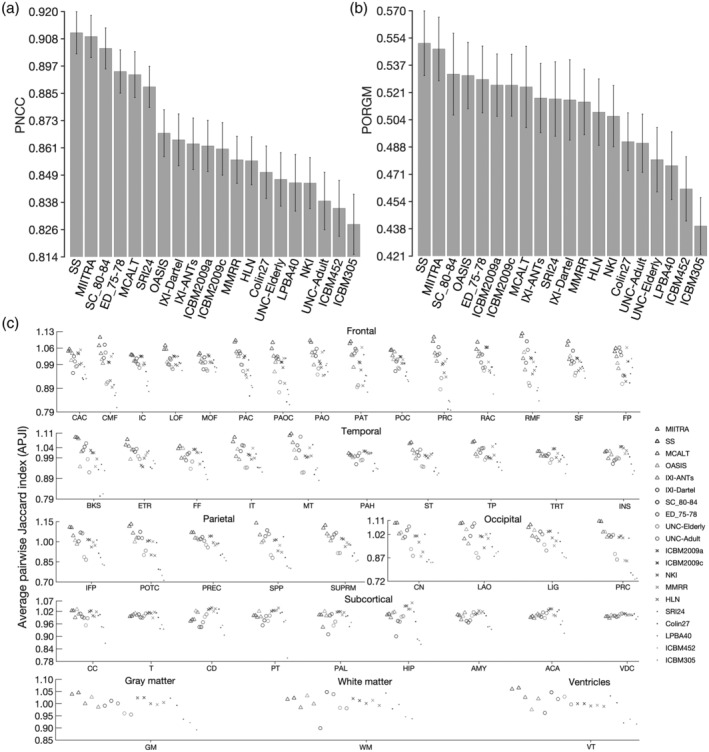
(a) Average pairwise normalized cross‐correlation (PNCC), (b) average pairwise overlap of Free‐Surfer generated regional gray matter labels (PORGM), and (c) average pairwise Jaccard index (PJI) for individual gray matter labels, as well as for whole gray matter, white matter and ventricles, over all spatially normalized Alzheimer's Disease Neuroimaging Initiative (ADNI) participants when using Multichannel Illinois Institute of Technology & Rush university Aging (MIITRA), other standardized and study‐specific (SS) templates as reference. The error‐bars denote the SD of PNCC and PORGM. Caudal anterior cingulate (CAC), caudal middle frontal (CMF), isthmus cingulate (IC), lateral orbitofrontal (LOF), medial orbitofrontal (MOF), paracentral (PAC), pars opercularis (PAOC), pars orbitalis (PAO), pars triangularis (PAT), posterior cingulate (POC), precentral (PRC), rostral anterior cingulate (RAC), rostral middle frontal (RMF), superior frontal (SF), frontal pole (FP), banks of the superior temporal sulcus (BKS), entorhinal (ETR), fusiform (FF), inferior temporal (IT), middle temporal (MT), parahippocampal (PAH), superior temporal (ST), temporal pole (TP), transverse temporal (TRT), insula (INS), inferior parietal (IFP), postcentral (POTC), precuneus (PREC), superior parietal (SPP), supramarginal (SUPRM), cuneus (CN), lateral occipital (LAO), lingual (LIG), pericalcarine (PRC), cerebellum cortex (CC), thalamus (T), caudate (CD), putamen (PT), pallidum (PAL), hippocampus (HIP), amygdala (AMY), accumbens area (ACA), ventral diencephalon (VDC)
FIGURE 8.
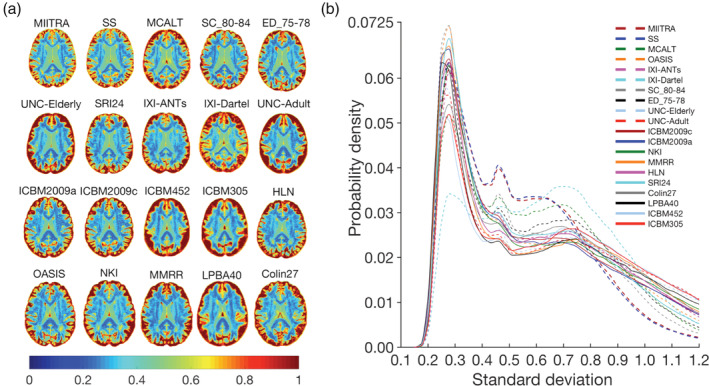
(a) Maps and (b) histograms of the SD of image intensities of spatially normalized Alzheimer's Disease Neuroimaging Initiative (ADNI) data when using Multichannel Illinois Institute of Technology & Rush university Aging (MIITRA), other standardized and study‐specific (SS) templates as reference
The accuracy of inter‐subject spatial normalization of ADNI data with narrow age‐range (Dataset 265–75, Dataset 270–80, Dataset 275–85, Dataset 280–95) achieved when using the MIITRA template or the narrower age‐range templates (T65–75, T70–80, T75–85, T80–95) as reference was evaluated. Overall, the MIITRA template resulted in similar or slightly higher inter‐subject spatial normalization accuracy than the narrower age‐range templates as shown by means of the average PNCC: MIITRA > T65–75 by 1% (p = 10−10), MIITRA > T70–80 by 0.6% (p = 10−10), MIITRA > T75–85 by 0.3% (p = 10−6), MIITRA < T80–95 by 0.1% (p = 0.046) (note that the average PNCC was slightly higher for T80–95 than MIITRA) (Figure 9a); and the average PORGM: MIITRA > T65–75 by 1.3% (p = 10−10), MIITRA > T70–80 by 0.6% (p = 10−6), MIITRA > T75–85 by 0.7% (p = 10−4), MIITRA > T80–95 by 0.9% (p = 10−7) (Figure 9b). When considering each gray matter label separately, as well as the whole gray matter, white matter and ventricles, MIITRA resulted in higher average PJI in the majority of brain regions compared to all narrower age‐range templates (Figure 9c and Appendix S4). Furthermore, MIITRA resulted in a slightly higher number of voxels with lower SD of image intensities of normalized data compared to T65–75 (p = 10−10), T70–80 (p = 10−10), T75–85 (p = 10−10), and T80–95 (p = 10−10) (Figure 9d,e).
FIGURE 9.
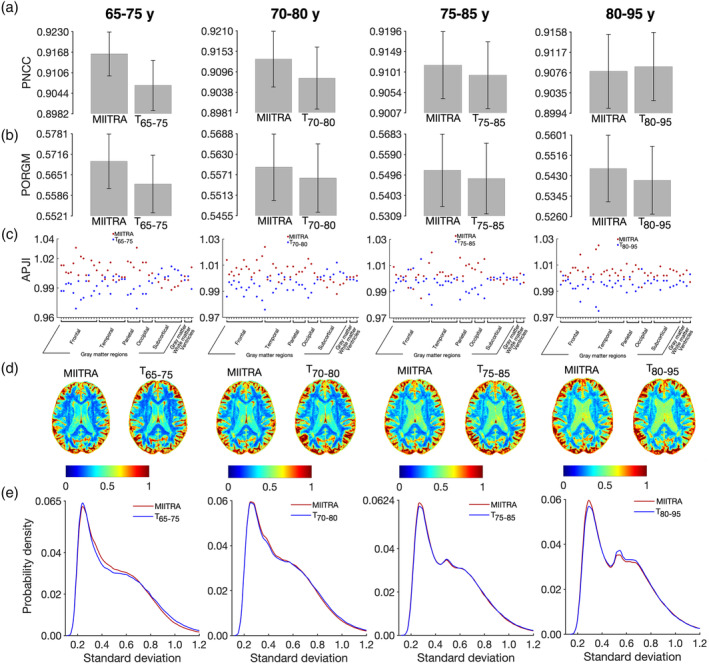
(a) Average pairwise normalized cross‐correlation (PNCC), (b) average pairwise overlap of FreeSurfer‐generated regional gray matter labels (PORGM), (c) average pairwise Jaccard index (PJI) for individual gray matter labels, as well as for whole gray matter, white matter, and ventricles, (d) maps and (e) histograms of the SD of image intensities of spatially normalized Alzheimer's Disease Neuroimaging Initiative (ADNI) data from narrow age‐range subsets of Dataset 2 (Dataset 265–75, Dataset 270–80, Dataset 275–85, Dataset 280–95), when using Multichannel Illinois Institute of Technology & Rush university Aging (MIITRA) or the corresponding narrow age‐range templates (T65–75, T70–80, T75–85, T80–95) as reference. The error‐bars denote the SD of PNCC and PORGM
3.4. Impact of spatial normalization accuracy on the ability to detect small inter‐group differences in voxel‐based morphometry studies
Power analysis showed that use of the MIITRA and SS templates allowed detection of smaller inter‐group morphometric differences in gray matter compared to other templates. This was demonstrated in Figure 10 as a higher number of gray matter voxels with cooler colors and a lower number of voxels with warmer colors for MIITRA and SS templates (multiple slices through the whole brain are shown in Appendix S5). Also, the cumulative distribution of the minimum detectable inter‐group morphometric differences was significantly higher for MIITRA and SS templates compared to other templates (p < 10−11 in all cases, one‐sided two‐sample KS test) (Figure 10b).
FIGURE 10.
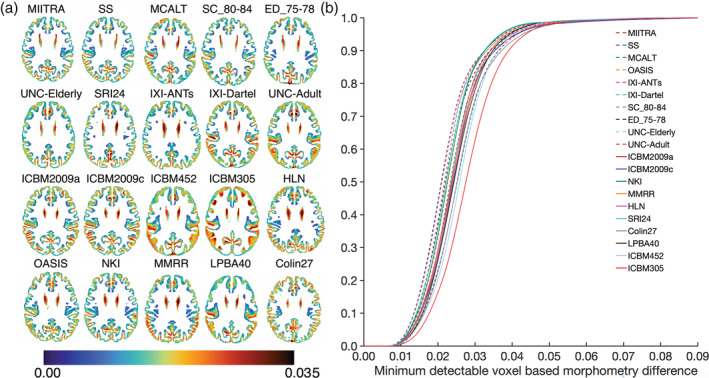
(a) Maps and (b) cumulative distributions of the minimum detectable inter‐group morphometric differences in gray matter when using Multichannel Illinois Institute of Technology & Rush university Aging (MIITRA), other standardized and study‐specific (SS) templates as reference
3.5. Comparison of templates in terms of their representativeness of the older adult brain
How representative different standardized and study specific templates are of the older adult brain was evaluated next. It was demonstrated that, compared to all other publicly available standardized templates, the MIITRA template resulted in a higher number of voxels with an average log‐Jacobian determinant near zero (Figure 11) (p < 10−10 in terms of expansion and p < 10−10 in terms of contraction), suggesting that the MIITRA template is more representative of the older adult brain. The SS template resulted in similar but slightly less deformation on average in terms of expansion (p < 10−7) and contraction (p < 10−10) when compared to the MIITRA template (Figure 11). Regional analysis showed consistently low levels of deformation in all regions for MIITRA and SS templates (Appendix S6).
FIGURE 11.
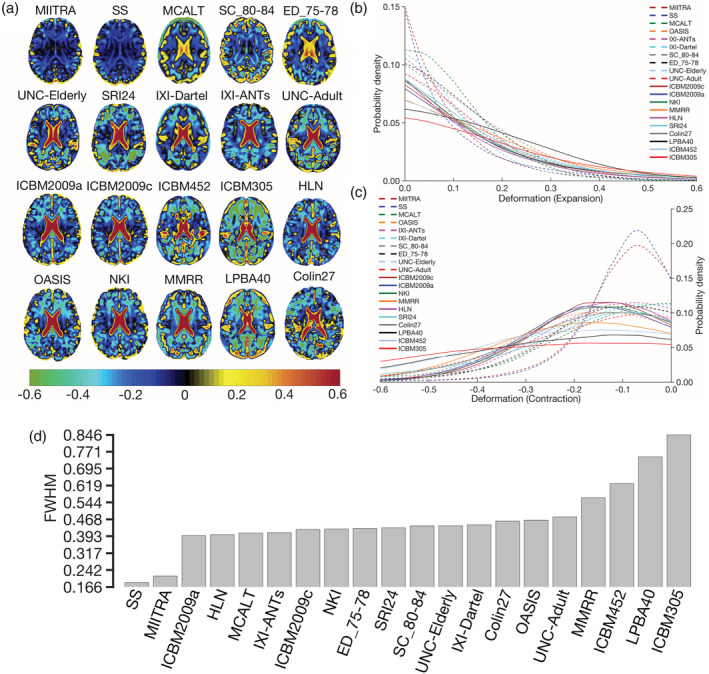
(a) Maps of the average of the log‐Jacobian determinant of the deformation of spatially normalized Alzheimer's Disease Neuroimaging Initiative (ADNI) data when using Multichannel Illinois Institute of Technology & Rush university Aging (MIITRA), other standardized and study‐specific (SS) templates as reference. (b) Histograms depicting the average deformation of spatially normalized ADNI data in terms of expansion and (c) contraction for registration to the different templates. (d) Full‐width‐at‐half‐max (FWHM) of the histograms obtained by combining (b, c)
MIITRA and the narrow age‐range templates (T65–75, T70–80, T75–85, T80–95) were evaluated in terms of their representativeness of older adult brains from age groups with a narrow age‐range using subsets of Dataset 2 (Dataset 265–75, Dataset 270–80, Dataset 275–85, Dataset 280–95) (Figure 12). It was demonstrated that the MIITRA template resulted in a similar but slightly higher number of voxels with an average log‐Jacobian determinant near zero compared to the narrow age‐range templates (p < 10−7 for expansion, Figure 12b; and p = 10−10 for contraction, Figure 12c). The only exception was that the T70–80 template exhibited slightly less deformation on average than the MIITRA template in terms of expansion (p = 10−7) (Figure 12b). These results were in agreement with regional findings (Appendix S7).
FIGURE 12.
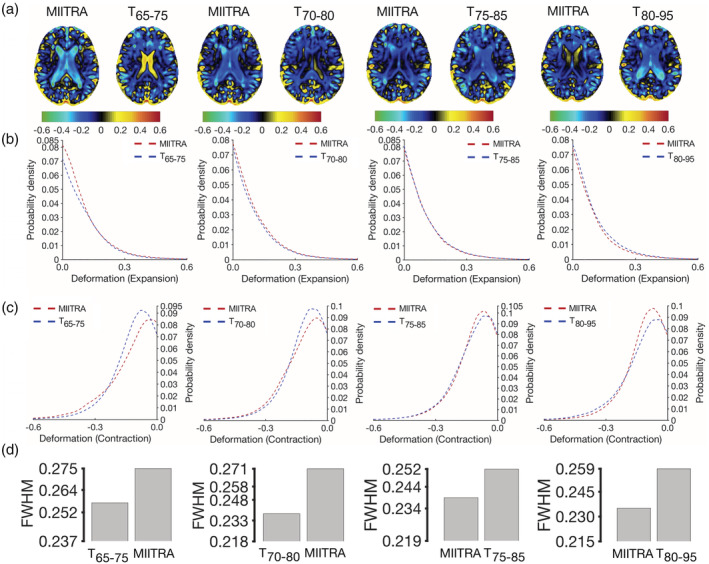
(a) Maps of the average of the log‐Jacobian determinant of the deformation of spatially normalized Alzheimer's Disease Neuroimaging Initiative (ADNI) data with narrow age‐range when using Multichannel Illinois Institute of Technology & Rush university Aging (MIITRA) or the corresponding narrow age‐range templates as reference. (b) Histograms depicting the average deformation of spatially normalized ADNI data in terms of expansion and (c) contraction for registration to the different templates. (d) Full‐width‐at‐half‐max (FWHM) of the histograms obtained by combining (b, c)
4. DISCUSSION
The present work constructed a high‐quality standardized T1‐weighted template of the older adult brain (MIITRA) (available for download at www.nitrc.org/projects/miitra) and systematically compared the new template and several other standardized and SS templates, in terms of image quality, inter‐subject spatial normalization accuracy for older adult data, detection of small inter‐group morphometric differences, and representativeness of the older adult brain. The new template was constructed using (a) high‐quality data from (b) 222 older adults, a number that was shown to be almost twice the minimum number of persons necessary for building a template that provides high spatial normalization accuracy, (c) thorough data pre‐processing, and (d) a state‐of‐the‐art spatial normalization strategy. It was shown that MIITRA was among the templates exhibiting highest image sharpness, an important prerequisite for providing high spatial normalization accuracy. Compared to all other standardized templates, MIITRA allowed higher inter‐subject spatial normalization accuracy for older adult data, facilitated detection of smaller inter‐group morphometric differences, and was more representative of the older adult brain. Furthermore, the MIITRA template had similar performance to that of a SS template built with the same technique. Finally, compared to templates developed based on subsets of the available data with a narrower age‐range, MIITRA provided similar spatial normalization accuracy for older adult data with a narrow age‐range, and was as representative of such data. The present work has important implications for template selection in studies on older adults, a critical step that is often overlooked and directly impacts spatial normalization accuracy as well as the overall accuracy of the studies themselves.
4.1. Effect of the number of persons considered in template construction on template performance
Spatial matching of older adult data improved on average and was less variable across older adults when using standardized templates constructed with data from a higher number of individuals. A plateau was reached after ~120 individuals. At least two factors may have contributed to these findings. First, templates constructed with few individuals may contain person‐specific features rendering them less representative of older adult brains in general (Joshi et al., 2004), thereby resulting in spatial normalization accuracy that is lower on average and more variable across older adults. Another factor that may have played a role in the above findings is the fact that templates constructed based on higher numbers of individuals are characterized by higher signal to noise ratio, improving spatial normalization accuracy. After including at least 120 individuals in the construction of a T1‐weighted template of the older adult brain, person‐specific features have generally been eliminated, and template characteristics such as signal to noise ratio are sufficiently high that any further increase is not causing any substantial further improvement in spatial normalization accuracy. Therefore, the fact that the MIITRA template was constructed using high‐quality data from 222 older adults indicates high and stable performance of this new template in studies on older adults.
4.2. Comparison of template image sharpness
The MIITRA and SS templates were shown to be among the templates exhibiting the highest image sharpness. This is probably due to the accurate spatial matching achieved with the approach of Section 2.3 and the high‐quality data used in the construction of these templates. The present work avoided edge enhancement, used in some of the available templates (e.g., OASIS, HLN, MMRR), mainly to eliminate any potential bias that would make the templates less representative of the data from individual subjects. Although early neuroimaging studies blurred the templates as well as the data from individual subjects prior to spatial normalization to overcome limitations of image registration algorithms, the most advanced nonlinear registration tools available nowadays can benefit from a sharp template where edges and transitions between structures are accurately represented. Therefore, the high sharpness of the MIITRA template is another important characteristic that provides the foundation for high spatial normalization accuracy.
4.3. Comparison of inter‐subject spatial normalization accuracy
4.3.1. MIITRA versus other standardized and SS templates
The MIITRA template provided higher inter‐subject spatial normalization accuracy for older adult data compared to other available standardized templates considered in this work, and similar normalization accuracy to that achieved with the SS template. Achieving accurate spatial normalization is crucial in voxel‐wise analyses because spatial matching of tissues across subjects directly impacts the sensitivity and specificity of the analyses (Zhang & Arfanakis, 2018). This was demonstrated in Section 3.4 where it was shown that the MIITRA and SS templates allowed detection of smaller inter‐group morphometric differences compared to other templates.
The SS template provided only slightly higher spatial normalization accuracy than MIITRA, probably due to the fact that it was constructed from the same ADNI data that were registered to it. Nevertheless, this was only a marginal improvement, and when deciding between the MIITRA or SS templates there are multiple other factors that must be considered and which indicate that the MIITRA template may be more preferable over SS templates. First, the method used to develop both the MIITRA and SS templates (Section 2.3) was designed to maximize template quality without limiting the time necessary to achieve this goal. Although significant effort was invested in the present study to design and implement a fast template construction approach, template quality was the primary consideration. Consequently, development of the MIITRA or SS templates required ~96 hr on 222 processors with 256 GB memory. Investing this amount of time in every template‐based study to construct corresponding SS templates may not be ideal. In contrast, use of the standardized MIITRA template requires no time for development. If speed is prioritized over template quality, the resulting SS template will be of lower quality than that presented in this work. Similarly, when a less optimized SS template construction method is used, or the raw data quality of a study is lower, or the number of participants is small, the resulting SS template will be of lower quality (potentially far lower quality) than that presented in this work. In brief, the standardized MIITRA template will generate consistently high spatial normalization accuracy for all studies without spending any time to build it, while SS templates will provide variable normalization accuracy that may be significantly lower than that presented here, and must be constructed for every study separately. Furthermore, even though the same older adult data that were registered to the different templates were used in the construction of the SS but not the MIITRA template, spatial normalization accuracy was almost the same for the two templates. This indicates that the MIITRA template may be rather representative of older adult data from other cohorts, probably due to the high number of persons included in its construction. Thus, a carefully built SS template may be only marginally more representative of the data under study. In addition, adoption of a high‐quality standardized template such as MIITRA by the neuroimaging community will facilitate integration and comparison of findings across studies. Finally, use of the MIITRA T1‐weighted template which is part of an atlas that will eventually include multiple other resources in the same space (other templates and semantic labels) may enhance functionality in neuroimaging studies on older adults.
4.3.2. MIITRA versus narrow age‐range templates
Spatial normalization accuracy for data from older adults with a narrow age‐range was generally similar, or slightly higher, when using the MIITRA template compared to the corresponding narrow age‐range standardized templates. This finding was due to the fact that the wider age‐range MIITRA template was constructed using data from more older adults (222) than the narrower age‐range templates (60), naturally, since the persons included in the latter were subsets of those included in the former. This difference in the number of older adults considered in template construction could be eliminated if longitudinal data from 65 to 95 years of age (30 years of data) were available for all participants, which would have also allowed construction of a spatio‐temporally consistent longitudinal template (Zhang et al., 2016). However, collecting longitudinal data for such a long period of time while also ensuring consistent image quality has not been accomplished to date. Without such longitudinal data, the difference in the number of older adults considered in construction of a single wide age‐range template versus multiple narrow age‐range templates is inevitable, and has the implications for spatial normalization accuracy discussed in Section 4.1. The high performance of the MIITRA template even in groups of older adults with narrow age‐range implies that constructing narrow age‐range T1‐weighted templates may not be necessary for spatial normalization purposes in studies on older adults.
4.4. Comparison of templates in terms of their representativeness of the older adult brain
4.4.1. MIITRA versus other standardized and SS templates
The MIITRA template required the least average deformation for spatial normalization of older adult data compared to all other standardized templates, indicating that MIITRA was most representative of such data in terms of shape and volume. Only the SS template showed a slightly lower average deformation than MIITRA, suggesting that the SS template was slightly more representative of the data, which was anticipated since the SS template was built from the same data used in the assessment of spatial normalization accuracy. These findings have important implications in template selection for use in studies on older adults, as they suggest that the standardized MIITRA template is essentially as representative of the data used in the construction of the SS template as the SS template itself, while at the same time it provides numerous other advantages over SS templates that were presented in detail in Section 4.3.1. Finally, the whole brain and regional results showing that the MIITRA and SS templates provided highest spatial normalization accuracy but required the least average deformation indicate that the high normalization accuracy was not due to very elastic, “unrealistic” deformations.
4.4.2. MIITRA versus narrow age‐range templates
The MIITRA template required similar or slightly lower deformation for spatially normalizing data from older adults with a narrow age‐range compared to the corresponding narrow age‐range standardized templates. This suggests that the MIITRA template represents well older adult brains from narrow age‐ranges and further supports the conclusion of Section 4.3.2 that constructing narrow age‐range T1‐weighted templates may not be necessary for spatial normalization purposes in studies on older adults (65–95 years of age).
Finally, in this section on template representativeness of the older adult brain, it should be clarified that a population template that is representative of the shape and size of various brain structures does not include all possible features of the older adult brain. For example, features that are not highly prevalent or lesions that do not have a consistent location across subjects (e.g., microbleeds, infarcts) are averaged out and are not visible in population templates.
4.5. Caveats
One caveat needs to be considered when interpreting the results of this work. Spatial normalization accuracy does not only depend on the template, but also on the registration algorithm and the quality of the individual data. To address this issue, a state of the art publicly available registration algorithm (ANTs SyN) (Avants et al., 2008, 2011; Klein et al., 2009) was used for spatial normalization, and ADNI T1‐weighted data of typical image quality were used for evaluating the template performance (Erten‐Lyons et al., 2012; Petersen et al., 2010). Different registration algorithms, as well as data from other studies of aging, and data collected with MRI scanners of different vendors and with different T1‐weighted image acquisition protocols should be considered in the future.
5. CONCLUSION
The present work has important implications for template selection in studies on older adults, a critical step that is often overlooked and directly impacts spatial normalization accuracy as well as the overall accuracy of the studies themselves. This work constructed a high‐quality standardized T1‐weighted brain template specifically for use in studies on older adults, named MIITRA, and systematically evaluated the new template and several other standardized and SS templates. The number of older adults included in the new template was shown to be sufficient for ensuring consistently high spatial normalization accuracy of older adult data. The MIITRA template was among those templates that exhibited highest image sharpness. Compared to all other publicly available standardized templates, MIITRA allowed higher inter‐subject spatial normalization accuracy for older adult data, facilitated detection of smaller inter‐group morphometric differences, and was more representative of the older adult brain. Compared to narrow age‐range standardized templates, MIITRA had similar performance suggesting that narrow age‐range T1‐weighted brain templates are not necessary for spatial normalization of older adult data. Compared to SS templates, MIITRA also exhibited similar performance. However, SS templates must be constructed in each study separately, and if not constructed carefully they can have substantially lower performance than MIITRA. Overall, the MIITRA T1‐weighted template combines a number of desirable properties for use in studies on older adults over other available standardized and SS templates: (a) it is characterized by high image quality, (b) provides consistently high inter‐subject spatial normalization accuracy for older adult data, (c) allows detection of small inter‐group morphometric differences, (d) is representative of the older adult brain, (e) allows integration of results across studies, and because it is standardized, (f) eliminates time‐consuming and potentially sub‐optimal SS template construction. The factors that contributed to the quality of the MIITRA T1‐weighted template were the: (a) use of high‐quality data, (b) inclusion of a sufficiently high number of older adults, (c) thorough data pre‐processing, and (d) use of a state‐of‐the‐art spatial normalization strategy. The MIITRA T1‐weighted template is available for download at www.nitrc.org/projects/miitra.
CONFLICT OF INTEREST
The authors declare no conflict of interest to report.
Supporting information
Appendix S1: Supplementary Information
ACKNOWLEDGMENTS
The authors would like to thank the participants and staff of the Rush University Memory and Aging Project. This study was supported by National Institutes of Health grants R01AG052200, P30AG010161, R01AG17917. In addition, part of the data collection and sharing for this project was funded by the Alzheimer's Disease Neuroimaging Initiative (ADNI) (National Institutes of Health Grant U01 AG024904) and DOD ADNI (Department of Defense award number W81XWH‐12‐2‐0012). ADNI is funded by the National Institute on Aging, the National Institute of Biomedical Imaging and Bioengineering, and generous contributions from the following: AbbVie; Alzheimer's Association; Alzheimer's Drug Discovery Foundation; Araclon Biotech; BioClinica, Inc.; Biogen; Bristol‐Myers Squibb Company; CereSpir, Inc.; Cogstate; Eisai; Elan Pharmaceuticals, Inc.; Eli Lilly and Company; EuroImmun; F. Hoffmann‐La Roche and its affiliated company Genentech, Inc.; Fujirebio; GE Healthcare; IXICO Ltd.; Janssen Alzheimer Immunotherapy Research & Development, LLC.; Johnson & Johnson Pharmaceutical Research & Development LLC.; Lumosity; Lundbeck; Merck & Co., Inc.; Meso Scale Diagnostics, LLC.; NeuroRx Research; Neurotrack Technologies; Novartis Pharmaceuticals Corporation; Pfizer Inc.; Piramal Imaging; Servier; Takeda Pharmaceutical Company; and Transition Therapeutics. The Canadian Institutes of Health Research is providing funds to support ADNI clinical sites in Canada. Private sector contributions are facilitated by the Foundation for the National Institutes of Health (www.fnih.org/). The grantee organization is the Northern California Institute for Research and Education, and the study is coordinated by the Alzheimer's Therapeutic Research Institute at the University of Southern California. ADNI data are disseminated by the Laboratory for Neuro Imaging at the University of Southern California.
Ridwan AR, Niaz MR, Wu Y, et al. Development and evaluation of a high performance T1‐weighted brain template for use in studies on older adults. Hum Brain Mapp. 2021;42:1758–1776. 10.1002/hbm.25327
Alzheimer's Disease Neuroimaging Initiative: A portion of the data used in preparation of this article were obtained from the Alzheimer's Disease Neuroimaging Initiative (ADNI) database (adni.loni.usc.edu). As such, the investigators within the ADNI contributed to the design and implementation of ADNI and/or provided data but did not participate in analysis or writing of this report. A complete listing of ADNI investigators can be found at: http://adni.loni.usc.edu/wp-content/uploads/how_to_apply/ADNI_Acknowledgement_List.pdf
Funding information National Institute on Aging, Grant/Award Numbers: P30AG010161, R01AG052200, R01AG17917; National Institutes of Health, Grant/Award Number: U01 AG024904; U.S. Department of Defense, Grant/Award Number: W81XWH‐12‐2‐0012
DATA AVAILABILITY STATEMENT
The data of Dataset 1 can be accessed by submitting a request to www.radc.rush.edu.
REFERENCES
- Ashburner, J. (2007). A fast diffeomorphic image registration algorithm. NeuroImage, 38(1), 95–113. [DOI] [PubMed] [Google Scholar]
- Ashburner, J. , & Friston, K. J. (2000). Voxel‐based morphometry—The methods. NeuroImage, 11(6), 805–821. [DOI] [PubMed] [Google Scholar]
- Avants, B. B. , Epstein, C. L. , Grossman, M. , & Gee, J. C. (2008). Symmetric diffeomorphic image registration with cross‐correlation: Evaluating automated labeling of elderly and neurodegenerative brain. Medical Image Analysis, 12(1), 26–41. [DOI] [PMC free article] [PubMed] [Google Scholar]
- Avants, B. B. , Tustison, N. J. , Song, G. , Cook, P. A. , Klein, A. , & Gee, J. C. (2011). A reproducible evaluation of ANTs similarity metric performance in brain image registration. NeuroImage, 54(3), 2033–2044. [DOI] [PMC free article] [PubMed] [Google Scholar]
- Avants, B. B. , Tustison, N. , & Song, G. (2009). Advanced normalization tools (ANTS). Insight Journal, 2, 1–35. [Google Scholar]
- Avants, B. B. , Yushkevich, P. , Pluta, J. , Minkoff, D. , Korczykowski, M. , Detre, J. , & Gee, J. C. (2010). The optimal template effect in hippocampus studies of diseased populations. NeuroImage, 49(3), 2457–2466. [DOI] [PMC free article] [PubMed] [Google Scholar]
- Avants, B. , & Tustison, N. (2018). ANTs/ANTsR brain templates. Retrieved from 10.6084/m9.figshare.915436.v2. [DOI]
- Bennett, D. A. , Buchman, A. S. , Boyle, P. A. , Barnes, L. L. , Wilson, R. S. , & Schneider, J. A. (2018). Religious orders study and rush memory and aging project. Journal of Alzheimer's Disease: JAD, 64(s1), S161–S189. 10.3233/JAD-179939 [DOI] [PMC free article] [PubMed] [Google Scholar]
- Blatter, D. D. , Bigler, E. D. , Gale, S. D. , Johnson, S. C. , Anderson, C. V. , Burnett, B. M. , … Horn, S. D. (1995). Quantitative volumetric analysis of brain MR: Normative database spanning 5 decades of life. American Journal of Neuroradiology, 16(2), 241–251. [PMC free article] [PubMed] [Google Scholar]
- Braun, U. , Plichta, M. M. , Esslinger, C. , Sauer, C. , Haddad, L. , Grimm, O. , … Meyer‐Lindenberg, A. (2012). Test–retest reliability of resting‐state connectivity network characteristics using fMRI and graph theoretical measures. NeuroImage, 59(2), 1404–1412. 10.1016/j.neuroimage.2011.08.044 [DOI] [PubMed] [Google Scholar]
- Buckner, R. L. , Head, D. , Parker, J. , Fotenos, A. F. , Marcus, D. , Morris, J. C. , & Snyder, A. Z. (2004). A unified approach for morphometric and functional data analysis in young, old, and demented adults using automated atlas‐based head size normalization: Reliability and validation against manual measurement of total intracranial volume. NeuroImage, 23(2), 724–738. [DOI] [PubMed] [Google Scholar]
- Chen, G. , Zhang, H.‐Y. , Xie, C. , Chen, G. , Zhang, Z.‐J. , Teng, G.‐J. , & Li, S.‐J. (2013). Modular reorganization of brain resting state networks and its independent validation in Alzheimer's disease patients. Frontiers in Human Neuroscience, 7, 456. 10.3389/fnhum.2013.00456 [DOI] [PMC free article] [PubMed] [Google Scholar]
- Courchesne, E. , Chisum, H. J. , Townsend, J. , Cowles, A. , Covington, J. , Egaas, B. , … Press, G. A. (2000). Normal brain development and aging: Quantitative analysis at in vivo MR imaging in healthy volunteers. Radiology, 216(3), 672–682. [DOI] [PubMed] [Google Scholar]
- Crum, W. R. , Camara, O. , & Hill, D. L. G. (2006). Generalized overlap measures for evaluation and validation in medical image analysis. IEEE Transactions on Medical Imaging, 25(11), 1451–1461. [DOI] [PubMed] [Google Scholar]
- Dickie, D. A. , Karama, S. , Ritchie, S. J. , Cox, S. R. , Sakka, E. , Royle, N. A. , … Pattie, A. (2016). Progression of white matter disease and cortical thinning are not related in older community‐dwelling subjects. Stroke, 47(2), 410–416. [DOI] [PMC free article] [PubMed] [Google Scholar]
- Dickie, D. A. , Ritchie, S. J. , Cox, S. R. , Sakka, E. , Royle, N. A. , Aribisala, B. S. , … Corley, J. (2016). Vascular risk factors and progression of white matter hyperintensities in the Lothian Birth Cohort 1936. Neurobiology of Aging, 42, 116–123. [DOI] [PMC free article] [PubMed] [Google Scholar]
- Doshi, J. , Erus, G. , Ou, Y. , Gaonkar, B. , & Davatzikos, C. (2013). Multi‐Atlas Skull‐Stripping. Academic Radiology, 20(12), 1566–1576. 10.1016/J.ACRA.2013.09.010 [DOI] [PMC free article] [PubMed] [Google Scholar]
- Erten‐Lyons, D. , Sherbakov, L. O. , Piccinin, A. M. , Hofer, S. M. , Dodge, H. H. , Quinn, J. F. , … Kaye, J. A. (2012). Review of selected databases of longitudinal aging studies. Alzheimer's & Dementia: The Journal of the Alzheimer's Association, 8(6), 584–589. 10.1016/j.jalz.2011.09.232 [DOI] [PMC free article] [PubMed] [Google Scholar]
- Evans, A. C. (1994). Three‐dimensional correlative imaging: Applications in human brain mapping. Functional Neuroimaging: Technical Foundations, 2, 145–162. [Google Scholar]
- Faria, A. V. , Joel, S. E. , Zhang, Y. , Oishi, K. , van Zjil, P. C. M. , Miller, M. I. , … Mori, S. (2012). Atlas‐based analysis of resting‐state functional connectivity: Evaluation for reproducibility and multi‐modal anatomy–function correlation studies. NeuroImage, 61(3), 613–621. 10.1016/j.neuroimage.2012.03.078 [DOI] [PMC free article] [PubMed] [Google Scholar]
- Farokhian, F. , Beheshti, I. , Sone, D. , & Matsuda, H. (2017). Comparing CAT12 and VBM8 for detecting brain morphological abnormalities in temporal lobe epilepsy. Frontiers in Neurology, 8, 428. 10.3389/fneur.2017.00428 [DOI] [PMC free article] [PubMed] [Google Scholar]
- Ferreira, J. R. , Oliveira, M. C. , & Freitas, A. L. (2014). Performance evaluation of medical image similarity analysis in a heterogeneous architecture. Paper presented at the 2014 IEEE 27th International Symposium on Computer‐Based Medical Systems, New York (pp. 159–164). 10.1109/CBMS.2014.65 [DOI]
- Fillmore, P. T. , Phillips‐Meek, M. C. , & Richards, J. E. (2015). Age‐specific MRI brain and head templates for healthy adults from 20 through 89 years of age. Frontiers in Aging Neuroscience, 7, 44. [DOI] [PMC free article] [PubMed] [Google Scholar]
- Fischl, B. (2012). FreeSurfer. NeuroImage, 62(2), 774–781. [DOI] [PMC free article] [PubMed] [Google Scholar]
- Fonov, V. , Evans, A. C. , Botteron, K. , Almli, C. R. , McKinstry, R. C. , Collins, D. L. , & Group, B. D. C . (2011). Unbiased average age‐appropriate atlases for pediatric studies. NeuroImage, 54(1), 313–327. [DOI] [PMC free article] [PubMed] [Google Scholar]
- Fonov, V. S. , Evans, A. C. , McKinstry, R. C. , Almli, C. R. , & Collins, D. L. (2009). Unbiased nonlinear average age‐appropriate brain templates from birth to adulthood. NeuroImage, 47, S102. [Google Scholar]
- Galluzzi, S. , Beltramello, A. , Filippi, M. , & Frisoni, G. B. (2008). Aging. Neurological Sciences, 29(S3), 296–300. 10.1007/s10072-008-1002-6 [DOI] [PubMed] [Google Scholar]
- Gholipour, A. , Limperopoulos, C. , Clancy, S. , Clouchoux, C. , Akhondi‐Asl, A. , Estroff, J. A. , & Warfield, S. K. (2014). Construction of a deformable spatiotemporal MRI atlas of the fetal brain: Evaluation of similarity metrics and deformation models. Medical Image Computing and Computer‐Assisted Intervention: MICCAI, 17(Pt 2), 292–299. [DOI] [PMC free article] [PubMed] [Google Scholar]
- Goldszal, A. F. , Davatzikos, C. , Pham, D. L. , Yan, M. X. H. , Bryan, R. N. , & Resnick, S. M. (1998). An image‐processing system for qualitative and quantitative volumetric analysis of brain images. Journal of Computer Assisted Tomography, 22(5), 827–837. [DOI] [PubMed] [Google Scholar]
- Good, C. D. , Johnsrude, I. S. , Ashburner, J. , Henson, R. N. A. , Friston, K. J. , & Frackowiak, R. S. J. (2001). A voxel‐based morphometric study of ageing in 465 normal adult human brains. NeuroImage, 14(1), 21–36. [DOI] [PubMed] [Google Scholar]
- Good, C. D. , Scahill, R. I. , Fox, N. C. , Ashburner, J. , Friston, K. J. , Chan, D. , … Frackowiak, R. S. J. (2002). Automatic differentiation of anatomical patterns in the human brain: Validation with studies of degenerative dementias. NeuroImage, 17(1), 29–46. 10.1006/nimg.2002.1202 [DOI] [PubMed] [Google Scholar]
- Grau, V. , Mewes, A. U. J. , Alcaniz, M. , Kikinis, R. , & Warfield, S. K. (2004). Improved watershed transform for medical image segmentation using prior information. IEEE Transactions on Medical Imaging, 23(4), 447–458. 10.1109/TMI.2004.824224 [DOI] [PubMed] [Google Scholar]
- Guimond, A. , Meunier, J. , & Thirion, J.‐P. (2000). Average brain models: A convergence study. Computer Vision and Image Understanding, 77(2), 192–210. [Google Scholar]
- Heckemann, R. A. , Ledig, C. , Gray, K. R. , Aljabar, P. , Rueckert, D. , Hajnal, J. V. , & Hammers, A. (2015). Brain extraction using label propagation and group agreement: Pincram. PLoS One, 10(7), e0129211. 10.1371/journal.pone.0129211 [DOI] [PMC free article] [PubMed] [Google Scholar]
- Holmes, C. J. , Hoge, R. , Collins, L. , Woods, R. , Toga, A. W. , & Evans, A. C. (1998). Enhancement of MR images using registration for signal averaging. Journal of Computer Assisted Tomography, 22(2), 324–333. [DOI] [PubMed] [Google Scholar]
- Huang, C.‐M. , Lee, S.‐H. , Hsiao, T. , Kuan, W.‐C. , Wai, Y.‐Y. , Ko, H.‐J. , … Liu, H.‐L. (2010). Study‐specific EPI template improves group analysis in functional MRI of young and older adults. Journal of Neuroscience Methods, 189(2), 257–266. [DOI] [PubMed] [Google Scholar]
- Josephs, K. A. , Whitwell, J. L. , Weigand, S. D. , Murray, M. E. , Tosakulwong, N. , Liesinger, A. M. , … Dickson, D. W. (2014). TDP‐43 is a key player in the clinical features associated with Alzheimer's disease. Acta Neuropathologica, 127(6), 811–824. 10.1007/s00401-014-1269-z [DOI] [PMC free article] [PubMed] [Google Scholar]
- Joshi, S. , Davis, B. , Jomier, M. , & Gerig, G. (2004). Unbiased diffeomorphic atlas construction for computational anatomy. NeuroImage, 23, S151–S160. [DOI] [PubMed] [Google Scholar]
- Karas, G. B. , Burton, E. J. , Rombouts, S. A. R. B. , Van Schijndel, R. A. , O'Brien, J. T. , Scheltens, P. , … Barkhof, F. (2003). A comprehensive study of gray matter loss in patients with Alzheimer's disease using optimized voxel‐based morphometry. NeuroImage, 18(4), 895–907. 10.1016/S1053-8119(03)00041-7 [DOI] [PubMed] [Google Scholar]
- Klein, A. (2016). In Klein A. A.‐N. (Ed.), V2 ed. Mindboggle‐101 templates (unlabeled images from a population of brains). Harvard Dataverse. 10.7910/DVN/WDIYB5 [DOI] [Google Scholar]
- Klein, A. , Andersson, J. , Ardekani, B. A. , Ashburner, J. , Avants, B. , Chiang, M.‐C. , … Parsey, R. V. (2009). Evaluation of 14 nonlinear deformation algorithms applied to human brain MRI registration. NeuroImage, 46(3), 786–802. 10.1016/j.neuroimage.2008.12.037 [DOI] [PMC free article] [PubMed] [Google Scholar]
- Kwon, D. , Shinohara, R. T. , Akbari, H. , & Davatzikos, C. (2014). Combining generative models for multifocal glioma segmentation and registration. Medical Image Computing and Computer‐Assisted Intervention: MICCAI, 17(Pt 1), 763–770. [DOI] [PMC free article] [PubMed] [Google Scholar]
- Lemaître, H. , Crivello, F. , Grassiot, B. , Alpérovitch, A. , Tzourio, C. , & Mazoyer, B. (2005). Age‐and sex‐related effects on the neuroanatomy of healthy elderly. NeuroImage, 26(3), 900–911. [DOI] [PubMed] [Google Scholar]
- Leow, A. D. , Yanovsky, I. , Chiang, M.‐C. , Lee, A. D. , Klunder, A. D. , Lu, A. , … Thompson, P. M. (2007). Statistical properties of Jacobian maps and the realization of unbiased large‐deformation nonlinear image registration. IEEE Transactions on Medical Imaging, 26(6), 822–832. 10.1109/TMI.2007.892646 [DOI] [PubMed] [Google Scholar]
- Liu, F. , Guo, W. , Fouche, J.‐P. , Wang, Y. , Wang, W. , Ding, J. , … Chen, H. (2015). Multivariate classification of social anxiety disorder using whole brain functional connectivity. Brain Structure and Function, 220(1), 101–115. 10.1007/s00429-013-0641-4 [DOI] [PubMed] [Google Scholar]
- Matsumae, M. , Kikinis, R. , Mórocz, I. A. , Lorenzo, A. V. , Sándor, T. , Albert, M. S. , … Jolesz, F. A. (1996). Age‐related changes in intracranial compartment volumes in normal adults assessed by magnetic resonance imaging. Journal of Neurosurgery, 84(6), 982–991. 10.3171/jns.1996.84.6.0982 [DOI] [PubMed] [Google Scholar]
- Mazziotta, J. , Toga, A. , Evans, A. , Fox, P. , Lancaster, J. , Zilles, K. , … Mazoyer, B. (2001). A probabilistic atlas and reference system for the human brain: International Consortium for Brain Mapping (ICBM). Philosophical Transactions of the Royal Society of London. Series B, Biological Sciences, 356(1412), 1293–1322. 10.1098/rstb.2001.0915 [DOI] [PMC free article] [PubMed] [Google Scholar]
- McGovern, E. M. , Killian, O. , Narasimham, S. , Quinlivan, B. , Butler, J. B. , Beck, R. , … Hutchinson, M. (2017). Disrupted superior collicular activity may reveal cervical dystonia disease pathomechanisms. Scientific Reports, 7(1), 16753. 10.1038/s41598-017-17074-x [DOI] [PMC free article] [PubMed] [Google Scholar]
- McCarthy, C. S. , Ramprashad, A. , Thompson, C. , Botti, J.‐A. , Coman, I. L. , & Kates, W. R. (2015). A comparison of FreeSurfer‐generated data with and without manual intervention. Frontiers in Neuroscience, 9, 379. 10.3389/fnins.2015.00379 [DOI] [PMC free article] [PubMed] [Google Scholar]
- Mechelli, A. , Price, C. J. , Friston, K. J. , & Ashburner, J. (2005). Voxel‐based morphometry of the human brain: Methods and applications. Current Medical Imaging Reviews, 1(2), 105–113. [Google Scholar]
- Mega, M. S. , Dinov, I. D. , Mazziotta, J. C. , Manese, M. , Thompson, P. M. , Lindshield, C. , … Zoumalan, C. I. (2005). Automated brain tissue assessment in the elderly and demented population: Construction and validation of a sub‐volume probabilistic brain atlas. NeuroImage, 26(4), 1009–1018. [DOI] [PubMed] [Google Scholar]
- Moayedi, M. , Salomons, T. V. , & Atlas, L. Y. (2018). Pain neuroimaging in humans: A primer for beginners and non‐imagers. The Journal of Pain: Official Journal of the American Pain Society, 19(9), 961.e1–961.e21. 10.1016/j.jpain.2018.03.011 [DOI] [PMC free article] [PubMed] [Google Scholar]
- Petersen, R. C. , Aisen, P. S. , Beckett, L. A. , Donohue, M. C. , Gamst, A. C. , Harvey, D. J. , … Weiner, M. W. (2010). Alzheimer's Disease Neuroimaging Initiative (ADNI): Clinical characterization. Neurology, 74(3), 201–209. 10.1212/WNL.0b013e3181cb3e25 [DOI] [PMC free article] [PubMed] [Google Scholar]
- Pfefferbaum, A. , Rohlfing, T. , Rosenbloom, M. J. , Chu, W. , Colrain, I. M. , & Sullivan, E. V. (2013). Variation in longitudinal trajectories of regional brain volumes of healthy men and women (ages 10 to 85 years) measured with atlas‐based parcellation of MRI. NeuroImage, 65, 176–193. [DOI] [PMC free article] [PubMed] [Google Scholar]
- Pineda‐Pardo, J. A. , Bruña, R. , Woolrich, M. , Marcos, A. , Nobre, A. C. , Maestú, F. , & Vidaurre, D. (2014). Guiding functional connectivity estimation by structural connectivity in MEG: An application to discrimination of conditions of mild cognitive impairment. NeuroImage, 101, 765–777. 10.1016/J.NEUROIMAGE.2014.08.002 [DOI] [PMC free article] [PubMed] [Google Scholar]
- Radua, J. , Canales‐Rodríguez, E. J. , Pomarol‐Clotet, E. , & Salvador, R. (2014). Validity of modulation and optimal settings for advanced voxel‐based morphometry. NeuroImage, 86, 81–90. 10.1016/j.neuroimage.2013.07.084 [DOI] [PubMed] [Google Scholar]
- Rohlfing, T. (2012). Image similarity and tissue overlaps as surrogates for image registration accuracy: Widely used but unreliable. IEEE Transactions on Medical Imaging, 31(2), 153–163. 10.1109/TMI.2011.2163944 [DOI] [PMC free article] [PubMed] [Google Scholar]
- Rohlfing, T. , Kroenke, C. D. , Sullivan, E. V. , Dubach, M. F. , Bowden, D. M. , Grant, K. A. , & Pfefferbaum, A. (2012). The INIA19 template and NeuroMaps atlas for primate brain image parcellation and spatial normalization. Frontiers in Neuroinformatics, 6, 27. 10.3389/fninf.2012.00027 [DOI] [PMC free article] [PubMed] [Google Scholar]
- Rohlfing, T. , Zahr, N. M. , Sullivan, E. V. , & Pfefferbaum, A. (2010). The SRI24 multichannel atlas of normal adult human brain structure. Human Brain Mapping, 31(5), 798–819. [DOI] [PMC free article] [PubMed] [Google Scholar]
- Salmond, C. H. , Ashburner, J. , Vargha‐Khadem, F. , Connelly, A. , Gadian, D. G. , & Friston, K. J. (2002). The precision of anatomical normalization in the medial temporal lobe using spatial basis functions. NeuroImage, 17(1), 507–512. 10.1006/nimg.2002.1191 [DOI] [PubMed] [Google Scholar]
- Schwarz, C. G. , Gunter, J. L. , Ward, C. P. , Vemuri, P. , Senjem, M. L. , Wiste, H. J. , … Jack, C. R. (2017). The Mayo Clinic adult life span template: Better quantification across the life span. Alzheimer's & Dementia, 13(7), P93–P94. 10.1016/j.jalz.2017.06.2396 [DOI] [Google Scholar]
- Shattuck, D. W. , Mirza, M. , Adisetiyo, V. , Hojatkashani, C. , Salamon, G. , Narr, K. L. , … Toga, A. W. (2008). Construction of a 3D probabilistic atlas of human cortical structures. NeuroImage, 39(3), 1064–1080. 10.1016/j.neuroimage.2007.09.031 [DOI] [PMC free article] [PubMed] [Google Scholar]
- Shi, Y. , Roger, G. , Vachet, C. , Budin, F. , Maltbie, E. , Verde, A. , … Styner, M. (2013). Software‐based diffusion MR human brain phantom for evaluating fiber‐tracking algorithms. In Ourselin S. & Haynor D. R. (Eds.), Proceedings of SPIE—The International Society for Optical Engineering (Vol. 8669, 86692A). Washington, D.C.: SPIE. 10.1117/12.2006113 [DOI] [PMC free article] [PubMed] [Google Scholar]
- Sowell, E. R. , Peterson, B. S. , Thompson, P. M. , Welcome, S. E. , Henkenius, A. L. , & Toga, A. W. (2003). Mapping cortical change across the human life span. Nature Neuroscience, 6(3), 309–315. [DOI] [PubMed] [Google Scholar]
- Sullivan, E. V. , Marsh, L. , Mathalon, D. H. , Lim, K. O. , & Pfefferbaum, A. (1995). Age‐related decline in MRI volumes of temporal lobe gray matter but not hippocampus. Neurobiology of Aging, 16(4), 591–606. [DOI] [PubMed] [Google Scholar]
- Thompson, P. M. , Mega, M. S. , Woods, R. P. , Zoumalan, C. I. , Lindshield, C. J. , Blanton, R. E. , … Toga, A. W. (2001). Cortical change in Alzheimer's disease detected with a disease‐specific population‐based brain atlas. Cerebral Cortex, 11(1), 1–16. 10.1093/cercor/11.1.1 [DOI] [PubMed] [Google Scholar]
- Tustison, N. J. , Avants, B. B. , Cook, P. A. , Zheng, Y. , Egan, A. , Yushkevich, P. A. , & Gee, J. C. (2010). N4ITK: Improved N3 bias correction. IEEE Transactions on Medical Imaging, 29(6), 1310–1320. 10.1109/TMI.2010.2046908 [DOI] [PMC free article] [PubMed] [Google Scholar]
- Tustison, N. J. , Cook, P. A. , Klein, A. , Song, G. , Das, S. R. , Duda, J. T. , … Gee, J. C. (2014). Large‐scale evaluation of ANTs and FreeSurfer cortical thickness measurements. NeuroImage, 99, 166–179. [DOI] [PubMed] [Google Scholar]
- Van Hecke, W. , Leemans, A. , Sage, C. A. , Emsell, L. , Veraart, J. , Sijbers, J. , … Parizel, P. M. (2011). The effect of template selection on diffusion tensor voxel‐based analysis results. NeuroImage, 55(2), 566–573. [DOI] [PubMed] [Google Scholar]
- Van Leemput, K. , Maes, F. , Vandermeulen, D. , & Suetens, P. (1999). Automated model‐based tissue classification of MR images of the brain. IEEE Transactions on Medical Imaging, 18(10), 897–908. 10.1109/42.811270 [DOI] [PubMed] [Google Scholar]
- Wang, L. , Shi, F. , Lin, W. , Gilmore, J. H. , & Shen, D. (2011). Automatic segmentation of neonatal images using convex optimization and coupled level sets. NeuroImage, 58(3), 805–817. 10.1016/J.NEUROIMAGE.2011.06.064 [DOI] [PMC free article] [PubMed] [Google Scholar]
- Wang, Z. , Bovik, A. C. , Rahim Sheikh, H. , & Simoncelli, E. P. (2004). Image quality assessment: From error visibility to structural similarity. IEEE Transactions on Image Processing, 13(4), 600–612. 10.1109/TIP.2003.819861 [DOI] [PubMed] [Google Scholar]
- Wee, C.‐Y. , Yap, P.‐T. , Zhang, D. , Wang, L. , & Shen, D. (2014). Group‐constrained sparse fMRI connectivity modeling for mild cognitive impairment identification. Brain Structure and Function, 219(2), 641–656. 10.1007/s00429-013-0524-8 [DOI] [PMC free article] [PubMed] [Google Scholar]
- Whitwell, J. L. (2009). Voxel‐based morphometry: An automated technique for assessing structural changes in the brain. Journal of Neuroscience, 29(31), 9661–9664. [DOI] [PMC free article] [PubMed] [Google Scholar]
- Whitwell, J. L. , Dickson, D. W. , Murray, M. E. , Weigand, S. D. , Tosakulwong, N. , Senjem, M. L. , … Petersen, R. C. (2012). Neuroimaging correlates of pathologically defined subtypes of Alzheimer's disease: A case‐control study. The Lancet Neurology, 11(10), 868–877. [DOI] [PMC free article] [PubMed] [Google Scholar]
- Wicks, P. , Vaughan, T. E. , Massagli, M. P. , & Heywood, J. (2011). Accelerated clinical discovery using self‐reported patient data collected online and a patient‐matching algorithm. Nature Biotechnology, 29(5), 411–414. 10.1038/nbt.1837 [DOI] [PubMed] [Google Scholar]
- Yanovsky, I. , Leow, A. D. , Lee, S. , Osher, S. J. , & Thompson, P. M. (2009). Comparing registration methods for mapping brain change using tensor‐based morphometry. Medical Image Analysis, 13(5), 679–700. 10.1016/j.media.2009.06.002 [DOI] [PMC free article] [PubMed] [Google Scholar]
- Yoon, U. , Fonov, V. S. , Perusse, D. , Evans, A. C. , & B. D. C Group . (2009). The effect of template choice on morphometric analysis of pediatric brain data. NeuroImage, 45(3), 769–777. [DOI] [PubMed] [Google Scholar]
- Zhang, S. , & Arfanakis, K. (2018). Evaluation of standardized and study‐specific diffusion tensor imaging templates of the adult human brain: Template characteristics, spatial normalization accuracy, and detection of small inter‐group FA differences. NeuroImage, 172, 40–50. [DOI] [PMC free article] [PubMed] [Google Scholar]
- Zhang, S. , Peng, H. , Dawe, R. J. , & Arfanakis, K. (2011). Enhanced ICBM diffusion tensor template of the human brain. NeuroImage, 54(2), 974–984. 10.1016/j.neuroimage.2010.09.008 [DOI] [PMC free article] [PubMed] [Google Scholar]
- Zhang, Y. , Zhang, J. , Oishi, K. , Faria, A. V. , Jiang, H. , Li, X. , … Evans, A. (2010). Atlas‐guided tract reconstruction for automated and comprehensive examination of the white matter anatomy. NeuroImage, 52(4), 1289–1301. [DOI] [PMC free article] [PubMed] [Google Scholar]
- Zhang, Y. , Shi, F. , Wu, G. , Wang, L. , Yap, P. T. , & Shen, D. (2016). Consistent spatial‐temporal longitudinal atlas construction for developing infant brains. IEEE Transactions on Medical Imaging, 35(12), 2568–2577. 10.1109/TMI.2016.2587628 [DOI] [PMC free article] [PubMed] [Google Scholar]
- Zhou, M.‐X. , Yan, X. , Xie, H.‐B. , Zheng, H. , Xu, D. , & Yang, G. (2015). Evaluation of non‐local means based denoising filters for diffusion kurtosis imaging using a new phantom. PLoS One, 10(2), e0116986. 10.1371/journal.pone.0116986 [DOI] [PMC free article] [PubMed] [Google Scholar]
- Zhu, Z. , Fan, Y. , Feng, G. , Huang, R. , & Wang, S. (2013). Large scale brain functional networks support sentence comprehension: Evidence from both explicit and implicit language tasks. PLoS One, 8(11), e80214. 10.1371/journal.pone.0080214 [DOI] [PMC free article] [PubMed] [Google Scholar]
Associated Data
This section collects any data citations, data availability statements, or supplementary materials included in this article.
Supplementary Materials
Appendix S1: Supplementary Information
Data Availability Statement
The data of Dataset 1 can be accessed by submitting a request to www.radc.rush.edu.


