Abstract
SUMMARY: Novel developments in MR angiography are reviewed that enable non-invasive clinical imaging of normal and abnormal vessels of the spinal cord. Current fast contrast-enhanced MR techniques are able 1) to visualize vessels supplying or draining the spinal cord and 2) to differentiate spinal cord arteries from veins. The localization of the Adamkiewicz artery, the largest artery supplying the thoracolumbar spinal cord, has become possible in a reproducible and reliable manner. Knowledge of the anatomic location of this artery and its arterial supplier may be of benefit in the work-up for aortic aneurysm surgery to reduce incidences of ischemic injury. Spinal cord MR angiography is ready to become a diagnostic tool that can compete with catheter angiography for detecting and localizing arterial feeders of vascular lesions and is strongly advised for use prior to invasive catheter angiography. Successful clinical application strongly relies on in depth knowledge of the complex spinal cord vasculature and skills in image postprocessing.
Due to their small calibers, clinical imaging of spinal cord arteries and veins was until recently only possible using catheter angiography. MR imaging by virtue of its strong soft tissue contrast is widely applied in patients suspected of harboring spinal vascular abnormalities. Using MR imaging in these patients, the diagnosis was predominantly based on changes of the cord tissue appearance but not on direct visualization of abnormal vessels.1 Even today it is beyond doubt that catheter angiography is the ultimate imaging technique for diagnosing, localizing, and classifying spinal vascular lesions.2 Despite its superior spatial resolution and image quality, it has, however, several major drawbacks, because it is invasive, involves exposure to ionizing radiation, and has a small risk for major complications.3, 4 Furthermore, it is time consuming, may require a number of diagnostic sessions, and can only be performed by experts. Moreover, catheter angiography can be difficult to perform in patients with aortic diseases, such as aortic aneurysms.4, 5 For these reasons, new developments in spinal cord angiography were prompted.
It was mainly from clinical research in aortic aneurysm surgery that the request came to develop noninvasive visualization of normal arteries supplying the spinal cord to avoid the risk of paraplegia induced by interruption or damaging of the spinal cord blood supply. Catheter angiography is regarded as especially unattractive, because it is relatively hazardous in these patients due to the potential dislocation of aortic thrombi and because its sensitivity in detection of the main arterial supplier of the thoracolumbar spinal cord, that is, the Adamkiewicz artery (AKA), is too variable and too low (43%–86%4–6). Traditional MR angiographic techniques before 2000 were not able to depict normal intradural arteries and were restricted to the visualization of pathologically dilated arteries and veins.7 Recent advances in MR and CT angiography were first demonstrated at Japanese research sites.8, 9 From that point, techniques have strongly improved vessel-to-background contrast by using fast acquisition in combination with contrast agent bolus injection and are now able to depict and differentiate normal spinal cord arteries and veins.
In the current review article, the relevant vascular radiologic anatomy of the spinal cord is first outlined briefly. Subsequently, techniques of fast contrast-enhanced MR angiography to image normal spinal arteries and veins will be described and compared with traditional MR angiography techniques and catheter angiography. The key development here is the chance to differentiate spinal cord arteries from veins. Then we show how fast MR angiography is able to visualize vascular abnormalities of the spinal cord and should affect patient management. Also MR angiography is compared with CT angiography from an applicatory point of view. Finally, an outlook is provided on possible future developments and potential pitfalls in spinal cord MR angiography.
Vascular Anatomy
To correctly interpret radiologic images of the spinal cord vasculature, it is indispensable to possess adequate knowledge of the vascular anatomy of supplying arteries and draining veins. For a detailed description on the complex spinal vascular anatomy and its normal variations, we refer to excellent textbooks on this topic.10, 11 In this article, the focus is on the configuration of the supplying arteries and draining veins of the thoracolumbar spinal cord, because this is of relevance in radiologic imaging and affects most current clinical applications. Figure 1 illustrates these features of the normal vascular anatomy of the thoracolumbar spinal cord.
Fig 1.
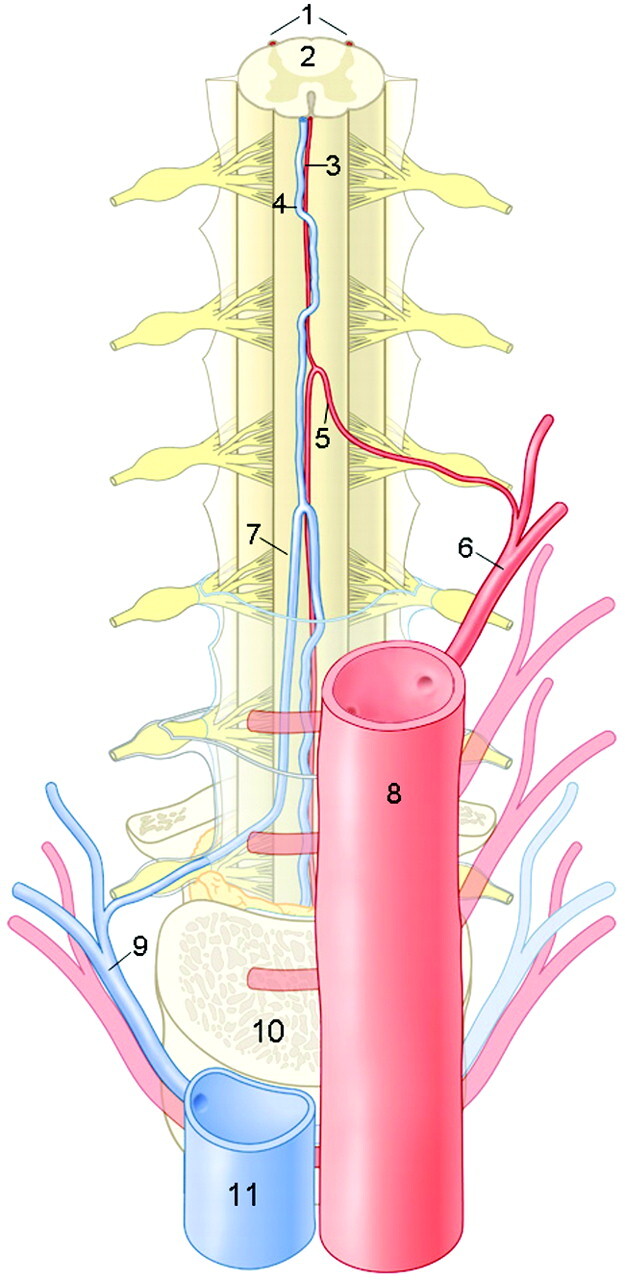
Anatomic drawing of a coronal view on the arteries and veins of the thoracolumbar spinal cord. The largest and, therefore, considered as the most important supplier of the thoracolumbar spinal cord is the Adamkiewicz artery (AKA). This inlet artery, or great anterior radiculomedullary artery, originates from a posterior branch of a segmental artery and courses through a typical hairpin turn to the ASA. The anterior median vein drains the blood from the spinal cord to the radiculomedullary veins. The largest of the outlet veins is the great anterior radiculomedullary vein (GARV), which connects to a segmental vein that eventually merges with the vena cava. Note the anatomic similarities in the configuration between the AKA and the GARV, which both exhibit a hairpin-like (intradural) course. However, the AKA is normally thinner, has a shorter intradural span, and is located more cranially than the GARV. 1 indicates posterior spinal arteries; 2, spinal cord; 3, ASA; 4, anterior median vein; 5, AKA; 6, segmental artery; 7, GARV; 8, aorta; 9, segmental vein; 10, vertebral body; and 11, vena cava. (Illustration made by Rogier Trompert.)
Spinal Cord Arteries
The anterior spinal artery (ASA; diameter, 0.2–0.8 mm10) runs along the entire length of the anterior surface of the spinal cord and distributes blood to the anterior two thirds of the cord tissue by central and pial branches. Numerous anterior radiculomedullary arteries (ARAs) supply the cord throughout its length by anastomoses, branching upward and downward. Due to the opposing blood flow directions, watershed regions may manifest, that is, regions between 2 entering ARAs where there will be very little or even no flow in either direction.12 The downward branch of the anastomosis of the ASA and the entering ARA can typically be recognized as a hairpin-shaped configuration. The caliber of the ASA is variable along its entire trajectory, is relatively narrow in the thoracic region, and is widest inferior to the anastomosis in the thoracolumbar region.
The largest intradural blood supplier to the anterior part of the thoracolumbar spinal cord is called the Adamkiewicz artery (AKA; diameter, 0.5–1.0 mm10), named after its discoverer.13 The AKA is the largest of multiple supplying ARAs. Each ARA derives from a posterior branch of a segmental (ie, intercostal or lumbar) artery, which is a direct branch of the aorta, and the ARA intradurally continues as the ASA. In approximately 70% of cases, the AKA originates from an intercostal or lumbar artery on the left side of the vertebral column and most frequently between the vertebral levels T8 to L1.14
The posterior spinal arteries are usually paired, course on the posterolateral surface of the spinal cord along its entire length, and may occasionally be discontinuous. Posterior spinal arteries and the corresponding posterior radiculomedullary supply typically are less than 0.5 mm in diameter and, at present, can only occasionally be depicted in vivo by catheter angiography.
Spinal Cord Veins
The vein running along the midline of the anterior spinal cord surface is called the anterior median vein (AMV; diameter, 0.4–1.5 mm10) and typically has a larger caliber than the adjacent ASA. Similar to the ARA, numerous anterior radiculomedullary veins drain the cord. The great anterior radiculomedullary vein (GARV), which is the largest vein draining the anterior thoracolumbar spinal cord, is easily mistaken for the AKA due to its comparable spatial course and location. The posterior median vein can be easily recognized on radiologic images due to its irregular tortuous course and large caliber (≤2 mm) and because there are no posterior midline arteries.
Angiography of Normal Spinal Cord Vessels
Relevance
The clinical relevance of localizing normal spinal cord arteries and veins is at least twofold, as described below.
First, in particular surgical applications, of which aortic aneurysm surgery is presently the most relevant, it has become increasingly clear that preservation of the AKA is of relevance to avoid spinal cord ischemia.15–17 Here, noninvasive localization of the AKA is expected to contribute to the reduction of paraplegia incidences. Although catheter angiography carries only a small risk of severe complications (1.2%4), this is significant compared with the currently achievable rates of paraplegia in aortic aneurysm surgery (3–5%18).
Second, in patients with spinal vascular malformations, identification of normal arteries and veins could add confidence to what is classified as abnormal vasculature in the spinal cord.19 In addition, identification of the normal AKA should avoid disastrous embolization of this vessel during endovascular treatment of vascular malformations.
Design
To develop novel imaging techniques that are able to visualize the most relevant spinal cord arteries and veins, there are at least 3 requirements to meet regarding spatial coverage, spatial resolution, and temporal resolution. Improving one of these items generally degrades one or both of the other requirements.
First, because the AKA may originate from any segmental artery of the thoracolumbar spine and its location varies strongly between individual patients, a large craniocaudal FOV is required (≤50 cm), which a priori counteracts spatial focusing (ie, achieving high spatial resolution). Moreover, as will be discussed later on, the segmental supply to the AKA may derive from collateral connections remote from the vertebral level where the AKA enters the spinal canal.
Second, because spinal cord arteries and veins have submillimeter to millimeter calibers, a high spatial resolution is required for visualization. In addition, the ASA and AMV run spatially close together, and due to their small calibers, may only partly fill in voxels (ie, partial volume thickening), which may provide overestimation when measuring vessel diameters.
Third, because the spatial courses of intradural arteries and veins are quite similar, the GARV, being larger, is more easily visualized than the AKA. This could lead to misinterpretations. Differentiation between arteries and veins is highly uncertain when relying solely on morphology. Reliable differentiation between the AKA and GARV can only be based on temporal differences in the arrival and transit time of a contrast bolus, which requires temporal resolutions in the order of the arteriovenous (AV) transit time of blood in the spinal cord.20 The AV circulation time has been determined, by timing the appearance of the spinal vein with serial catheter angiography, in healthy subjects and is 9–10 seconds in the cervical cord and approximately 12 seconds in the lumbar cord.21 However, multiple factors may affect the circulation time, including the hemodynamic situation of the patient (eg, circulatory slowing due to dural arteriovenous fistulas22) and the influence of anesthesia.
MR Angiography
Methods.
Previous approaches with MR angiography techniques, including contrast-enhanced time-of-flight (TOF) and phase-contrast angiography (PCA), offered sufficient spatial resolution but were not able to depict the normal arteries of the spinal cord.7 The vessel-to-background contrast for both TOF and PCA strongly depends on vessels possessing high blood flow. However, flow in normal intradural vessels is too low to provide sufficient signal intensity changes. Moreover, vascular contrast for TOF techniques was weak due to poor suppression of background tissue signal and was mainly achieved by the T1 shortening of the contrast agent instead of actual flow-related contrast. With contrast-enhanced TOF MR angiography, only normal (large) veins in the spinal cord were depicted to some extent.20 For PCA, no reports on the feasibility of depicting normal vessels were published.
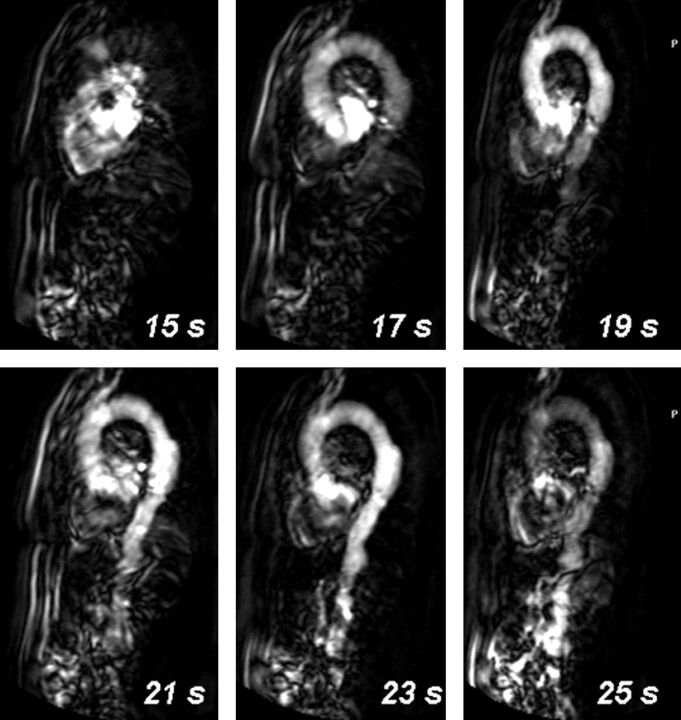
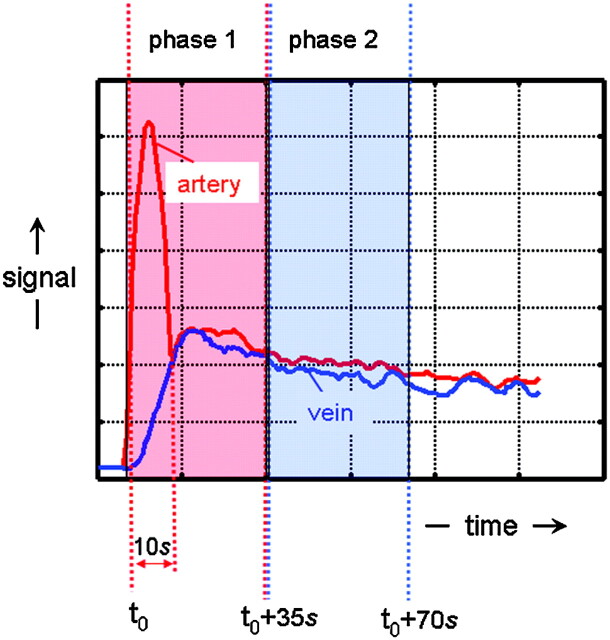
Currently, 2 contrast-enhanced 3D MR angiographic approaches appear successful for the localization of the AKA at 1.5T field strength. The difference between these 2 approaches is that one technique uses a strong (ie, temporarily high concentration) bolus, of which mainly the first passage is exploited for imaging during a period of 20–40 seconds.8 In the second approach, a long and slow contrast injection is used with long acquisition times of 4–6 minutes.23 The main advantage of the strong bolus technique is that it may provide separation of intradural arteries and veins, whereas the slow bolus technique does not allow for this differentiation. Both techniques rely on intravenous contrast administration and spoiled gradient-echo pulse sequences with ultra-short TE and TR. The shortest possible TE (2–8 ms) is required for the most effective signal intensity enhancement by T1 shortening of the blood at high concentrations (10–20 mmol/L) of a gadolinium-based contrast agent contemporarily minimizing T2* signal intensity degrading effects. A short TR (<10 ms) allows strong suppression of nonenhanced background tissue signal intensity (including spine, CSF, and cord tissue with relatively long T1 relaxation times compared with contrast-enhanced blood) to provide better contrast for the vessels of interest. The technique mostly applied relies on the high contrast that temporarily exists during the passage of a strong contrast bolus between arteries on the one hand and veins and background tissue on the other hand. Table 1 lists the MR angiography protocol advised by Nijenhuis et al.24 Acquisition times for a 3D image dataset are usually less than 40 seconds, which is approximately 4 times longer than the expected spinal cord AV transit time. However, by accurate timing of the arrival of the contrast bolus in the aorta (Fig 2) and by synchronizing the acquisition of centric k-space sampling, it is possible to optimally exploit the period of approximately 10 seconds during which a strong signal intensity difference exists between arteries and veins (Fig 3). In this way, a first-phase 3D angiogram can be obtained in which arteries appear brighter than veins. Dynamically acquiring a second-phase 3D image will additionally provide a second-phase 3D angiogram in which arteries and veins appear more or less equally enhanced. Differentiation between inlet artery and outlet vein is then possible by noting relative signal intensity changes: the artery should be brightest in the first phase, and its intensity should decrease in the second phase; the intensity of the vein should increase from the first to the second phase. Second-phase images may also serve to identify the vertebral levels, which display delayed enhancement of the vertebral bodies, to support the identification of the vertebral levels of the inlet arteries and outlet veins. It should be noted that, due to the use of a centric k-sampling technique of a bolus-shaped signal time-course, the contrast between arteries and veins increases with vessel caliber25 and is, therefore, better for larger (typically extradural) than for smaller (intradural) vessels (Fig 4). Some authors prefer to acquire more than 2 phases and use acquisition times of less than 25 seconds per dynamic phase. This allows the start of the dynamic acquisition together with the injection of the contrast bolus and, thus, no longer requires accurate timing.15, 26
Table 1:
Spinal Cord MR Angiography Protocol
| Variable | Data |
|---|---|
| Field strength | 1.5T |
| Coil | Synergy spine phased array coil |
| Pulse sequence | 3D fast-gradient recalled echo, with centric k-space filling |
| TR/TE/FA | 6.0 ms/1.7 ms/30° |
| Directions | Frequency-encoding CC; phase-encoding AP; sagittal slices |
| FOV/RFOV | ≤50 cm CC/40%–70% reduction AP |
| Acquisition time | 35-52 seconds per dynamic phase |
| Contrast administration | 0.2–0.3 mmol Gd-DTPA/kg body weight, injected at 3 mL/s |
| Voxel size | ∼0.8 × 0.8 × 1.2 mm |
| Precontrast | Similar acquisition for subtraction |
| Dynamic phases | ≥2 |
| Scan delay | Scan delay time of acquisition is set to filling of abdominal aorta, determined by MR fluoroscopy with 2-mL test bolus |
Note:—FA indicates flip angle; RFOV, reduced FOV; CC, craniocaudal; AP, anterior-posterior; Gd-DTPA, gadolinium-diethylene-triaminepentaacetic acid.
Fig 2.
Timing of contrast agent arrival with MR fluoroscopy. By injecting a 2-mL test bolus of gadolinium-based contrast agent and dynamically acquiring every second a single 80-mm-thick sagittal section positioned through the aorta, the arrival of the contrast bolus in the abdominal aorta is 23 seconds after injection for this patient.
Fig 3.
Schematic representation of the temporal signal intensity changes of arteries and veins due to the bolus injection of an MR contrast agent and the sampling of k-space data. Due to the bolus injection of the contrast agent, a temporarily (∼10-seconds) distinct difference exists in signal intensity between arteries (red) and veins (blue). By accurately timing the start of a first-phase scan, the temporarily existing contrast between arteries and veins can be exploited by first sampling the center of k-space followed by the periphery. Because the contrast of an MR image is highly determined by the central k-space values, arteries will appear brighter than veins on the first-phase images. At the time the consecutive second-phase data are acquired, the signal intensity differences between arteries and veins have vanished in all parts of the k-space, which will provide images wherein arteries and veins appear equally bright.
Fig 4.
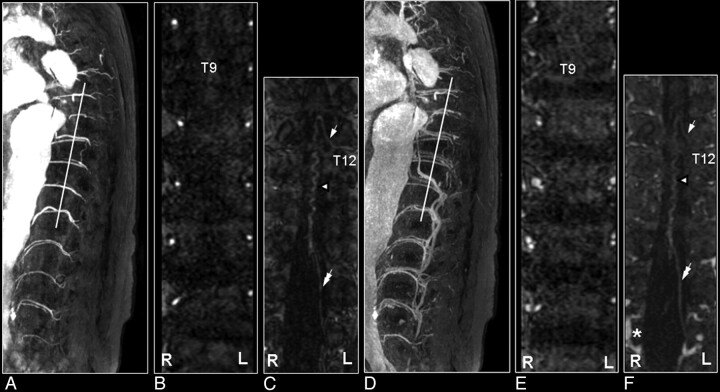
First and second dynamic-phase MR angiography images in a 56-year-old male patient with a thoracolumbar aortic aneurysm to demonstrate the differentiation of the spinal cord inlet artery from the outlet vein. On the sagittal section of the first dynamic phase, the dilated aorta and its branching segmental arteries are selectively visualized with high intensities (A), whereas on the second-phase image their appearances are less bright, and segmental veins are visualized as well (D). Oblique coronal multiplanar reformation images (white lines) show at each vertebral level 1 segmental artery on each side of the vertebral column, except for the occluded right segmental artery at T9, on the first-phase image (B) and a combination of arteries and veins on the second-phase image (E). The reformation first-phase image targeted to the spinal canal depicts the inlet artery, that is, the AKA (arrow in C). On the reformation image of the second phase, the AKA displays decreased intensity relative to the first-phase image, whereas the draining vein (double arrow) is visualized more caudally (F), and the epidural venous plexus has become enhanced (*). Note that the midline vasculature most likely represents a combination of the ASA and anterior median vein, which remain spatially unresolved (arrowhead in C and F).
Recently, Jaspers et al25 used a keyhole imaging technique to achieve scan times of 6.5–8.0 seconds per dynamic phase, below the expected AV circulation time in the spinal cord, and realized dynamic images ranging from exclusively depicting arterial to mixed arterial-venous to exclusively venous enhancement of the spinal cord vessels. In keyhole imaging, only the center (55%) of k-space is updated during dynamic scanning, and the k-space periphery is completed with precontrast data. The compromise, however, was that imaging was restricted to the spinal canal and that the trajectories of segmental arteries supplying the AKA were only incompletely visualized.
Results.
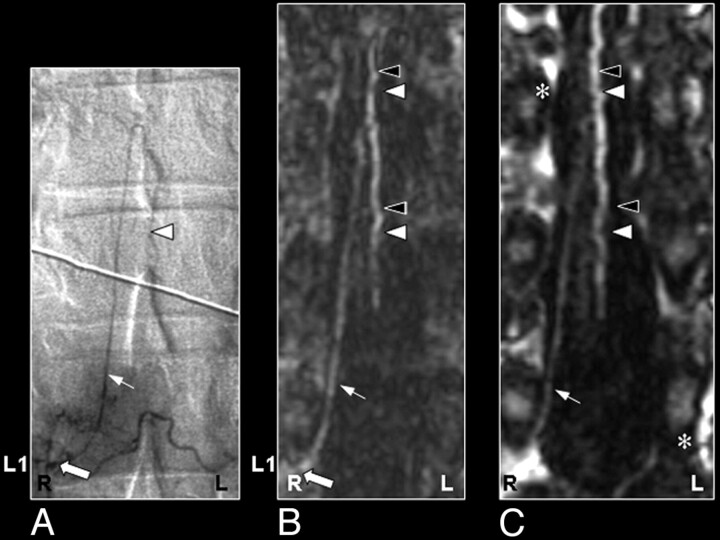
Current contrast-enhanced MR angiography techniques claim success rates for the detection of the AKA ranging from 69% to 100%.8, 24, 26 Important factors that determine the consistent detection of the AKA are, in our opinion, a sufficiently large craniocaudal FOV (≤50 cm, including vertebral levels T8 to L5), the administration of at least 0.2 mmol of gadolinium per kilogram of body weight, and, most importantly, accurate timing of the contrast arrival and start of the center of k-space acquisition and also skills in image postprocessing. One might argue that when a detection rate of 100% is achieved, it might well be that outlet veins might be interpreted as inlet arteries. However, AKA detection with the 2-phase approach has been well validated with catheter angiography27 in patients suspected of harboring spinal cord vascular pathology (eg, Fig 5). Moreover, the technique to localize the AKA appears to be reproducible, which is important for routine clinical assessment.28
Fig 5.
Coronal catheter angiographic projection (A) and multiplanar reformatted MR angiogram of the early phase (B) and late phase (C) in a 55-year-old male patient with a SDAVF. On the catheter angiogram (A) the supplying segmental artery (large arrow), the AKA (white arrow) and the ASA (white arrowhead) are depicted. The MR angiogram of the early phase (B) shows the supplying segmental artery (large white arrow) and the AKA (white arrow). Regarding the anterior midline enhancement in the first phase (B) above and below the connection of the AKA with the ASA (white arrowheads), this is most probable enhancement of the spatially unresolved combination of the ASA and the AMV (black arrowheads). The second-phase MR angiogram (C) shows diminished signal intensity of the AKA (white arrow), in contrast with the anterior midline enhancement, which is clearly increased compared with the first phase (B) due to increased venous enhancement. The midline enhancement seen in the second phase (C) is most likely a combination of AMV (black arrowheads) and ASA (white arrowheads) enhancement. Note that there is enhancement of the venous plexus (*) in the late phase (C), which is not seen on the first phase MR angiogram (B). The cephalad enhancement above the connection of the AKA with the ASA is only depicted on the MR images (B and C) and not on the catheter angiogram (A).
Sheehy et al29 showed recently that MR angiography of the cervical spinal cord is also feasible. They reported that the ASA was identified in 48 (96%) of 50 patients and that the continuity to the supplying vertebrobasilar arteries was identified in 70% of the patients. Radiculomedullary suppliers were identified in 48% of the patients. However, differentiation between artery and vein (eg, ASA and AMV) was not proven. Identification of arterial structures was based on the observation of continuity to known arterial structures.
Clinical Applications.
Preoperative identification of the AKA was applied by Nijenhuis et al30 to 8 patients with thoracic herniated disks. MR angiographic localization of the AKA was claimed to be successful in all of the patients, including 3 patients in whom the segmental artery supplying the AKA was observed on the left side of the spine. The clinical relevance of the AKA localization was demonstrated in these 3 patients, in whom the surgical approach using video-assisted thoracoscopic surgery for disk herniation was changed to the right side to avoid complications due to interruptions of the spinal cord blood supply through the AKA.
The most promising application of preoperative localization of the AKA seems to be in the field of aorta aneurysm surgery. Kawaharada et al17 were the first who related the clinical outcome in terms of paraplegia incidence to preoperative AKA localization. In this study of 86 patients, during surgery, only the segmental artery that supplied the AKA was reconstructed when it existed in the region of graft replacement. Paraplegia developed in 2 of 16 patients, in all of whom the AKA was not detected. In the remaining 70 patients, the AKA was identified, and no complications of paraplegia occurred. Taken together, this provided the first statistically significant result demonstrating the usefulness of preoperative AKA localization. The importance of preoperative localization of the AKA and its supplying segmental artery was, however, not generally appreciated. One reason for this is that the AKA could not be identified in many aortic aneurysm patients by using catheter angiography.4, 5 In our opinion, lack of sensitivity of catheter angiography is because many segmental arteries are occluded in thoracoabdominal aortic aneurysm patients by atherosclerosis. Therefore, opacification of the AKA then relies on the selective injection of small amounts of contrast agent in segmental arteries remote to the AKA, and may be too weak to be detected.
Nijenhuis et al24 demonstrated recently that the AKA is indeed functional in thoracoabdominal aortic aneurysm patients. They correlated in 60 patients the locations of the aortic cross-clamp positions relative to the MR angiographic location of the AKA with the results of intraoperatively determined electrophysiologic cord function measured in terms of motor-evoked potentials (MEPs).18 MEP declines occurred only in those 14 patients in whom the AKA was indeed cross-clamped (ie, 100% negative predictive value). A statistically significant (P < .001) association was found between the intraoperative spinal cord function and the location of the segmental supply to the AKA relative to the aortic cross-clamp positions. Knowledge of the location of the segmental supply to the AKA may also be relevant during the surgical procedure, especially when situations are encountered in which a segment of the aorta is opened and multiple segmental arteries are back bleeding and the MEPs decline. Considering the limited time the cord can sustain hypoperfusion, the surgeon should first start to revascularize those arteries that connect to the AKA to minimize the risk of ischemic injury.
Image Postprocessing and Interpretation
The keys to the identification of the AKA are skills in and devotion to image processing of the 3D angiographic datasets. Spinal cord arteries and veins are small structures displaying low-to-modest contrast relative to the surrounding tissue. In general, multiplanar reformatting (MPR) or curved MPR (CMPR) is combined with subsequent maximum intensity projection (MIP) to display the spinal arteries and veins as conspicuously as possible.
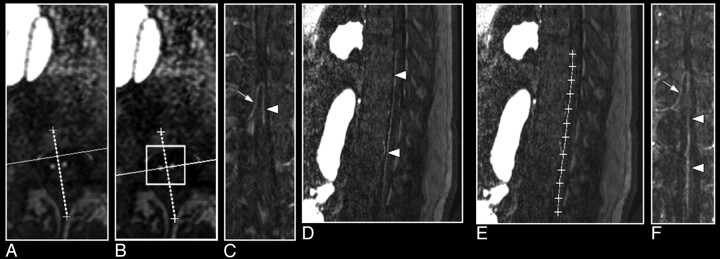
One way to realize adequate visualization of the inlet arteries and outlet veins is to step through a stack of axial sections, preferably in the vertebral range from T5 to L5, and to focus on the posterior border of the vertebral bodies (ie, the anterior border of the cord). When the axial cross-sections of, for example, the ASA and AKA are encountered in the same axial section, one can construct an MPR along the intersection of these 2 vessel points to display the continuation of the AKA into the ASA (Fig 6A–C). However, the spatial course of AKA and ASA may not necessarily be in the same flat plane. This inherently curved course may severely limit the spatial extent to fully visualize both vessels and also the connection to the segmental supplier. By creating CMPR images, which is most effectively done from sagittal MPR sections (Fig 6D–F), the spatial extent of the visualization of the course of these vessels is generally improved.
Fig 6.
Multiplanar reformation of a 3D MR angiography image set of the spinal cord demonstrating the visualization of the AKA (arrow) and the ASA (arrowhead; A–C). A, Two bright dots on the axial section represent the cross-sections through the AKA and the ASA. B, The line between these 2 dots is the new orientation of the multiplanar reformation. C, The oblique coronal reformation section shows the spinal cord vessels along the anterior surface of the cord. D–F, Curved multiplanar reformation of the same 3D image set shows a caudally more extended part of the ASA. On the sagittal section, the course of the ASA can be identified on the anterior surface of the cord (A) and then followed to define the curved multiplanar reformation (B). The resulting slightly curved plane represents an image that displays the AKA and a larger part of the ASA (F) compared with C.
The straightforward use of the MIP technique is hindered by the fact that structures surrounding the cord may appear much brighter enhanced than the spinal cord vessels of interest. Effective use of the MIP technique, therefore, crucially relies on targeting the MIP operation to carefully selected subvolumes of the angiographic datasets. Hyodoh et al26 recently introduced a novel and time-efficient imaging technique that avoided this subvolume targeting and termed it “double-subtraction MIP.” In their approach, 5 consecutive dynamic phases, each 23–25 seconds, of oblique-coronal sections positioned along the posterior line of the vertebral body were acquired. Subsequently, anteroposterior MIPs were computed for all 5 phases, and the last 4 were subtracted from the first-phase MIP image (with no contrast enhancement). The second subtraction was then calculated by subtracting the venous-phase MIP image from the arterial-phase MIP image. The great advantage of this approach is that, by using a targeted thin slab acquisition, no additional regions of interest have to be drawn in the processing steps to target the computational MIP algorithm, which is time saving.
MR Angiography of Spinal Cord Vascular Lesions
Relevance
Vascular spinal lesions are uncommon (1%–2%) and still underdiagnosed entities among vascular neurologic pathologies. Among the vascular lesions of the spinal cord and its meninges, AV shunts, ie, spinal AV malformations (SAVMs) and spinal dural AV fistulas (SDAVFs), are the most prevalent abnormalities. If not treated properly, AV shunts can lead to considerable morbidity with progressive spinal cord symptoms and myelopathy.1, 2, 10, 11
Usually the standard MR imaging examination is sufficient to raise the suspicion of a spinal vascular malformation. However, spinal cord tumor or inflammation may easily mimic the presentation of a vascular lesion. Because the type of vascular lesion determines the treatment strategy, accurate localization and characterization of vascular lesions are of utmost importance. The only technique that is sufficiently reliable to localize and characterize vascular malformations is catheter angiography, also referred to as digital subtraction angiography.10, 11, 31 Although image quality, in terms of spatial and temporal resolution, is better for catheter angiography compared with MR or CT angiography, a number of inherent disadvantages exist. Selective catheterization of arteries feeding the spinal cord carries the risk of neurologic complications.32 The major drawback is related to the fact that the location(s) of the artery(ies) supplying the AV shunt is (are) not known before angiography, and there are no MR-based predictors (such as location and extent of the cord edema) of the level of the shunt.1 Therefore, to localize the possible feeder(s), selective catheterization of all arteries potentially supplying the spinal cord and its meninges may be required. These include vertebral, costocervical, and thyrocervical trunks and all of the intercostal lumbar and iliolumbar arteries. Consequently, lengthy and occasionally multiple catheterization sessions are required, with high radiation exposures in which large volumes of potentially nephrotoxic contrast agents are administered.33 For these reasons, recent progress in spinal cord MR and CT angiography is of interest for the detection and evaluation of spinal cord vascular pathology before the catheter angiographic examination. Advances that are reviewed here in noninvasive imaging of spinal cord vascular pathology have been restricted to SDAVF and SAVM. For the former achievements of previous MR angiography applications in other spinal cord pathologies, we refer to the review by Pattany et al.7
MR Angiography
During the last 12 years, several MR angiography techniques have been developed to image vascular pathologies of the spinal cord. Initially, blood flow-dependent techniques, such as PCA34 and 3D contrast-enhanced time-of-flight (3D CE-TOF) imaging,35 were used. These techniques could confirm the presence of abnormally dilated spinal cord arteries or abnormal intraspinal veins, respectively. Using PCA, Mascalchi et al34 localized the arterial supply in 3 of 3 patients with intramedullary SAVM but only in 2 of 6 patients with DAVF. This discrepancy is probably because the contrast for PCA is determined by the magnitude of blood velocity, which is high for intramedullary SAVM lesions and relatively low for SDAVF lesions.7 Mascalchi et al36 also published the results of follow-up MR angiography of 34 patients (30 patients with SDAVF and 4 with SAVM), including contrast-enhanced PCA after endovascular or surgical treatment, and showed a higher sensitivity for detecting residual or recurrent flow than MR imaging. Saraf-Lavi et al37 showed with 3D CE-TOF MIP images that the mean length, mean tortuosity, and mean size of spinal cord veins depicted were significantly greater in SDAVF patients compared with control subjects. Adding 3D CE-TOF MR angiography to MR imaging improved the sensitivity (≤90%) of the SDAVF diagnosis by identifying the (vertebral) entrance level of the draining medullary vein near the neural foramen as the location of the fistula. However, these techniques were not able to localize the actual site of the shunt zone where the feeding artery connects to the draining vein in SDAVF. The limited temporal resolution and long acquisition time, both causing strong venous and background tissue enhancement, obscured the visualization of small arterial structures.
To depict the relatively small arterial feeders of SDAVF, fast MR angiography was required. Binkert et al38 avoided contaminating venous and background enhancement by applying such a fast (24-second) contrast-enhanced MR angiography technique and showed in a small number of patients that the localization of the feeder in SDAVF (2 of 3 patients) and the classification of SAVM (6 of 6 patients) were feasible. In their work, the sampling of the k-space data were done in a linear way, but the timing of the acquisition of the central k-lines was matched to the arrival of the contrast agent bolus, which, in essence, is almost similar to centric k-space sampling as described above. Shortly thereafter, Shigematsu et al39 introduced fast imaging (≤16 seconds) of the arterial phase of the contrast agent bolus with precontrast image subtraction, visualized the early abnormal venous filling in all 3 patients, and located the arterial feeder of a SDAVF in 2 of 3 patients. Recently, the studies by Farb et al40 (n = 9) and Luetmer et al33 (n = 31) demonstrated that SDAVFs can be accurately localized by using an MR angiography technique in which the AV contrast was emphasized with a bolus injection of contrast agent. Unfortunately, the craniocaudal FOV was limited (28 and 36 cm, respectively), which could explain why, in the study by Farb et al,40 2 or 3 reexaminations were required in 5 patients, and in the study of Luetmer et al,33 in 6 of 31 patients the arterial feeder was not detected.
Interestingly, the study of Luetmer et al33 showed that more than a 50% reduction of fluoroscopy time (from 55 to 26 minutes) and volume of iodinated contrast agent (from 326 to 146 mL) was achieved in the catheter angiography procedures in the 13 patients with SDAVFs in whom MR angiography had prospectively indicated the correct level. This should reduce not only the amount of radiation exposure but also the risk of angiographic complications.
Although the necessity for a fast MR angiography technique was recognized, it was not yet possible to depict normal intradural arteries, which is mandatory to detect and preserve the specific blood supply to the spinal cord in case of endovascular treatment. In addition, detection of feeders of AV shunts in a single MR acquisition session was still limited by the small size of the craniocaudal FOV.40 As feeding arteries to spinal vascular shunts may arise from all of the arteries potentially supplying the spinal cord, a technique with the largest possible FOV seems therefore necessary to screen for any kind of vascular malformation. Other than detection, it is also important to characterize the subtypes of spinal AV abnormalities, because they are subject to different therapeutic approaches.1
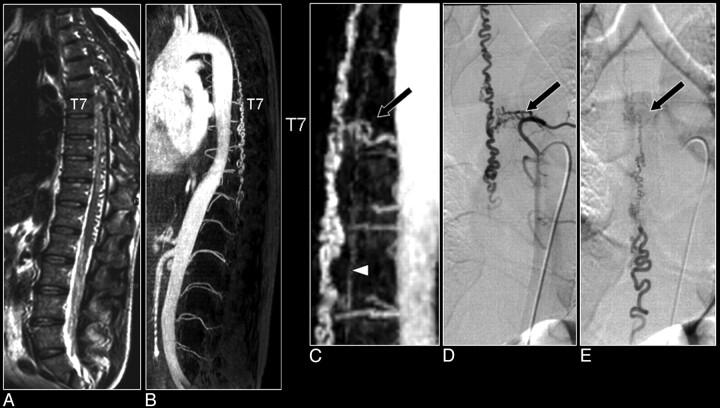
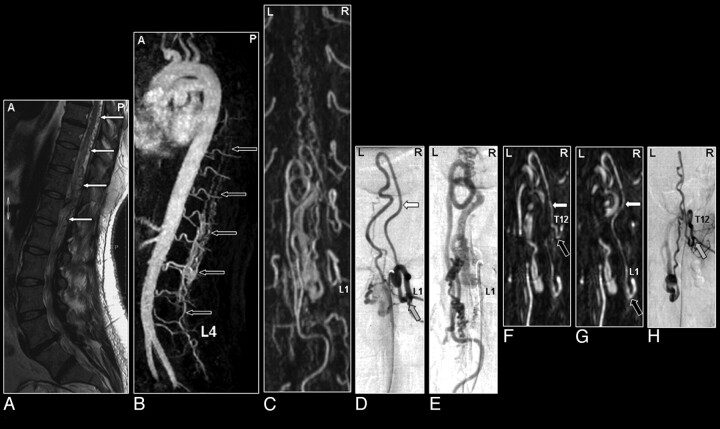
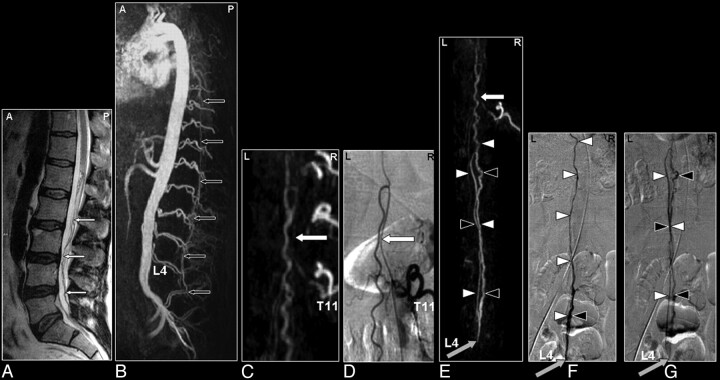
The study by Mull et al41 recently integrated many technical developments in MR angiography, including a large craniocaudal FOV, centric k-space sampling, fast-acquisition pulse sequence, 2-phase dynamic scanning (maximal 40 seconds per phase), and additional background suppression by noise-reduced subtraction of precontrast images. With this approach it was possible to depict the vascular pathology together with the most relevant normal spinal cord arteries and veins (Fig 7). In all 31 of the patients suspected of harboring spinal cord vascular abnormalities, the pathology was determined as either SDAVF (Fig 7) or SAVM (Fig 8). For all of the 19 SDAVF patients, the level (with an accuracy of ≤1 vertebral level) of the arterial feeder was localized in agreement with the validating catheter angiography examination. In intradural SAVM, the main feeding artery was identified by MR angiography in 10 of 11 patients. MR angiography could differentiate between glomerular and fistulous SAVM in 4 of 6 patients and between sacral SDAVF and filum terminale SAVM in 2 of 5 patients. Moreover, by using this technique, it was demonstrated that it was possible to visualize even small abnormal blood vessels of the lumbosacral spine in patients with SDAVF and SAVM (Fig 9) of the filum terminale. Also, the relevance of detecting the AKA in spinal AV shunts was illustrated by a case in which the radiculomeningeal artery supplying the SDAVF also gave rise to the AKA. In this case, cautious treatment was required to avoid interruption of the blood supply to the AKA, with risk of paraplegia. Detection of multiple arterial feeders in patients with extensive fistulous SAVM remained limited to the largest feeders. Small additional feeders were detected by catheter angiography but remained unnoticed with MR angiography. Although MR angiography was able to detect AV abnormalities of the sacral spine, differentiation between a sacral SDAVF or filum terminal SAVM was not possible in all patients. Likewise, subclassification of SAVM in terms of glomerular and fistulous was not successful in all of the patients and still required catheter angiography. The most important finding of this study was the observation that no false-positive and no false-negative MR angiography results were obtained regarding AV shunts of the spinal cord in a relatively large series of patients with a rare disease. Consequently, because detection or exclusion of spinal AV abnormalities by MR angiography was found to be very accurate for both SDAVF and SAVM, it may in the future be possible to avoid or at least shorten (by guiding) burdensome diagnostic catheter angiography procedures. Furthermore, MR angiography may, in the future, replace catheter angiography for follow-up diagnostic procedures after treatment (Fig 10). To our knowledge, no studies exist on fast (contrast-enhanced) MR angiography and evaluation of the postoperative state. However, because MR angiography is noninvasive and so sensitive to visualize the extent of dilated intradural veins (better than T2-weighted imaging and catheter angiography), fast MR angiography should be the first choice for follow-up. Also, early posttreatment MR angiographic examination is recommended, because it could enable prompt detection of treatment failure and serve as a reference for follow-up examinations.36
Fig 7.
Comparison of MR angiography with catheter angiography in a patient with a SDAVF. A, Sagittally oriented T2-weighted image displaying the signal intensity voids around the spinal cord, which are characteristic of the vascular pathology. B, The sagittal MIP displays the craniocaudal extent of the dilated perimedullary vein draining the fistula. C, The magnified MR angiographic image depicts the arterial feeder of the fistula (arrow) and the dilated perimedullary vein, together with the ASA (arrowhead). D, The early phase image of the catheter angiography examination verified the vertebral location of the fistula. Note that only the catheter angiography images can reveal the small network of vessels of the fistula (D) and depict the dynamic drainage pattern (E), whereas MR angiography reveals better the spatial extent of the venous drainage (B).
Fig 8.
Perimedullary SAVM in a 43-year-old female patient visualized by MR and catheter angiography: the problem of separating arteries from veins by MR angiography and of superimpositions in nonselective angiograms. A, Sagittal T2-weighted image showing increased signal intensity of the thoracolumbar cord and enlarged perimedullary and infraconal (serpentine) vessels raising the suspicion of a vascular spinal cord abnormality (small white arrows). B, Sagittal MIP of the MR angiography examination showing the overview and localization of the dilated vessels (small black arrows). C, In the coronal target MR angiography MIP, a mixture of enhanced tortuous arteries and veins is observed. D, On the catheter angiogram, the AP projection of the early phase shows filling of the largest SAVM-feeding radiculomedullary artery (white arrow), which derived from the first lumbar level (L1). In the late phase, the draining veins can clearly be distinguished from the artery (E), which was not possible with MR angiography (C). F, Due to the overprojection and the multiplanar reformation postprocessing, the origin of the large anterior radiculomedullary artery was first falsely localized at the 12th thoracic level (T12) on the MR angiogram (black arrow). G, Retrospectively, the correct level could be localized at L1 (black arrow). H, The T12 level gives rise to an additional posterior feeder of the SAVM, only localized by selective catheter angiography (gray arrow).41
Fig 9.
SAVM of the filum terminale in a 61-year-old male patient visualized by MR and catheter angiography: the problem of differentiation between this rare type of SAVM and spinal dural AV fistulas is due to difficult shunt localization and vessel identification in present MR angiography. A, Sagittal T2-weighted image showing enlarged infraconal vessels raising the suspicion of a vascular spinal cord abnormality (small white arrows); no signal intensity abnormality of the spinal cord is visible. B, Sagittal MIP of the MR angiography data showing the overview and localization of the dilated vessels (small black arrows). C, The blood vessel demonstrated on the coronal target MR angiography MIP could, retrospectively, be identified to be an enlarged AKA (white arrow) and ASA, with origin from the 11th thoracic level (T11). D, Catheter angiography for comparison. E–G, The continuation of this ASA to the filum terminale (white arrowheads) is the feeding artery for this type of AVM situated at the level of L4 in this individual case (gray arrow). Differentiation of the feeding artery that is running downward (white arrowheads) and the arterialized vein (black arrowheads) that is running upward is only possible with a good time resolution of the selective angiogram, as shown on the catheter angiography images in early (F) and late phases (G).41
Fig 10.
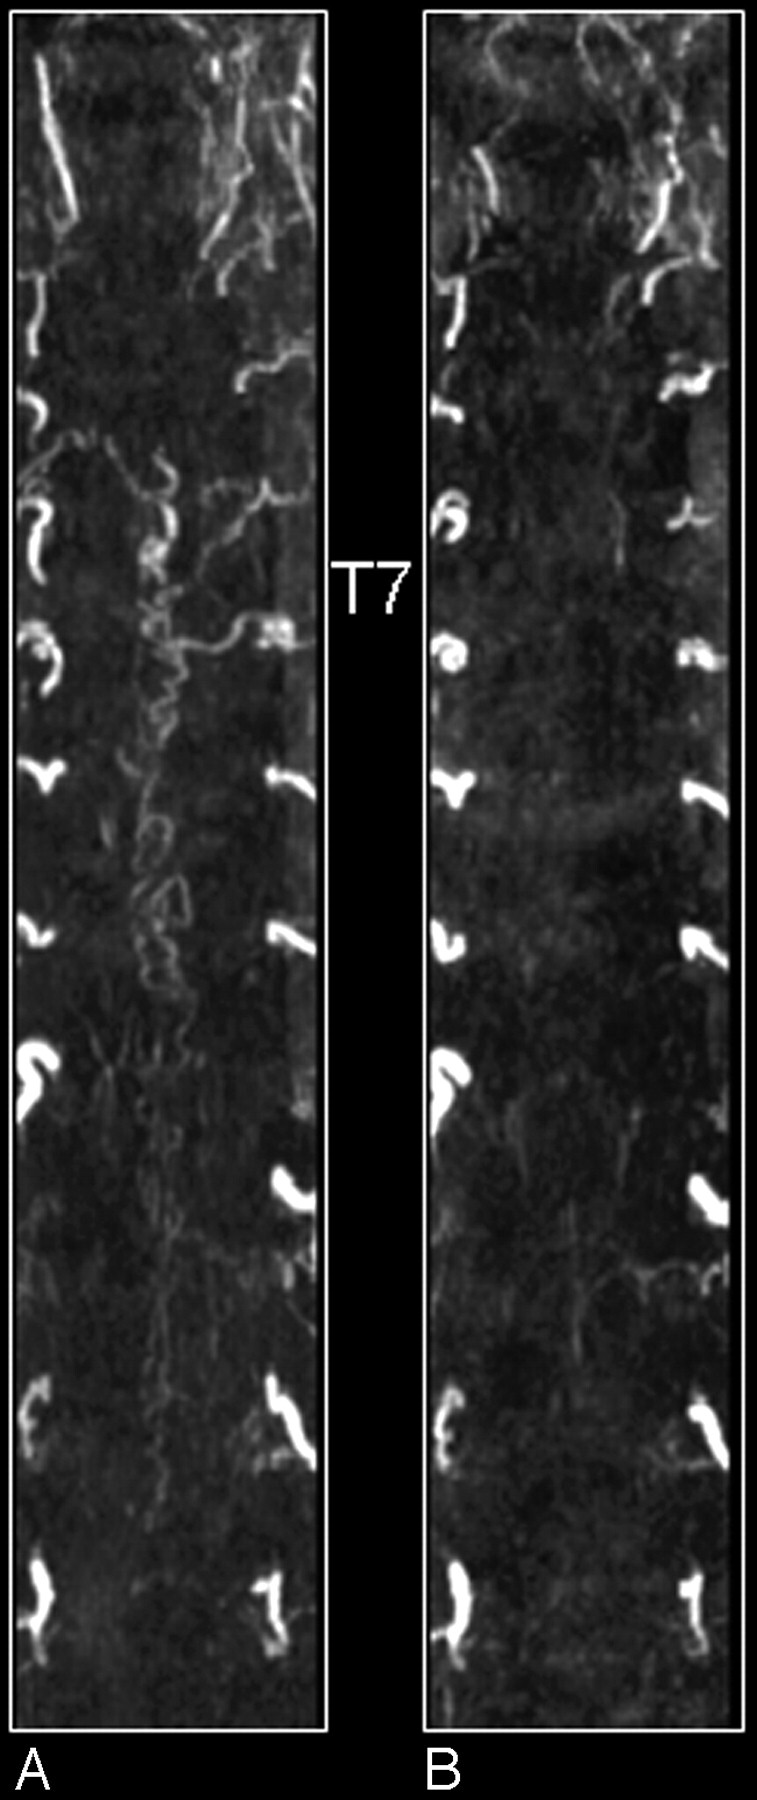
MR angiography of a patient with an SDAVF before (A) and after treatment (B). Shown are coronal maximum intensity projections. Note on the first-phase MR angiogram the dilated tortuous veins and the arterial feeder at thoracic vertebral level T7 of the fistula (A). After treatment the tortuous veins are not visible anymore (B).
MR versus CT Angiography
Table 2 lists and compares the most relevant characteristics when selecting MR or CT angiography for depicting spinal cord vessels. The detection rate for localizing the AKA in the nondiseased spinal cord should for most techniques currently attain nearly 100%,23, 24, 42–45 though a validation for CT angiography to distinguish inlet arteries from veins has not been demonstrated yet. However, this should not be a really limiting issue, because acquisition times as short as approximately 7 seconds45 in adults and 3 seconds in children44 can be achieved on modern multisection systems, which are shorter than the normal spinal cord AV circulation time. Most critical for differentiation of spinal cord arteries and veins is the timing of the start of the image acquisition relative to the contrast agent arrival. This timing is even more critical for CT than for MR angiography, because CT angiography represents a section-based acquisition and is faster per section than MR angiography, which is (3D) volume based. Herewith, it should be remarked that contrast agent arrival times are determined in the aorta (eg, at the craniocaudal region of the AKA), which may provide arrival times somewhat deviant from the actual arrival times in intradural arteries, particularly in (thoracoabdominal aortic aneurysm) patients with many occluded segmental arteries.
Table 2:
Comparison between MR and CT for spinal cord angiography application
| Item | MR Angiography | CT Angiography |
|---|---|---|
| Efficacy for AKA detection | High, ≤100 % | High, ≤100 % |
| Validation with catheter angiography | Realized in patients suspected of spinal vascular disease27 | To be demonstrated |
| Differentiation of inlet artery from outlet vein | Possible with dynamic multiphase imaging | Not demonstrated yet, may require table movement |
| Anatomy (vertebrae) | Second phase required | Adequately covisualized |
| Voxel size | In-plane, 0.8 × 0.8 mm, Section thickness, 1.2 mm | In-plane, 0.34 × 0.34 mm, Collimation width, 0.6 mm |
| Spatial coverage | Standard T5 to L5, craniocaudal FOV ≤50 cm, other directions (AP or RL) limited | Entire spine is possible |
| Scan duration (ie, temporal resolution) | Down to 8 seconds, with limited spatial coverage25 | Down to 6.5 seconds, with large spatial coverage45 |
| Patient size | Independent image quality | Contrast-to-noise of vessels decreases for corpulent patients45 |
| Safety | Very small risk of NSF due to Gd-based contrast agent; reduces fluoroscopy time and iodinated contrast volume in subsequent catheter angiography | Ionizing radiation, potentially nephrotoxic contrast agent |
| Contrast agent | 0.2–0.3 mmol Gd-chelate/kg | 40–150 mL iodine compound |
| Exam time | 30–45 minutes | 10–15 minutes |
| Logistics | Scheduling required for TAAA patients; MR imaging is already part of diagnosis in patients suspected for spinal cord vascular lesions | Already part of preclinical work-up in TAAA patients |
Note:—AKA indicates Adamkiewicz artery; T5, fifth thoracic vertebral level; L5, fifth lumbar vertebral level; AP, anteroposterior; RL, right-left; TAAA, thoracoabdominal aortic aneurysm; NSF, nephrogenic sclerotic fibrosis; Gd, gadolinium.
One important advantage of current CT systems is the higher spatial resolution compared with MR angiography. This is very beneficial for the visualization of submillimeter-to-millimeter-sized intradural vessels. Lai et al46 were the first to use a modern 16-section CT system enabling a craniocaudal coverage of approximately 55 cm and a voxel size of 0.5 × 0.5 × 0.75 mm for spinal cord CT angiography in patients suspected for SDAVF. They correctly localized in all 8 of the patients the fistula together with the feeding artery (thoracic in 7 and sacral in 1 patient) and depicted the engorged perimedullary draining veins. In addition, Lai et al47 recently showed the high image quality capabilities of a modern 16-section CT system in a single case of a SAVM with a simple perimedullary fistula, of which the results agreed with catheter angiography. In this patient, the entire vascular course of the somewhat enlarged ASA, its intercostal feeder, and the actual fistulous zone of a perimedullary fistula were nicely depicted.
MR angiography benefits from the fact that strong background suppression techniques (short TRs for CSF and cord tissue with relatively long T1 relaxation times) are available, which allow the depiction of vessels smaller than the voxel size at acquisition (caliber, >0.3 mm30). Background suppression of, for instance, the strong bone signal intensity, could also be realized within CT angiography by acquiring a precontrast scan and subsequent subtraction from the contrast-enhanced scan. However, this would further increase the radiation exposure and increase the noise level. Efficient background tissue suppression techniques within MR are most likely the reason for the better contrast-to-noise ratio obtained in patients for MR relative to CT angiography. Furthermore, CT imaging is capable of covisualizing the anatomy (ie, cord and vertebral bone) in addition to the spinal vessels, which is very helpful to indicate the location of the vascular lesion. Because MR angiography aims to suppress the surrounding tissue as much as possible, anatomic information is absent in first-phase images. However, additionally acquiring a second-phase image will display the (delayed) enhancement of the venous plexus and the vertebral bodies, which may serve to indicate the location of the lesion.
A feature for which CT imaging is superior to MR angiography is the fact that the entire spinal cord can easily be imaged. Although current MR systems allow craniocaudal (fast readout direction) FOVs up to 50 cm, fast MR angiography is seriously hampered by large FOVs in the orthogonal directions, because these represent the time-consuming phase-encoding directions. Thus, although large axial FOVs can be realized with MR angiography as well, this will proportionally increase scan time and consequently deteriorate arterial contrast. This limitation of MR angiography was nicely pointed out by Yoshioka et al,23 who showed that, for the localization of the segmental arterial supplier to the AKA, it may be important to also have a wide axial coverage to detect all of the intersegmental collateral arteries in thoracoabdominal aortic aneurysm patients. Another important advantage of CT angiography is its generally greater and, therefore, more flexible clinical availability and the 3–4 times shorter examination time.
A well-known disadvantage of CT angiography is the administration of an iodine contrast agent, which is potentially nephrotoxic. The recently observed adverse effect of certain gadolinium-related MR contrast media to nephrogenic systemic fibrosis in patients with severely impaired renal function48, 49 has subjected certain restrictions when using gadolinium-based contrast media for MR imaging.49, 50
A distinct disadvantage of CT imaging in general is the inherent exposure to ionizing radiation. Performing a CT scan of the entire spinal cord amounts to an effective dose of approximately 20 mSv, in which gonads account for approximately one fifth of the contribution.51 Limiting the craniocaudal FOV to the region where the AKA is most likely to be detected would lower the dose to approximately 15 mSv. In diagnostic radiologic imaging, especially projections, these estimated doses are exceptionally high, though this should be weighted against the medical relevance of imaging in these patients. The dose estimates should also be compared with the general x-ray catheter angiography procedures of the thorax or abdomen where one not only has to deal with effective doses (related to stochastic effects) ranging from 13 to 20 mSv but also high entrance skin doses associated with the deterministic effects (eg, erythema and epilation) that have to be avoided.52, 53 For pediatric patients, Ou et al44 showed that current CT systems can modulate the effective tube current to reduce the effective dose to the range of 4–7 mSv, which is comparable with pediatric cardiac catheterization.
Outlook
Advancing imaging software and, in particular, hardware developments will definitely further improve the possibility to noninvasively visualize spinal cord arteries and veins. The effects of future technologic developments are most likely first demonstrated in the normal spinal cord, because appropriate patients (or volunteers for MR) may be more easily available. Improvements to demonstrate progress in the imaging of spinal cord vascular pathologies are seriously hampered by the fact that such diseases are rare, and confidential inferences require multiple subjects with similar pathology, for which the inclusion period may take several years, even in specialized medical centers.
The main shortcoming of current MR approaches for spinal cord angiography is its limited spatial resolution, which does allow the depiction of the major anterior feeders of vascular lesions but generally fails to locate smaller anterior or additional posterior feeders. In theory, imaging could improve when changing to a 3T magnet, because it offers better signal intensity-to-noise characteristics that can be used to increase spatial (and/or temporal) resolution and to better depict smaller vessels. However, the main advantage of the 1.5T system is the ability to use a dedicated spine coil, which enables a sufficiently homogeneous FOV up to 50 cm but is not (yet) available for our 3T MR imaging system. The large FOV helps to localize the variable origin of the feeders of the vascular abnormalities, as well as the AKA, along the entire thoracolumbosacral spinal cord. Achieving such a large FOV is currently challenging for 3T systems. Moreover, the stronger field inhomogeneities near the vertebral bodies at 3T give rise to susceptibility artifacts that seem to counteract the increase in the signal-to-noise ratio. Another problem with spinal cord imaging is the anatomic location in the body. Because the cord lies relatively close to the dorsal surface of the human body, it is advantageous to use phased-array surface coils with multiple rather small coil elements to obtain the highest signal intensity sensitivity. To speed up imaging with parallel imaging techniques, however, requires overlap of the sensitivity maps of multiple coils. However, to obtain overlap between anteriorly and posteriorly positioned coils, rather large coil elements are needed for the thoracolumbar region, which reduce the sensitivity of the individual coil elements. Therefore, at this moment, a major technologic challenge is to be taken to improve 3T MR imaging systems for spinal cord angiography. For the thinner cervical region, the required anteroposterior overlap of coil sensitivities is more easily feasible.
A future possibility to localize additional arterial feeders of and to characterize an SAVM more accurately would be the use of a second MR angiography examination in addition to the first examination with the large FOV. In the second MR angiography examination, a smaller FOV could focus on the vascular pathology detected in the first examination and could reveal more details of the fistulous zone and/or arterial feeders. Future developments that may allow us to improve MR angiography are the use of high T1 relaxivity (eg, blood pool) contrast agents. This could enable the more detailed depiction of the shunt zone rather than merely localizing the arterial feeder. Moreover, blood pool agents could be used in a 2-step approach. During the first step, 2-phase fast MR angiography could serve to differentiate inlet arteries from outlet veins or to identify arterial feeders, whereas in a second step, a long steady-state angiography acquisition could be performed providing high spatial resolution images with both arterial and venous structures visualized. The use of a blood pool agent, which remains in the (systemic) circulation for a longer time, could improve the visualization of the small spinal cord vasculature when using long acquisition times in additional acquisitions, but here arteries and veins will appear equally enhanced (Fig 11).
Fig 11.
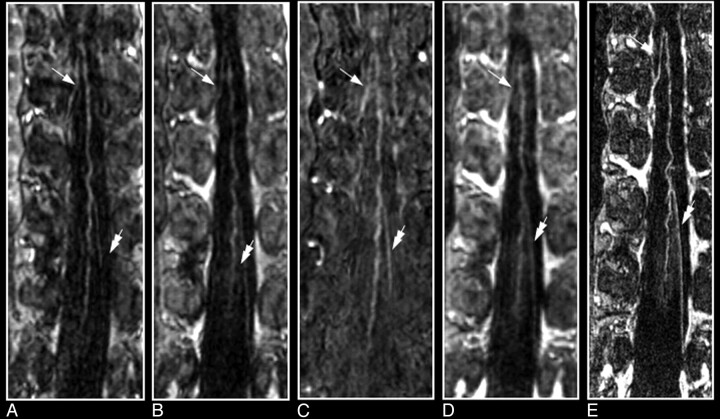
Comparison of contrast-enhanced MR angiography of spinal cord vessels with use of gadopentetate dimeglumine (Magnevist; A, B, and C) and the blood pool agent MS-325 (Vasovist; C, D and E) in the same patient with a thoracoabdominal aortic aneurysm. For both contrast agents, the first- and second-phase MR angiograms (each 40 seconds, 0.8 × 0.8 × 1.2 mm) are shown depicting the AKA (white arrow) and the GARV (double arrow). The vessels depicted appear slightly brighter (particularly in the second phase) with the blood agent (D) due to the higher longitudinal relaxivity. E, The main advantage of a blood agent is that it remains for a substantially longer time in the circulation, which allows long acquisition times (6 minutes) and, thus, high signal intensity-to-noise ratio and/or high spatial resolution (0.4 × 0.4 × 0.8 mm), as demonstrated with the steady-state image. Although steady-state images may provide strongly improved image quality compared with fast 2-phase images, differentiation between inlet artery and outlet vein is not possible. Note that the conus of the cord becomes enhanced as well.
In addition to the originally segmental supply to the AKA, there is increasing interest in diagnosing and imaging collateral arterial routes that may supply blood to the spinal cord. This is particularly of interest in patients with thoracoabdominal aortic aneurysms who suffer from atherosclerotic disease, because in these patients many of the segmental arteries are occluded,24 and the routing of blood to the spinal cord may critically depend on substitutional arterial pathways,54 potentially involving collateral anastomoses.55, 56 Because collateral arteries are usually small, located extradurally, and do not exhibit a blood-cord barrier, it would be interesting to investigate the potential of blood pool agents for visualization.
Conclusions
The clinical introduction of spinal cord MR angiography has provided a reliable, reproducible, and patient-friendly imaging technique to visualize the spinal cord blood supply. The consistent detection of the AKA has made MR angiography an attractive alternative to catheter angiography. As a clinical use, spinal cord MR angiography has shown to be a useful tool in the preoperative work-up of thoracoabdominal aortic aneurysm patients to localize the segmental supplying trajectories to the AKA.
Likewise, MR angiography proved to be helpful in the diagnosis of patients suspected of having AV malformations of the spinal cord. Both of these noninvasive techniques may serve as first diagnostic imaging techniques to exclude vascular pathology or to provide valuable information on the location of arterial feeders and the type of malformation to subsequently guide a catheter angiography procedure. Moreover, MR angiography seems capable of evaluating the effectiveness of endovascular or surgical treatment.
Acknowledgments
We thank Dr G. Kemerink for advice on the calculation of the CT radiation doses and Prof J.T. Wilmink for critically reviewing the article.
References
- 1.Krings T, Mull M, Gilsbach JM, et al. Spinal vascular malformations. Eur Radiol 2005;15:267–78 [DOI] [PubMed] [Google Scholar]
- 2.Krings T, Lasjaunias PL, Hans FJ, et al. Imaging in spinal vascular disease. Neuroimaging Clin N Am 2007;17:57–72 [DOI] [PubMed] [Google Scholar]
- 3.Savader SJ, Williams GM, Trerotola SO, et al. Preoperative spinal artery localization and its relationship to postoperative neurologic complications. Radiology 1993;189:165–71 [DOI] [PubMed] [Google Scholar]
- 4.Kieffer E, Fukui S, Chiras J, et al. Spinal cord arteriography: a safe adjunct before descending thoracic or thoracoabdominal aortic aneurysmectomy. J Vasc Surg 2002;35:262–68 [DOI] [PubMed] [Google Scholar]
- 5.Williams GM, Roseborough GS, Webb TH, et al. Preoperative selective intercostal angiography in patients undergoing thoracoabdominal aneurysm repair. J Vasc Surg 2004;39:314–21 [DOI] [PubMed] [Google Scholar]
- 6.Fereshetian A, Kadir S, Kaufman SL, et al. Digital subtraction spinal cord angiography in patients undergoing thoracic aneurysm surgery. Cardiovasc Intervent Radiol 1989;12:7–9 [DOI] [PubMed] [Google Scholar]
- 7.Pattany PM, Saraf-Lavi E, Bowen BC. MR angiography of the spine and spinal cord. Top Magn Reson Imaging 2003;14:444–60 [DOI] [PubMed] [Google Scholar]
- 8.Yamada N, Takamiya M, Kuribayashi S, et al. MRA of the Adamkiewicz artery: a preoperative study for thoracic aortic aneurysm. J Comput Assist Tomogr– 2000;24:362–68 [DOI] [PubMed] [Google Scholar]
- 9.Takase K, Sawamura Y, Igarashi K, et al. Demonstration of the artery of Adamkiewicz at multi-detector row helical CT. Radiology 2002;223:39–45 [DOI] [PubMed] [Google Scholar]
- 10.Thron A. Vascular Anatomy of the Spine. Oxford: Oxford University Press;2002
- 11.Lasjaunias P, Berenstein A, TerBrugge KG, eds. Spinal and Spinal Cord Arteries and Veins. Berlin: Springer-Verlag;2001
- 12.Krauss WE. Vascular anatomy of the spinal cord. Neurosurg Clin N Am 1999;10:9–15 [PubMed] [Google Scholar]
- 13.Skalski JH, Zembala M. Albert Wojciech Adamkiewicz: the discoverer of the variable vascularity of the spinal cord. Ann Thorac Surg 2005;80:1971–75 [DOI] [PubMed] [Google Scholar]
- 14.Koshino T, Murakami G, Morishita K, et al. Does the Adamkiewicz artery originate from the larger segmental arteries? J Thorac Cardiovasc Surg 1999;117:898–905 [DOI] [PubMed] [Google Scholar]
- 15.Hyodoh H, Kawaharada N, Akiba H, et al. Usefulness of preoperative detection of artery of Adamkiewicz with dynamic contrast-enhanced MR angiography. Radiology 2005;236:1004–09 [DOI] [PubMed] [Google Scholar]
- 16.Kawaharada N, Morishita K, Fukada J, et al. Thoracoabdominal or descending aortic aneurysm repair after preoperative demonstration of the Adamkiewicz artery by magnetic resonance angiography. Eur J Cardiothorac Surg 2002;21:970–74 [DOI] [PubMed] [Google Scholar]
- 17.Kawaharada N, Morishita K, Hyodoh H, et al. Magnetic resonance angiographic localization of the artery of Adamkiewicz for spinal cord blood supply. Ann Thorac Surg 2004;78:846–51; discussion 851–52 [DOI] [PubMed] [Google Scholar]
- 18.Jacobs MJ, Mess W, Mochtar B, et al. The value of motor evoked potentials in reducing paraplegia during thoracoabdominal aneurysm repair. J Vasc Surg 2006;43:239–46 [DOI] [PubMed] [Google Scholar]
- 19.Bowen BC. MR angiography of spinal vascular disease: what about normal vessels? AJNR Am J Neuroradiol 1999;20:1773–74 [PMC free article] [PubMed] [Google Scholar]
- 20.Bowen BC, DePrima S, Pattany PM, et al. MR angiography of normal intradural vessels of the thoracolumbar spine. AJNR Am J Neuroradiol 1996;17:483–94 [PMC free article] [PubMed] [Google Scholar]
- 21.Launay M, Chiras J, Bories J. Angiography of the spinal cord: venous phase. Normal features. Pathological application. J Neuroradiol 1979;6:287–315 [PubMed] [Google Scholar]
- 22.Willinsky R, Lasjaunias P, Terbrugge K, et al. Angiography in the investigation of spinal dural arteriovenous fistula. A protocol with application of the venous phase. Neuroradiology 1990;32:114–16 [DOI] [PubMed] [Google Scholar]
- 23.Yoshioka K, Niinuma H, Ehara S, et al. MR angiography and CT angiography of the artery of Adamkiewicz: state of the art. Radiographics 2006;26 (suppl 1):S63–73 [DOI] [PubMed] [Google Scholar]
- 24.Nijenhuis RJ, Jacobs MJ, Schurink GW, et al. Magnetic resonance angiography and neuromonitoring to assess spinal cord blood supply in thoracic and thoracoabdominal aortic aneurysm surgery. J Vasc Surg 2007;45:71–77; discussion 77–78 [DOI] [PubMed] [Google Scholar]
- 25.Jaspers K, Nijenhuis RJ, Backes WH. Differentiation of spinal cord arteries and veins by time-resolved MR angiography. J Magn Reson Imaging 2007;26:31–40 [DOI] [PubMed] [Google Scholar]
- 26.Hyodoh H, Shirase R, Akiba H, et al. Double-subtraction maximum intensity projection MR angiography for detecting the artery of Adamkiewicz and differentiating it from the drainage vein. J Magn Reson Imaging 2007;26:359–65 [DOI] [PubMed] [Google Scholar]
- 27.Nijenhuis RJ, Mull M, Wilmink JT, et al. MR angiography of the great anterior radiculomedullary artery (Adamkiewicz artery) validated by digital subtraction angiography. AJNR Am J Neuroradiol 2006;27:1565–72 [PMC free article] [PubMed] [Google Scholar]
- 28.Nijenhuis RJ, Gerretsen S, Leiner T, et al. Comparison of 0.5-M Gd-DTPA with 1.0-M gadobutrol for magnetic resonance angiography of the supplying arteries of the spinal cord in thoracoabdominal aortic aneurysm patients. J Magn Reson Imaging 2005;22:136–44 [DOI] [PubMed] [Google Scholar]
- 29.Sheehy NP, Boyle GE, Meaney JF. Normal anterior spinal arteries within the cervical region: high-spatial-resolution contrast-enhanced three-dimensional MR angiography. Radiology 2005;236:637–41 [DOI] [PubMed] [Google Scholar]
- 30.Nijenhuis RJ, Leiner T, Cornips EM, et al. Spinal cord feeding arteries at MR angiography for thoracoscopic spinal surgery: feasibility study and implications for surgical approach. Radiology 2004;233:541–47 [DOI] [PubMed] [Google Scholar]
- 31.Thron AK. Vascular malformations and interventional neuroradiology of the spinal cord. In: Brandt T, ed. Neurological Disorders Course and Treatment. Boston: Academic Press;2003. :517–28
- 32.Forbes G, Nichols DA, Jack CR Jr, et al. Complications of spinal cord arteriography: prospective assessment of risk for diagnostic procedures. Radiology 1988;169:479–84 [DOI] [PubMed] [Google Scholar]
- 33.Luetmer PH, Lane JI, Gilbertson JR, et al. Preangiographic evaluation of spinal dural arteriovenous fistulas with elliptic centric contrast-enhanced MR angiography and effect on radiation dose and volume of iodinated contrast material. AJNR Am J Neuroradiol 2005;26:711–18 [PMC free article] [PubMed] [Google Scholar]
- 34.Mascalchi M, Bianchi MC, Quilici N, et al. MR angiography of spinal vascular malformations. AJNR Am J Neuroradiol 1995;16:289–97 [PMC free article] [PubMed] [Google Scholar]
- 35.Bowen BC, Fraser K, Kochan JP, et al. Spinal dural arteriovenous fistulas: evaluation with MR angiography. AJNR Am J Neuroradiol 1995;16:2029–43 [PMC free article] [PubMed] [Google Scholar]
- 36.Mascalchi M, Ferrito G, Quilici N, et al. Spinal vascular malformations: MR angiography after treatment. Radiology 2001;219:346–53 [DOI] [PubMed] [Google Scholar]
- 37.Saraf-Lavi E, Bowen BC, Quencer RM, et al. Detection of spinal dural arteriovenous fistulae with MR imaging and contrast-enhanced MR angiography: sensitivity, specificity, and prediction of vertebral level. AJNR Am J Neuroradiol 2002;23:858–67 [PMC free article] [PubMed] [Google Scholar]
- 38.Binkert CA, Kollias SS, Valavanis A. Spinal cord vascular disease: characterization with fast three-dimensional contrast-enhanced MR angiography. AJNR Am J Neuroradiol 1999;20:1785–93 [PMC free article] [PubMed] [Google Scholar]
- 39.Shigematsu Y, Korogi Y, Yoshizumi K, et al. Three cases of spinal dural AVF: evaluation with first-pass, gadolinium-enhanced, three-dimensional MR angiography. J Magn Reson Imaging 2000;12:949–52 [DOI] [PubMed] [Google Scholar]
- 40.Farb RI, Kim JK, Willinsky RA, et al. Spinal dural arteriovenous fistula localization with a technique of first-pass gadolinium-enhanced MR angiography: initial experience. Radiology 2002;222:843–50 [DOI] [PubMed] [Google Scholar]
- 41.Mull M, Nijenhuis RJ, Backes WH, et al. Value and limitations of contrast-enhanced MR angiography in spinal arteriovenous malformations and dural arteriovenous fistulas. AJNR Am J Neuroradiol 2007;28:1249–58 [DOI] [PMC free article] [PubMed] [Google Scholar]
- 42.Takase K, Akasaka J, Sawamura Y, et al. Preoperative MDCT evaluation of the artery of Adamkiewicz and its origin. J Comput Assist Tomogr 2006;30:716–22 [DOI] [PubMed] [Google Scholar]
- 43.Nijenhuis RJ, Jacobs MJ, Jaspers K, et al. Comparison of magnetic resonance with computed tomography angiography for preoperative localization of the Adamkiewicz artery in thoracoabdominal aortic aneurysm patients. J Vasc Surg 2007;45:677–85 [DOI] [PubMed] [Google Scholar]
- 44.Ou P, Schmit P, Layouss W, et al. CT angiography of the artery of Adamkiewicz with 64-section technology: first experience in children. AJNR Am J Neuroradiol 2007;28:216–19 [PMC free article] [PubMed] [Google Scholar]
- 45.Boll DT, Bullow H, Blackham KA, et al. MDCT angiography of the spinal vaculature and the artery of Adamkiewicz. AJR Am J Roentgenol 2007;187:1054–60 [DOI] [PubMed] [Google Scholar]
- 46.Lai PH, Pan HB, Yang CF, et al. Multi-detector row computed tomography angiography in diagnosing spinal dural arteriovenous fistula: initial experience. Stroke 2005;36:1562–64 [DOI] [PubMed] [Google Scholar]
- 47.Lai PH, Weng MJ, Lee KW, et al. Multidetector CT angiography in diagnosing type I and type IVA spinal vascular malformations. AJNR Am J Neuroradiol 2006;27:813–17 [PMC free article] [PubMed] [Google Scholar]
- 48.Thomsen HS. Nephrogenic systemic fibrosis: a serious late adverse reaction to gadodiamide. Eur Radiol 2006;16:2619–21 [DOI] [PMC free article] [PubMed] [Google Scholar]
- 49.Leiner T, Herborn CU, Goyen M. Nephrogenic systemic fibrosis is not exclusively associated with gadodiamide. Eur Radiol 2007;17:1921–23 [DOI] [PubMed] [Google Scholar]
- 50.Kuo PH, Kanal E, Abu-Alfa AK, et al. Gadolinium-based MR contrast agents and nephrogenic systemic fibrosis. Radiology 2007;242:647–49 [DOI] [PubMed] [Google Scholar]
- 51.Jones DG, Shrimpton PC. Survey of CT practice in the UK: normalised organ doses for x-ray computed tomography calculated using Monte Carlo techniques. In: National Radiological Protection Board. Harwell UK; 1991. Available at http://www.impactscan.org/ctdosimetry.htm
- 52.McParland BJ. Entrance skin dose estimates derived from dose-area product measurements in interventional radiological procedures. Br J Radiol 1998;71:1288–95 [DOI] [PubMed] [Google Scholar]
- 53.Kemerink GJ, De Haan MW, Vasbinder GB, et al. The effect of equipment set up on patient radiation dose in catheter and CT angiography of the renal arteries. Br J Radiol 2003;76:625–30 [DOI] [PubMed] [Google Scholar]
- 54.Lazorthes G, Gouaze A, Zadeh JO, et al. Arterial vascularization of the spinal cord. Recent studies of the anastomotic substitution pathways. J Neurosurg 1971;35:253–62 [DOI] [PubMed] [Google Scholar]
- 55.Schurink GW, Nijenhuis RJ, Backes WH, et al. Assessment of spinal cord circulation and function in endovascular treatment of thoracic aortic aneurysms. Ann Thorac Surg 2007;83:S877–81; discussion S890–92 [DOI] [PubMed] [Google Scholar]
- 56.Yoshioka K, Niinuma H, Ogino Y, et al. Three-dimensional demonstration of the collateral circulation to the artery of Adamkiewicz with 16-row multislice computed tomography. Ann Thorac Surg 2006;81:749. [DOI] [PubMed] [Google Scholar]


