Abstract
BACKGROUND AND PURPOSE: T1-weighted inversion recovery (T1IR) imaging demonstrates higher brain tissue contrast and is more sensitive to contrast enhancement than T1-weighted spin-echo (T1SE) imaging. However, the effectiveness of the 2 imaging sequences in detecting brain metastases has not been studied. The objective of this report was to determine which sequence should be used for detecting brain metastases by comparing the effectiveness of T1IR imaging with that of T1SE imaging.
Materials and METHODS: Thirty-one patients with brain metastases underwent T1SE and T1IR with and without intravenous gadopentetate dimeglumine. T1SE and T1IR images were compared for the number of metastases, degree of contrast enhancement, volume and contrast-to-enhancement ratio (CER) of tumors, and contrast ratio (CR) of tumor to white matter (WM), tumor to gray matter (GM), and tumor to CSF.
RESULTS: There were 352 metastases in 31 patients, among which 2 patients with 5 metastases were demonstrated only on postenhanced T1SE images. Pre-enhanced and postenhanced T1SE images detected 162 and 350 lesions, respectively, whereas pre-enhanced and postenhanced T1IR images only discovered 94 and 233 lesions. The degree of tumor contrast enhancement was higher on T1IR images than on T1SE images, whereas no difference in the CER of tumors was found between the 2 sequences. Before enhancement, all of the CRs on T1IR images were higher than on T1SE images. After contrast enhancement, CRs of tumor to WM and tumor to GM were higher on T1SE images than on T1IR images. On the contrary, the CR of tumor to CSF was higher on T1IR images than on T1SE images. Tumor volumes were 5.6 ± 7.0 cm3 on postenhanced T1SE images and 5.5 ± 7.0 cm3 on postenhanced T1IR images, and no significant difference was found between the 2 groups.
CONCLUSION: T1SE, but not T1IR, should be used as T1-weighted imaging in detecting brain metastases, because T1SE imaging has a greater sensitivity than T1IR imaging both before and after contrast material administration.
MR T1-weighted images (T1WIs) are often used in neurologic imaging for the evaluation of anatomic structures. Acquired with the administration of contrast media, T1WIs have improved the detection of brain metastases.1 Spin-echo (SE) is the most commonly used pulse sequence for T1WIs, whereas inversion recovery (IR) is another option that has not been widely used in clinical work because of the much longer acquisition time. However, T1-weighted IR (T1IR) images provide higher T1-weighted contrast than T1-weighted SE (T1SE) images2; and with the acquisition time shortened by application of the fast IR technique for the past decade,3,4 the application of T1IR has gradually increased. Previous investigations2,5 indicated that T1IR demonstrated greater sensitivity for contrast enhancement and provided superior contrast between lesions and white matter (WM) compared with T1SE. However, Melhem et al6 showed converse results. We reasoned that the contradictory effects result partly from nonsingle diseases involved in those studies. Therefore, it is necessary to determine the clinical value of T1IR imaging on a monotype of diseases by comparing with T1SE imaging.
Brain metastases are common in patients with malignant tumors and account for 40% of all adult brain neoplasms. Early detection of brain metastases is essential for the treatment of the patients. We hypothesized that pre-enhanced imaging and postenhanced T1IR imaging have superior sensitivity to pre-enhanced and postenhanced T1SE imaging in detecting brain metastases. The purpose of this study was to test this hypothesis by comparing pre-enhanced and postenhanced T1IR and T1SE images in brain metastases.
Methods
Thirty-one patients with radiologically confirmed brain metastases were studied prospectively. Twenty-three were men and 8 were women. Their ages ranged from 36 to 78 (mean, 58) years. The primary neoplasms were lung cancer (16 patients), breast cancer (6 patients), carcinoma of the digestive tract (4 patients), carcinoma of the prostate (3 patients), and renal carcinoma (2 patients).
The 1.5T MR system with the standard circular polarized head coil was used (Signa Horizon; GE Healthcare, Milwaukee, Wis). T1IR was obtained with a fast SE IR sequence: 2160/12/1 (TR/TEeff/excitations); inversion time, 750 ms; echo-train length, 6; acquisition time, 1 minute 16 seconds; and number of sections, 13. T1SE was obtained with the following SE sequence: 340/9/1 (TR/TE/excitations); acquisition time, 1 minute 11 seconds; and number of sections, 13. Both sequences used a 256 × 192 matrix, a 220-mm rectangular FOV, and 9-mm-thick sections with a 1-mm gap. For contrast enhancement, gadopentetate dimeglumine (Magnevist; Schering, Berlin, Germany) was administrated with the standard dose of 0.1 mmol/kg of body weight. T1IR and T1SE were used alternately as the first gadolinium-enhanced sequence.
When the enhancing tumor solid part was larger than 5 mm, signal intensities were measured with a region of interest analysis of the tumor, WM, gray matter (GM), and CSF. The degree of tumor contrast enhancement was defined as the difference between pre-enhanced and postenhanced tumor signal intensities, which, divided by the pre-enhanced tumor signal intensity, was the contrast-to-enhancement ratio (CER). Tumor-to-WM contrast ratio (CR) was defined as the difference between the tumor and WM signal intensities divided by WM signal intensity. Corresponding procedures were used to determine the tumor-to-GM CR and tumor-to-CSF CR.
The number of brain metastases was counted on images from both sequences before and after contrast material administration. When the tumor was larger than 10 mm in diameter on postenhanced images, tumor volume was calculated as the product of the 3 measured dimensions divided by 2.
The statistical significance of the quantitative analysis was determined by using a 1-tailed paired t test. A P value of less than .05 was considered statistically significant.
Results
A total of 352 metastases were detected in 31 patients, among which 2 patients with 5 metastases were demonstrated only on postenhanced T1SE images. T1SE images detected more metastases than T1IR images both before and after contrast enhancement. Pre-enhanced and postenhanced T1SE images revealed 162 and 350 metastasic lesions, respectively, whereas pre-enhanced and postenhanced T1IR images discovered 94 and 233 metastasic lesions, respectively. Specifically, 2 patients, both with 2 lesions shown on postenhanced T1SE images, only had 1 lesion revealed on postenhanced T1IR images in each patient.
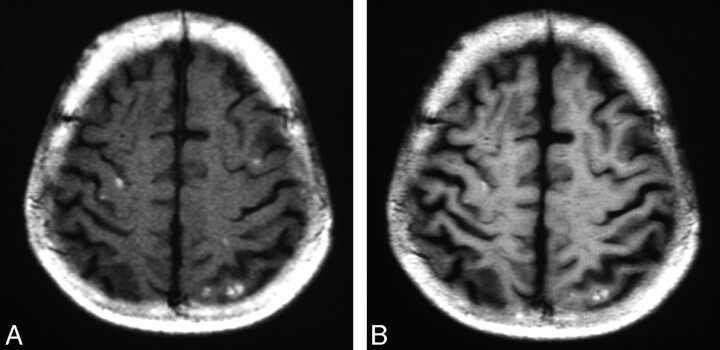
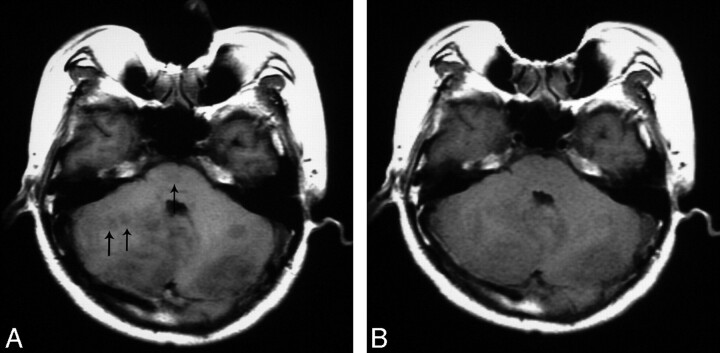
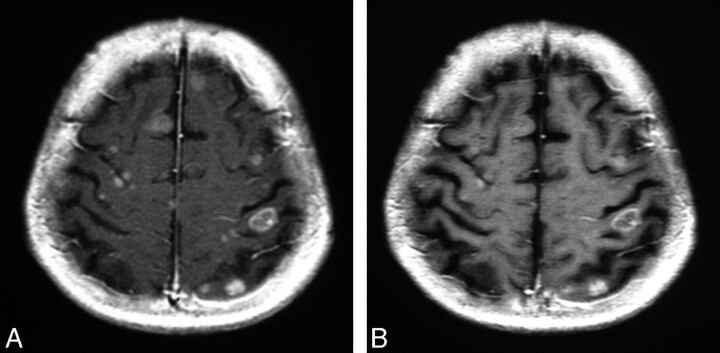
On the unenhanced images, T1SE images demonstrated 86 more metastases in 6 patients than did T1IR images, all of which were hyperintense on T1SE images (Fig 1), but detected 18 fewer metastases in 6 patients than did T1IR images, all of which were hypointense on T1IR images (Fig 2), whereas they showed an equal number in 19 patients. On the postenhanced images, T1SE images revealed 119 more metastases in 15 patients than did T1IR images (Fig 3), an equal number in 15 patients, and 2 fewer metastases in 1 patient than did T1IR images.
Fig 1.
Brain metastases from pulmonary carcinoma are hyperintense on pre-enhanced T1SE image (A) because of bleeding, and many lesions were missed on the pre-enhanced T1IR image (B).
Fig 2.
A, Brain metastases from pulmonary carcinoma are hypointense on a pre-enhanced T1IR image. B, Compared with T1IR, 2 small cerebellar metastases and 1 small pontine metastasis (black arrow) were not detected with pre-enhanced T1SE imaging, which only showed 3 larger cerebellar lesions.
Fig 3.
Postenhanced images of Fig. 1. The number of enhanced metastases is greater on postenhanced T1SE image (A) than on postenhanced T1IR image (B), and the conspicuity of lesions is better on the postenhanced T1SE image.
Metastases larger than 10 mm (n = 35) were equally detected on both sequences images. There were 261 metastases in total that were smaller than 5 mm. Pre-enhanced and postenhanced T1SE images detected 109 and 259 lesions, respectively, whereas pre-enhanced and postenhanced T1IR images only revealed 37 and 152 lesions. The difference in the sensitivity of the 2 sequences in detecting the lesions smaller than 5 mm is significant (P < .001).
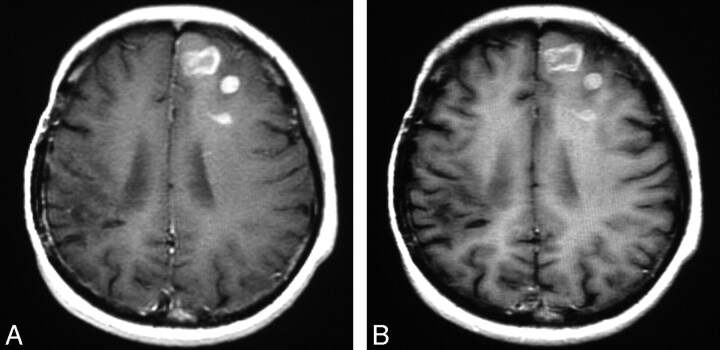
The signal intensities of metastases, degree of tumor contrast enhancement, and CER are summarized in Table 1, and the calculated CRs are summarized in Table 2. Because of the T1 shortening effect, the signal intensities of metastases on both sequence images were significantly (P < .001) increased after contrast material administration. Although the increase in tumor signal intensity on T1IR images was significantly higher than that on T1SE images (P < .001), the CER of metastases did not show a significant difference between the 2 sequences (P > .05). T1IR images had higher CRs before contrast material administration. However, the tumor-to-WM and tumor-to-GM CRs of T1SE images were higher than those of T1IR images on postenhancement (Fig 4). The CR of tumor-to-CSF was higher on T1IR images than on T1SE images.
Table 1:
Tumor signal intensity, degree of contrast enhancement, and CER detected with T1SE and T1IR
| Sequence | Signal Intensity, Mean ± SD |
Degree of Contrast Enhancement, Mean ± SD | CER, Mean ± SD, % | |
|---|---|---|---|---|
| Pre-Enhanced | Post enhanced | |||
| T1SE | 174.2 ± 17.0 | 346.9 ± 88.8 | 172.8 ± 93.4* | 101.7 ±5 9.4† |
| T1IR | 270.7 ± 47.6 | 492.9 ± 94.1 | 222.2 ± 108.4* | 90.0 ± 60.7† |
Note:—T1SE indicates T1-weighted spin-echo; T1IR, T1-weighted inversion recovery; CER, contrast-to-enhancement ratio.
T1IR is higher (P < .001).
There is no difference between the 2 sequences (P > .05).
Table 2:
CR of metastases detected with T1SE and T1IR
| Sequence | CR, Mean±SD |
|||||
|---|---|---|---|---|---|---|
| Tumor to WM |
Tumor to GM |
Tumor to CSF |
||||
| Pre-Enhanced | Postenhanced | Pre-Enhanced | Postenhanced | Pre-Enhanced | Postenhanced | |
| T1SE | 0.2 ± 0.1* | 0.6 ± 0.4† | 0.1 ± 0.1* | 0.9 ± 0.5† | 0.9 ± 0.3* | 2.8 ± 1.1* |
| T1IR | 0.3 ± 0.1* | 0.3 ± 0.2† | 0.2 ± 0.1* | 0.7 ± 0.3† | 2.3 ± 0.8* | 4.9 ± 1.4* |
Note:—T1SE indicates T1-weighted spin-echo; T1IR, T1-weighted inversion recovery; CR, contrast ratio; WM, white matter; GM, gray matter.
T1IR is more sensitive (P < .05).
T1SE is more sensitive (P < .05).
Fig 4.
Brain metastases from breast cancer. The volume of the biggest metastases among the 3 lesions is similar between postenhanced T1SE image (A) and T1IR image (B), and the conspicuity of 2 smaller lesions is better on postenhanced T1SE image with more obvious contrast with brain tissue.
Mean volumes of the tumors larger than 10 mm in diameter were 5.6 ± 7.0 cm3 on contrast-enhanced T1SE images and 5.5 ± 7.0 cm3on contrast-enhanced T1IR images. No significant difference was detected between the 2 sequences (P > .05).
Discussion
The IR sequence increases T1 contrast by 180° radio-frequency pulse, and, thus, T1IR images improve the contrast of WM to GM.5–7 One of the disadvantages for T1IR imaging was the long acquisition time because of the long TR. Recently, the acquisition time has been shortened by fast IR technique. In our study, the acquisition time of T1IR was almost similar to that of T1SE. For this reason, the clinical application of T1IR has increased.
Rydberg et al5 and Lee et al7 reported that T1IR imaging provided improved lesion-to-background contrast and comparable or superior detectability of the lesions to those of T1SE imaging at 1.5T. Hori et al2 demonstrated similar results at 0.2T. However, Melhem et al6 reported that T1SE imaging revealed more lesions and higher contrast-to-noise ratios than T1IR imaging. Fischbach et al8 reported that T1SE improved contrast-enhanced lesions conspicuously to those of T1IR at 3T. We reasoned that the reason for this discrepancy was because many types of diseases were included in their investigations, but not the difference of field strength. Therefore, we conducted a study that only focused on brain metastases to determine the clinical value of contrast-enhanced T1IR.
In the patients with malignant neoplasms, detection of brain metastases is essential for optimal treatment and prognosis of patients. Large brain metastases are frequently associated with marked mass effect and vasogenic edema and can be readily detected on MR imaging. The results of previous studies9,10 suggested that a lesion size of 10 mm is the critical value in lesion detection. In our study, lesions larger than 10 mm were readily detected, and the enhancing tumor volumes were similar on the 2 sequence contrast-enhanced images, consistent with previous studies.
However, the difference in the detectability of small metastases, which had little vasogenic edema or mass effect, is significant between T1IR imaging and T1SE imaging. Compared with T1IR imaging, T1SE imaging detected more metastases smaller than 5 mm.
On the unenhanced images, T1IR images had higher CRs than T1SE images, and T1IR was more sensitive in detecting hypointense metastic lesions. However, it still cannot reveal most of the small metastases. Pre-enhanced T1IR imaging only detected 18 more lesions in 31 patients than pre-enhanced T1SE imaging. By contrast, parts of the small metastases could be detected on T1SE because of hyperintense hemorrhage, which appeared as isointensity on T1IR images compared with brain tissue and could not be detected. Eighty-six hemorrhagic hyperintense metastases were revealed on pre-enhanced T1SE images that were not detected on pre-enhanced T1IR images.
To detect small metastases, contrast material administration is required. As a result of increasing T1 contrast, T1IR imaging showed a higher degree of tumor contrast enhancement than T1SE imaging. However, postenhanced T1IR images had lower CRs of tumor to WM and tumor to GM in our study, which indicates that postenhanced T1IR images are less sensitive than postenhanced T1SE images in displaying enhanced lesions. In addition, small metastases often have only mild contrast enhancement. Compared with the high signal intensity WM on T1IR images, those small metastases are not conspicuous and are usually difficult to detect. However, these small lesions can be easily detected on T1SE imaging.
Although T1IR imaging can partially or completely null the signal intensity of CSF and has higher tumor-to-CSF CR than T1SE images pre-enhancement and postenhancement, the CSF signal intensity is relatively low on T1SE imaging so that tumor-to-CSF CR was high as well in our study. T1IR images had no obvious predominance in revealing lesions located in the ventricles or cortex close to CSF compared with T1SE images.
Although double- or triple-dose contrast medium can help to detect small metastases better than a single dose,11 a single dose is more frequently used in clinical work. Therefore, T1IR imaging and T1SE imaging were compared only with single-dose contrast medium in this study. Certainly, to further clarify the clinical value of T1IR imaging, future studies should be conducted with higher doses of contrast medium.
Conclusion
Although pre-enhanced T1IR imaging is superior in revealing hypointense lesions, pre-enhanced T1SE imaging can detect more brain metastases because of its sensitivity to bleeding lesions. After contrast medium administration, T1IR imaging had lower CRs of tumor to WM and tumor to GM and was less sensitive in detecting small brain metastases compared with T1SE imaging. Our results, therefore, suggest that T1SE, but not T1IR, should be used as T1-weighted imaging in detecting brain metastases at 1.5T.
References
- 1.Yokoi K, Kamiva N, Matsuquma H, et al. Detection of brain metastasis in potentially operable non-small cell lung cancer: a comparison of CT and MRI. Chest 1999;115:714–19 [DOI] [PubMed] [Google Scholar]
- 2.Hori M, Okubo T, Uozumi K, et al. T1-weighted fluid-attenuated inversion recovery at low field strength: a viable alternative for T1-weighted intracranial imaging. AJNR Am J Neuroradiol 2003;24:648–51 [PMC free article] [PubMed] [Google Scholar]
- 3.Mulkern RV, Wong ST, Sinalski C, et al. Contrast manipulation and artifact assessment of and 3D RARE sequence. Magn Reson Imaging 1990;8:557–66 [DOI] [PubMed] [Google Scholar]
- 4.Melki PS, Mulkern RV, Lawrence PP, et al. Comparing the FAISE method with conventional dual-echo sequences. J Magn Reson Imaging 1991;1:319–26 [DOI] [PubMed] [Google Scholar]
- 5.Rydberg JN, Hammond CA, Huston J 3rd, et al. T1-weighted MR imaging of the brain using a fast inversion recovery pulse sequence. J Magn Reson Imaging 1996;6:356–62 [DOI] [PubMed] [Google Scholar]
- 6.Melhem ER, Bert RJ, Walker RE. Usefulness of optimized gadolinium-enhanced fast fluid-attenuated inversion recovery MR imaging in revealing lesions of the brain. AJR Am J Roentgenol 1998;171:803–07 [DOI] [PubMed] [Google Scholar]
- 7.Lee JK, Choi HY, Lee SW, et al. Usefulness of T1-weighted image with fast inversion recovery technique in intracranial lesions: comparison with T1-weighted spin echo image. Clin Imaging 2000;24:263–69 [DOI] [PubMed] [Google Scholar]
- 8.Fischbach F, Bruhn H, Pech M, et al. Efficacy of contrast medium use for neuroimaging at 3.0 T: utility of IR-FSE compared to other T1-weighted pulse sequences. J Comput Assist Tomogr 2005;29:499–505 [DOI] [PubMed] [Google Scholar]
- 9.Yuh WT, Tali ET, Nguyen HD, et al. The effect of contrast dose, imaging time, and lesion size in the MR detection of intracerebral metastasis. AJNR Am J Neuroradiol 1995;16:373–80 [PMC free article] [PubMed] [Google Scholar]
- 10.Essig M, Knopp MV, Schoenberg SO, et al. Cerebral gliomas and metastases: assessment with contrast enhanced FAST fluid-attenuated inversion-recovery MR imaging. Radiology 1999;210:551–57 [DOI] [PubMed] [Google Scholar]
- 11.Runge VM, Wells JW, Nelson KL, et al. MR imaging detection of cerebral metastases with a single injection of high-dose gadoteridol. J Magn Reson Imaging 1994;4:669s–73s [DOI] [PubMed] [Google Scholar]


