Abstract
Non-invasive continuous alcohol (ethanol) monitoring has potential applications in both population research and in clinical management of acute alcohol intoxication or chronic alcoholism. Current wearable monitors based on transdermal alcohol content (TAC) sensing have limited accessibility and blood alcohol content (BAC) quantification accuracy. Here we describe the development of a self-contained discreet wearable transdermal alcohol (TAC) sensor in the form of a wristband or armband. This sensor can detect vapor-phase alcohol in perspiration from 0.09 ppm (equivalent to 0.09 mg/dL sweat alcohol concentration at 25 °C under Henry’s Law equilibrium) to over 500 ppm at one-minute time resolution. Additionally, a digital sensor was employed to monitor the temperature and humidity levels inside the sensing chamber. Two male human subjects were recruited to conduct studies with alcohol consumption using calibrated prototype TAC sensors to validate the performance. Our preliminary data demonstrated that, under well-controlled conditions, this sensor can acquire TAC curves at low doses (1–2 standard drinks). Moreover, TAC data for different doses can be easily distinguished. However, substantial interpersonal and intrapersonal variabilities in measurement data were also observed in experiments with less controlled conditions. Our observations suggest that perspiration rate might be an important contributing factor to these variabilities. Further studies with sufficient sample sizes are required to validate and characterize the impact of different perspiration rates on TAC sensors, which may inform more reproducible and accurate sensor designs in the future.
Index Terms—: BAC, ethanol, fuel cell, IoT, TAC, transdermal alcohol sensor, variability, wearable sensor
Graphical Abstract
I. Introduction
ALCOHOL (ethanol) consumption is common in the US and around the world with more than half of the US adult population reporting alcohol drinking in the past 30 days [1]. After intake, alcohol molecules pass through the blood-brain barrier and may cause impairment of a person’s mental and physical abilities, a condition known as intoxication [2]. The annual economic cost to the US due to excessive alcohol consumption was estimated to be $249 billion in 2010 [1]. In addition, over 10,000 deaths are caused by alcohol-impaired driving every year despite comprehensive social education and awareness campaigns. In general, the use of alcohol is associated with a myriad of negative impacts on disease processes and clinical outcomes [3] [4].
Self-reported data or point measurements are utilized to conduct alcohol-related research and make clinically relevant decisions [5] [6]. Based on legal and medical standards of observation, blood alcohol content (BAC) levels for an individual is one of the most important metrics. However, human error and biases inherent in self-reporting may affect the accuracy of collected data [6] [7]. Further, collection of measurements with high temporal resolution is challenging via self-reporting, while a blood or a single breathalyzed BAC reading does not give information regarding the rates of metabolism or absorption. A non-invasive and unobtrusive continuous BAC monitoring device is needed to address these challenges. Additionally, due to the challenges in continuous sampling of blood, it is desirable to find an alternative target that can be easily sampled. Since about 1% of alcohol ingested escapes through perspiration [8], detecting alcohol released from the skin through a method known as transdermal alcohol content (TAC) sensing and deriving BAC values from these measurements is a promising way to achieve this goal.
During the past two decades, wearable TAC sensors for personal alcohol monitoring have been widely adopted in law enforcement settings (SCRAM Systems). However, the bulky design of the device means that it is not conducive to being worn over an extended period of use, limiting its use in wider applications. Meanwhile, the National Institute on Alcohol Abuse and Alcoholism (NIAAA) has been advocating efforts in developing wearable alcohol monitors. In 2016, NIAAA held a challenge to develop discreet wearable biosensors for continuous alcohol monitoring, which led to an unobtrusive wristband device, BACtrack Skyn. Currently, this product is available for research use, but little technical implementation information has been released by the manufacturer.
Several research groups have been developing liquid-phase sweat biosensors for alcohol monitoring [9] [10]. Liquid-phase sweat analysis differs from TAC sensors in that liquid-phase technologies detect alcohol content in liquid sweat while TAC sensing uses insensible perspiration (evaporated content from sweat). Liquid-phase sensing is limited by challenges in continuous sampling of liquid sweat. As a result, no such devices have been adopted into practical applications such as alcohol-related research and law enforcement.
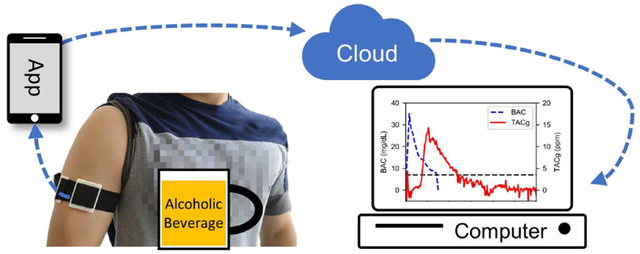
In this work, we demonstrate a self-contained discreet wearable sensor to continuously monitor vapor-phase alcohol concentration in perspiration. The design goal was to utilize state-of-the-art microelectronics and fuel-cell sensors to enable a wristband-sized form factor, which makes it user-friendly and unobtrusive. To monitor the internal conditions of the gas collection chamber, a temperature and humidity sensor was employed in addition to the vapor-phase alcohol sensor, as these two factors have been observed to affect the alcohol sensor readings. Furthermore, the wearable sensor is connected to the cloud as an IoT device through an Android smartphone gateway via Bluetooth Low Energy (BLE) [11]. By capitalizing on the ubiquity of smartphones and the advancements in cloud systems, the proposed wearable IoT system has the potential to enable large-scale alcohol-related research and health management.
II. Materials and Methods
A. Principle of Transdermal Alcohol Sensing
After alcohol consumption, ethanol is first absorbed by the stomach and small intestine through passive diffusion. The alcohol content then distributes throughout the blood circulatory system, reaching other organs in the body, including skin. It has been estimated that approximately 1% of ingested alcohol is excreted through the skin as perspiration [8]. Following this excretion, the sweat continuously evaporates, allowing some of the ethanol molecules to diffuse freely in air. It is through this process that the vapor-phase alcohol content can be measured by an alcohol gas sensor.
In our design, the physical quantity measured is the concentration of alcohol vapor in contact with the sensor, in parts-per-million (ppm). To avoid any ambiguity in “TAC” between alcohol present in vapor or liquid form, we define a variable specific to the TAC in gas phase: TACg.
Our device relies on consumption of the fuel cell sensor and leakage for clearing ethanol in the system. In our studies, fuel cell sensor readings returned to their baseline over time, suggesting there was no ethanol accumulation. However, if a faster response time is needed, a fan or pump can be added to actively remove ethanol (as done in the SCRAM devices).
B. Fuel Cell-based Alcohol Sensor
A two-lead electrochemical fuel cell alcohol sensor was selected as the main transducer (Dart Sensors, SKU: 2-EA11) to convert chemical signals (ethanol) into electrical signals. It catalyzes the reduction-oxidation (redox) reactions between ethanol molecules and oxygen, producing water and carbon dioxide [12] [13]. Meanwhile, electrical current is generated to complete the fuel cell reaction (refer to supplementary information, SI.2, for more details). To meet practical size requirements of wearable devices, a custom sensor housing (Fig 1.D) was designed and fabricated from a 1/4-inch thick polypropylene (PP) sheet (McMaster-Carr, 8742K135) using a CNC milling machine (Roland, MDX-50).
Fig. 1.
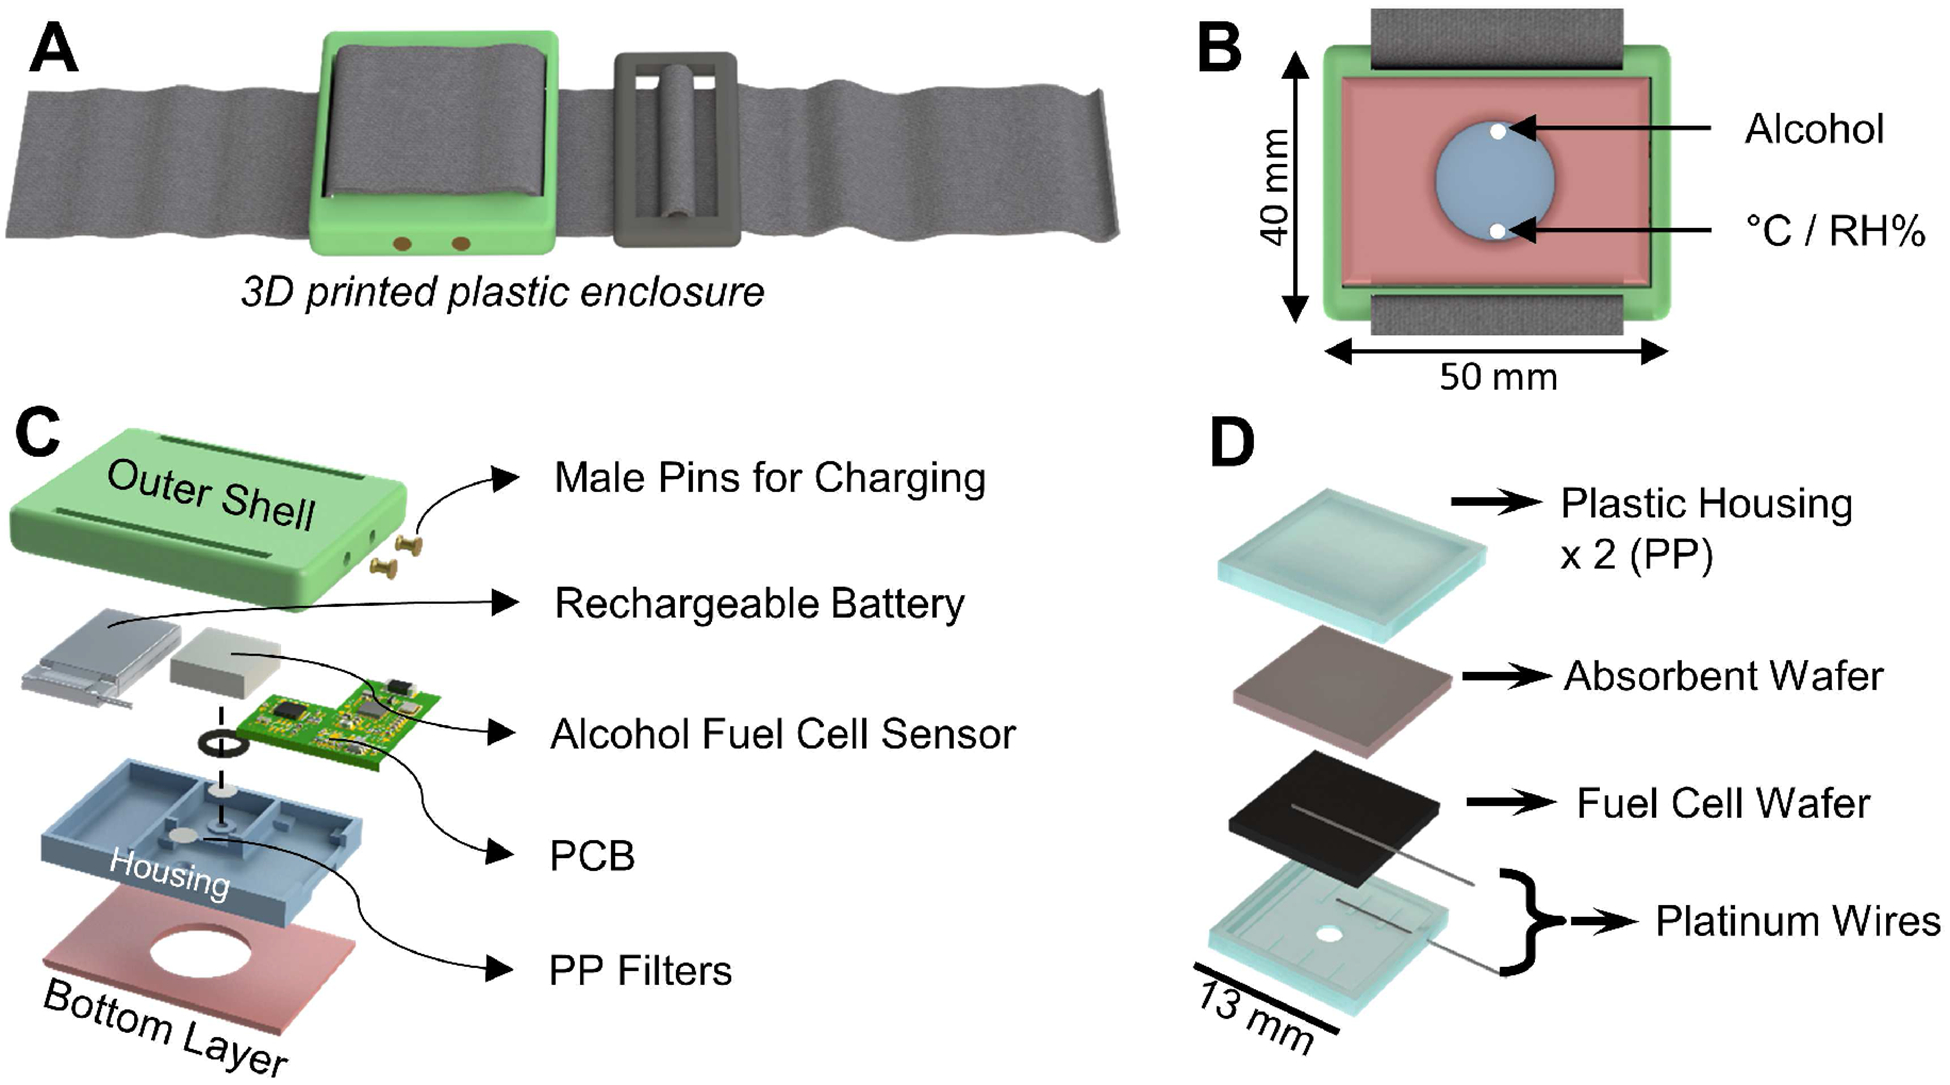
Design of the wearable IoT TAC sensor and its working principles. (A) 3D illustration of a fully assembled wearable TAC sensor. (B) Bottom view of the sensor. (C) Exploded view of the internal structure of the sensor. (D) Exploded view of the custom packaging of the fuel cell alcohol sensor.
Under heavy perspiration, liquid sweat will accumulate inside the gas collection chamber. A porous polypropylene membrane filter covers the inlet ports of the sensors, avoiding direct contact between liquid sweat and sensing electrodes.
C. Device Enclosure Design
The device enclosure has an overall size of 40 mm × 50 mm × 10 mm, which can be fixed on the body using an elastic band (Fig 1.A). Two gas inlet ports (Fig 1.B) were designed to provide independent gas diffusion pathways to individual sensing elements, minimizing the sensor response time. The bottom layer of the enclosure has a thickness of 2 mm and has a 20 mm hole in the center, forming a sweat vapor collection chamber after being placed on the human body. Prototype enclosures were fabricated using a 3D printer (Zortrax M200) and ABS plastic blend filament (Zortrax ZULTRAT).
D. Low-Power Data Acquisition System
A low-power embedded system with BLE capabilities was designed based on a wireless microcontroller (CC2650) to perform data acquisition, storage, and transmission (Fig 2.A). An 8-megabyte flash memory device (MX25R6435F) was employed for non-volatile data storage, a potentiostat chip (LMP91000) was utilized to interface with the fuel cell sensor, and a calibrated digital temperature and humidity sensor (HTU21D) was incorporated to monitor the environmental factors inside the sensing chamber. Additionally, a voltage regulator (TPS78230) and a charge management controller (MCP73831) were included to support the operation of rechargeable lithium battery.
Fig. 2.
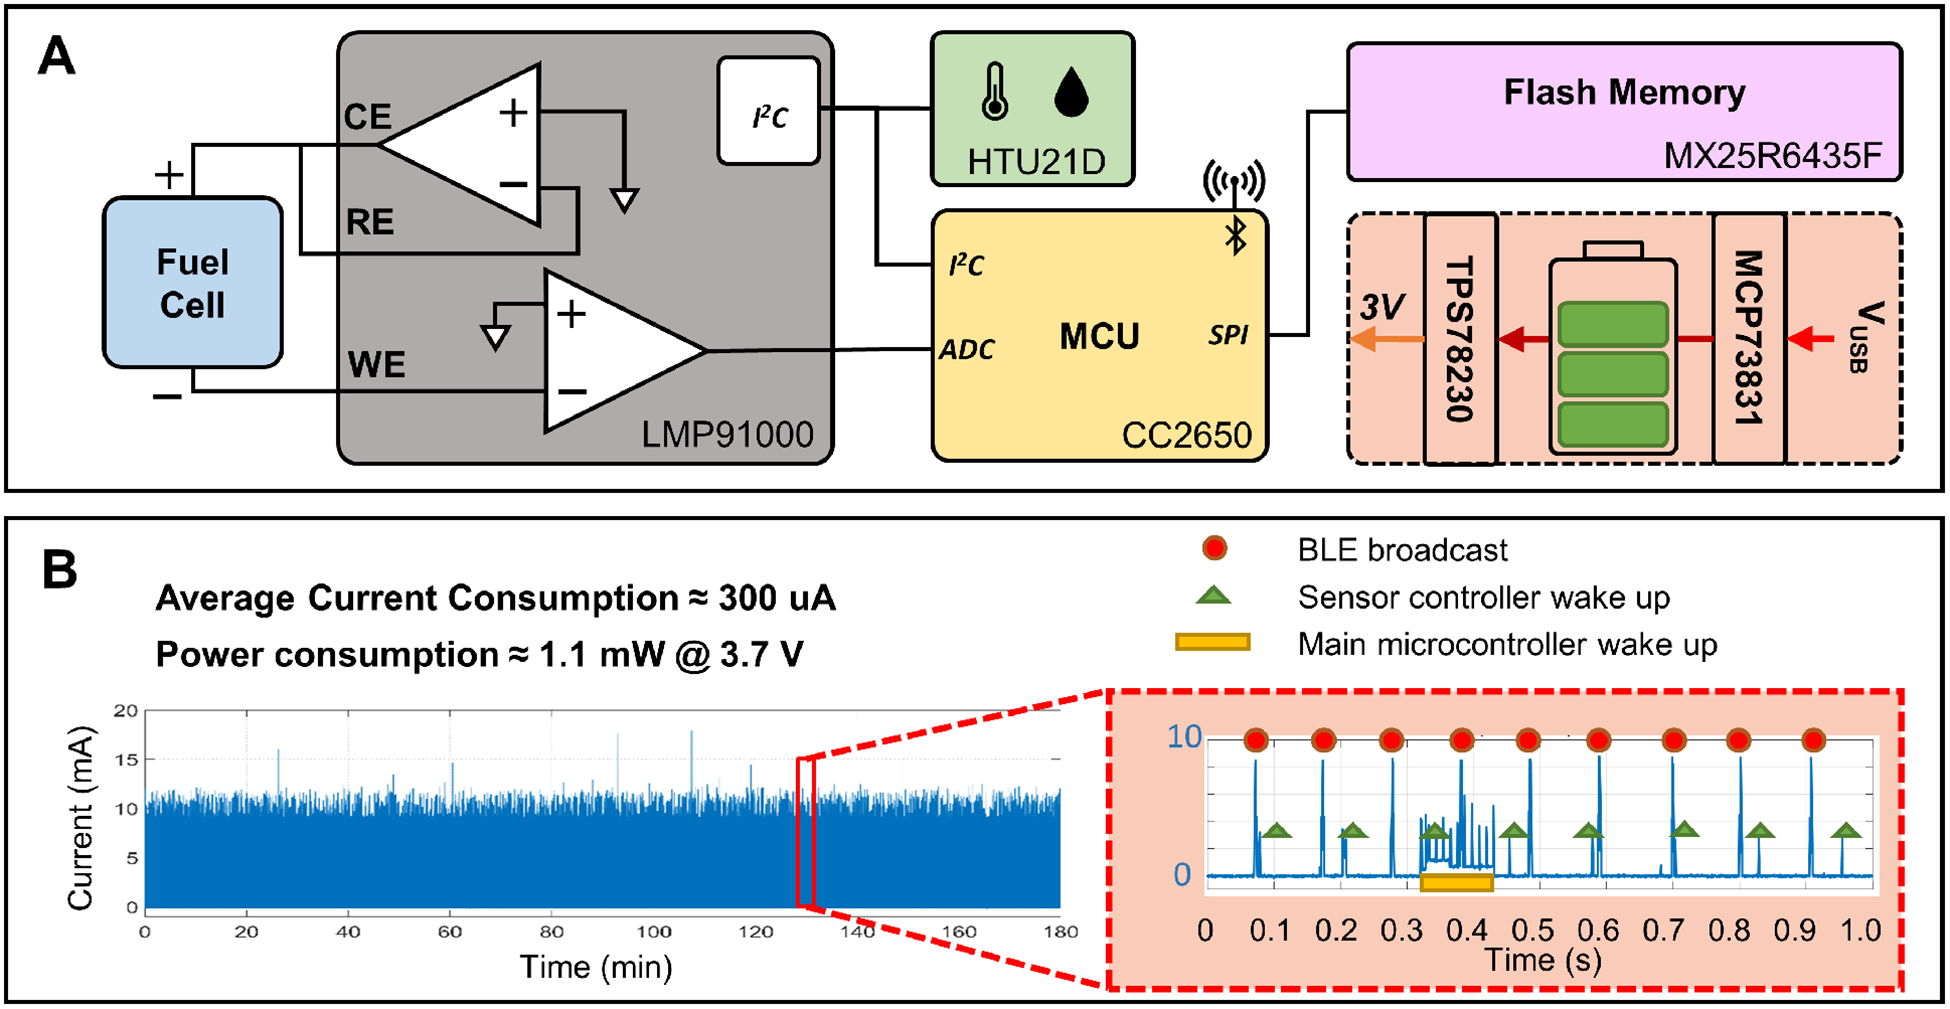
Design and power consumption of the miniature low-power wireless data acquisition system. (A) Block diagram of the design of the electronics system. (B) Power consumption of the electronics system with custom event-based firmware running continuously.
Loaded with a custom event-driven firmware developed in our lab, the power consumption of a fully functional prototype circuit was about 1.1 mW with a 3.7 V supply (Fig 2.B), permitting a 110 mAh lithium battery to last for over a week.
Silicone modified conformal coating (MG Chemicals 422B) was applied on both sides of the a populated PCB to protect it from corrosion. This coating is critical for reliability, as the circuit will be working in a high humidity environment.
E. Android App as the Gateway Device
An Android application was developed to use a smartphone as the gateway device, bridging the wearable IoT sensor and the cloud system (SI.5). When connected with a wearable sensor, real-time or historical measurement data can be retrieved over BLE and stored in local storage in JSON format. Additionally, once provided with Internet access, the retrieved measurement data will be uploaded to the cloud database system automatically using the InfluxDB-java library.
F. Cloud System for IoT Data Storage and Analytics
A cloud system was deployed on an EC2 instance (t2.micro) on Amazon Web Services (AWS) for data storage and analytics. It was built upon two open-source software: InfluxDB and Grafana. InfluxDB is a time-series database, storing the timestamped measurement data uploaded by the gateway devices, while Grafana provides a web-based user interface for data visualization and management. A dashboard (SI.5) was configured to display the measurement data from a selected wearable IoT sensor. These records can also be downloaded to a local computer for further analysis.
G. Transdermal Alcohol Sensor Calibration
Six 600mL water-ethanol mixture solutions of various known concentrations (0 to 0.60%, weight/volume) were prepared by diluting reagent-grade 99.45% ethanol (Sigma-Aldrich E7023–4L) in pure water contained in 32oz mason jars. The alcohol sensor prototypes were placed in each mason jar in sequence, with the cover sealed. Over time, the ethanol vapor concentration inside a mason jar will reach equilibrium, whose value can be determined by Henry’s law [14] (see SI.6 for more details). Therefore, the calibration parameters can be derived.
After the calibration routine (six calibration experiments), data for different concentrations were aligned and data segments at 25–30 minutes were extracted to derive the calibration curve (Fig 3.A). The readings of the alcohol sensors are linearly proportional to the ambient ethanol gas concentration.
Fig. 3.

Sensor Characterization. (A) Sample calibration curve obtained from six different ethanol gas calibration concentrations, error bars are too small to be visible (ranging from 0.3–1.3% of the measurement values). (B) Results of an on-body deployment experiment with no alcohol consumption, showing a baseline shift caused by a temperature gradient between the human body and the environment. The baseline shift stabilized after approximately 1 hour and was removed in data post-processing.
H. Sensor Baseline Characterization
Electrochemical sensors can be affected by ambient meteorological parameters, especially temperature [15]. As a result, even without alcohol, the sensor output may change after attached to the human body. This on-body baseline shift was evaluated in a lab environment (T ≈ 25°C) without the presence of alcohol: a wearable sensor was first placed on a table for an extended period (> 2 hours), establishing the baseline. Subsequently, it was attached to a male human subject (no alcohol intake) on the left upper arm for 2–4 hours to observe the behavior of the baseline during on-body deployment.
A sample results of the baseline characterization experiment is shown in Fig 3.B. Changes in measurement data were observed after on-body deployment, with the mean rising from −0.07 ppm to 5.74 ppm, and the standard deviation increased from 0.03 ppm to 0.13 ppm. This baseline shift reached a plateau in roughly an hour. Although the underlying mechanism is not clear, the baseline shift of the fuel cell sensor was mainly affected by the temperature gradient across the electrodes. In practice, this shift was approximated by a second-order polynomial and subtracted from the original measurement data.
I. Study Protocol and Sensor Testing with Human Subjects
Human subject studies were conducted in a lab environment to validate sensor performance. A 10+ hour fasting subject was instructed to wear the alcohol sensor on the left upper arm and wait for an hour for the baseline to stabilize. Next, the subject consumed one or two standard drinks (Sake, 15% alcohol content) within five minutes and rinsed his/her mouth thoroughly to eliminate any residual mouth alcohol [18]. A breathalyzer (BACtrack S80) was provided to measure BAC levels every 5 minutes, until it indicated a reading of 0. The subject was asked to avoid food and water intake during this period for consistent alcohol absorption in the body. Once the BAC level reached zero, the subject could ingest food without alcohol content. Each experiment ended 6 hours after drinking, and measurement data was retrieved for analysis.
Following the protocols outlined above, six alcohol consumption experiments — three with one standard drink and three with two standard drinks — were conducted by a male subject (subject 1) over the span of two months to validate the performance of the sensor prototypes and study the variability of both BAC and TACg. To demonstrate body location induced variability, in one of the six trials, subject 1 was instructed to wear two calibrated sensors, one on the left upper arm and one on the left ankle. Later, a second male human subject (subject 2) was recruited to conduct alcohol administration experiments following the same protocol to demonstrate sensor variabilities between two individuals. Finally, based on our observations, two experiments (1 standard drink each) were conducted by subject 2 in two consecutive days under different clothing conditions to demonstrate the sensor variabilities under different perspiration rates. The demographic data are provided in supplementary information (SI.7).
III. Results
A. Single Subject BAC and TACg measurements
Fig 4 shows the mean values of the BAC and TACg under different doses plotted in two separate graphs, with color bands depicting the corresponding standard deviations. These results showed peak delays and broadening of TACg curves, which agrees with previous studies morphologically [16] [17].
Fig. 4.
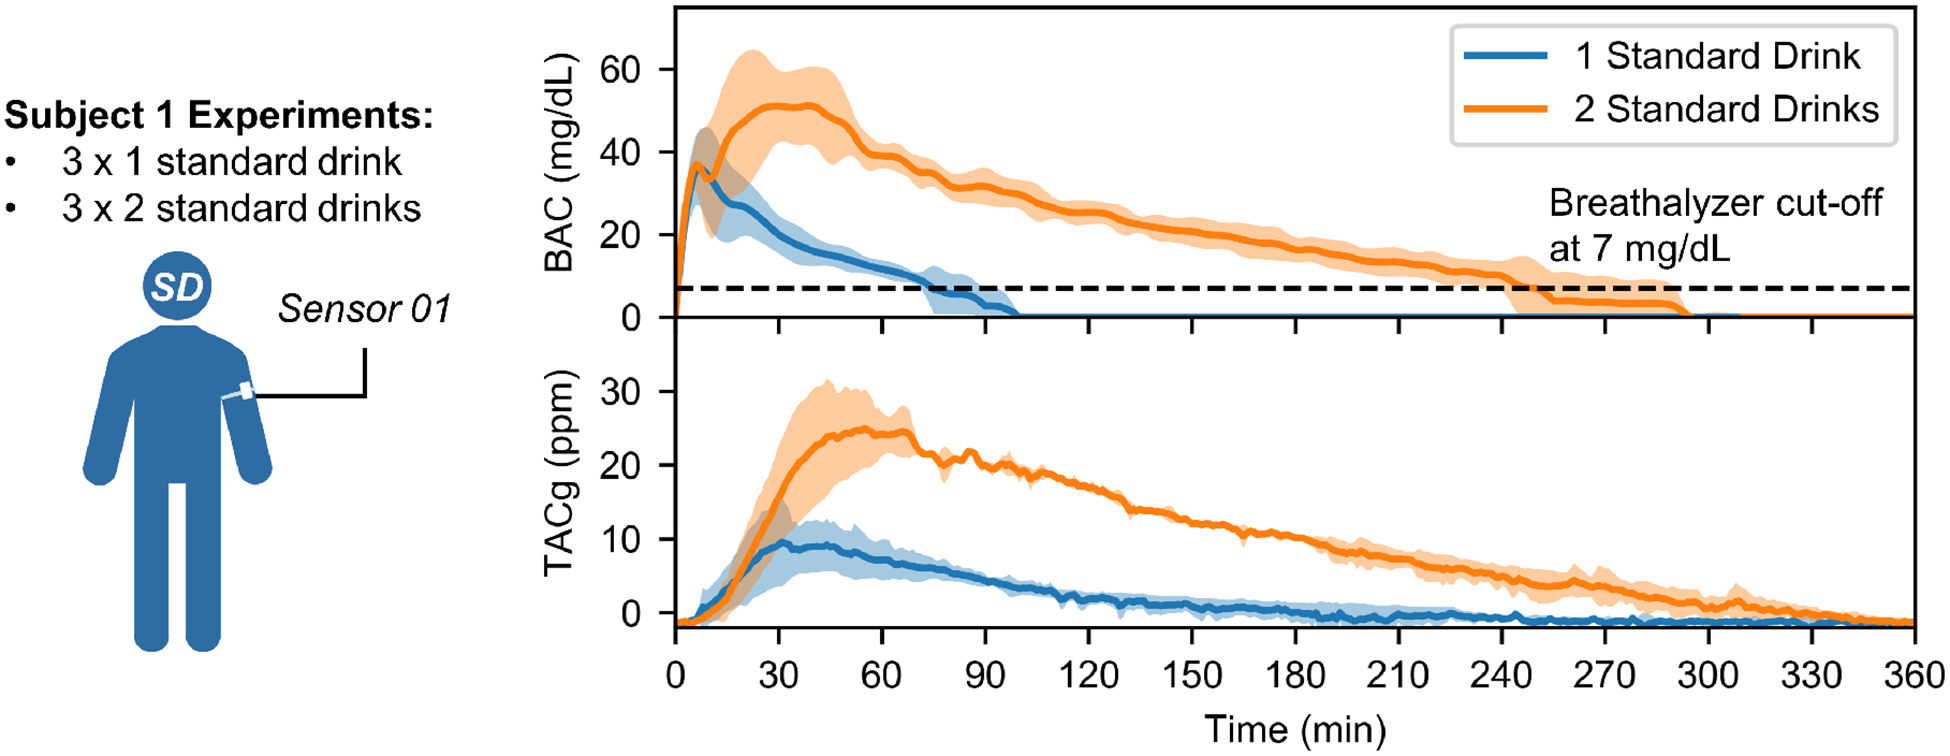
Human subject testing under well-controlled conditions. Average BAC and TACg data obtained from six experiments conducted on a male human subject (subject 1), with color bands highlighting the corresponding standard deviations. Compared to BAC curves, profiles of TACg data are delayed and broadened, consistent with previous studies [16] [17]. In addition, the results show both BAC and TACg curves can easily distinguish one and two standard drinks. Individual BAC and TACg data are provided in supplementary information (SI.8).
The peak BAC values for one and two standard drinks experiments were 37.0 ± 7.2 mg/dL and 53.0 ± 11.3 mg/dL, respectively. The peak TACg values for the two sets of trials were 10.3 ± 5.1 ppm and 26.4 ± 4.5 ppm. Time delays between peak BAC values and peak TACg values were 27.3 ± 10.1 min for one standard drink tests and 27.3 ± 10.8 min for two standard drinks tests.
Previous studies have shown that area under the curve (AUC) of TAC data is highly correlated with total quantity of alcohol consumed [19] [20]. In our experiments, the AUCs of TACg curves under one and two standard drinks studies are 487.18 ± 251.50 a.u. and 3380.50 ± 231.73 a.u., respectively. Spearman’s correlation coefficient between the number of drinks and the AUCs is rs=0.88 (p-value=0.02). This demonstrates that low-level drinks can be distinguished by AUCs of TACg measurements for subject 1.
B. Intrapersonal Variability of TACg measurements
Fig 5.A shows the observed differences in TACg measurements due to the sensor’s position on the body. As shown, the TACg measurements were substantially different, which suggests that different locations on the body can produce very different TACg results. Possible explanations include different sealing conditions and ethanol evaporation rates.
Fig. 5.
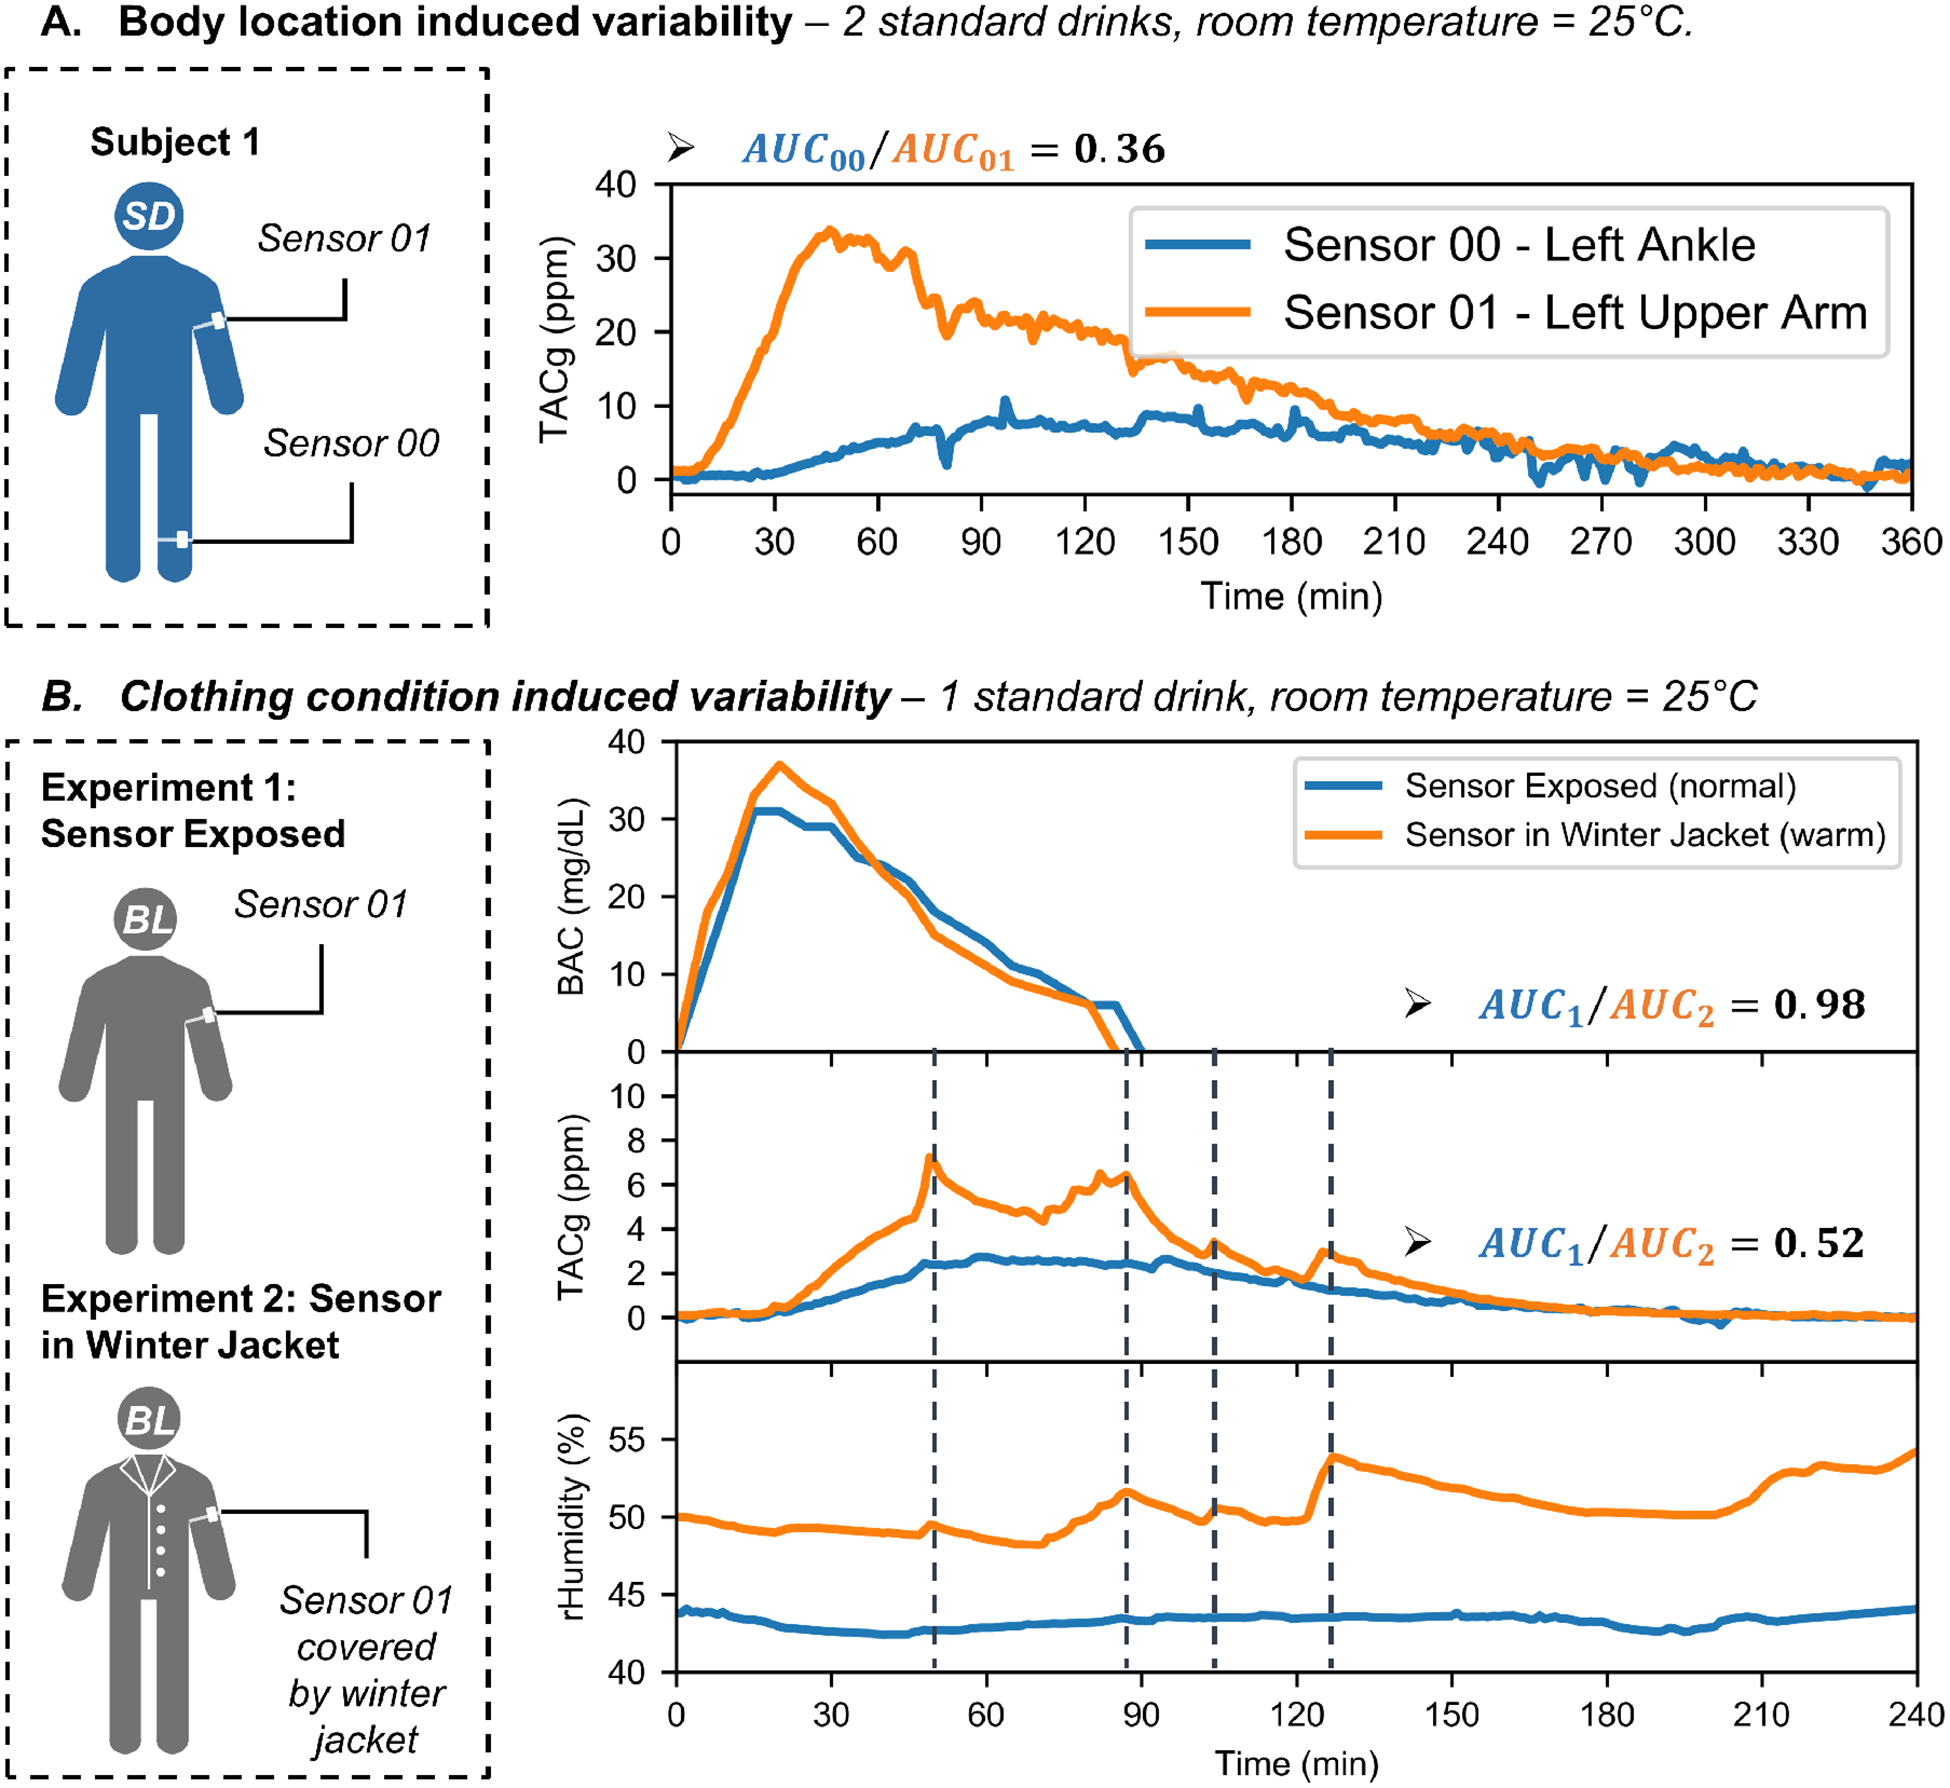
Intrapersonal variability of transdermal alcohol sensing. (A) Body location induced variability: two calibrated sensors attached to different parts of the body (left upper arm and left ankle) produced different results in a single drinking experiment. The TACg data obtained from the upper arm was significantly higher than that from the ankle. (B) Clothing condition induced variability: BAC and TACg results of two experiments conducted by a male subject consuming one standard drink each. In the first experiment, the subject was wearing a t-shirt. In the second, the subject was wearing winter jackets to induce sweat. The BAC curves agreed well with each other, while the TACg results showed significant difference. Whenever there is a humidity spike, a TACg spike was also observed (as marked by the dashed vertical lines).
Experimental results from effects of wearing layered-jacket are shown in Fig 5.B. We used the ratio between the areas under curves (AUCs) as a measurement to evaluate the BAC and TACg differences. The AUC ratio of the BAC was 0.98, while that of the TACg was 0.52. It was also found that during the second experiment, spikes in the TACg were aligned with the spikes in relative humidity (marked by vertical dashed lines). However, this association was no longer present at the end of the experiment, potentially because there was very little alcohol content in the perspiration.
C. Interpersonal Variability of TACg Measurements
Another observation is that TACg measurements from different subjects can be notably different while using the same sensor, sensor location, and amount of alcohol consumed. The comparison of experiments conducted by two male subjects after consuming one standard drink are shown in Fig 6). The AUC ratio of the BAC was 0.69, while the ratio of the TACg was 2.65. This implies that in these two experiments, subject 1 had a lower BAC levels but released more ethanol through skin. This contradiction may potentially be explained by the interpersonal differences in perspiration rates, as the relative humidity level from subject 1 was consistently higher than that from the subject 2. Further studies with sufficient number of subjects are required to test this hypothesis.
Fig. 6.
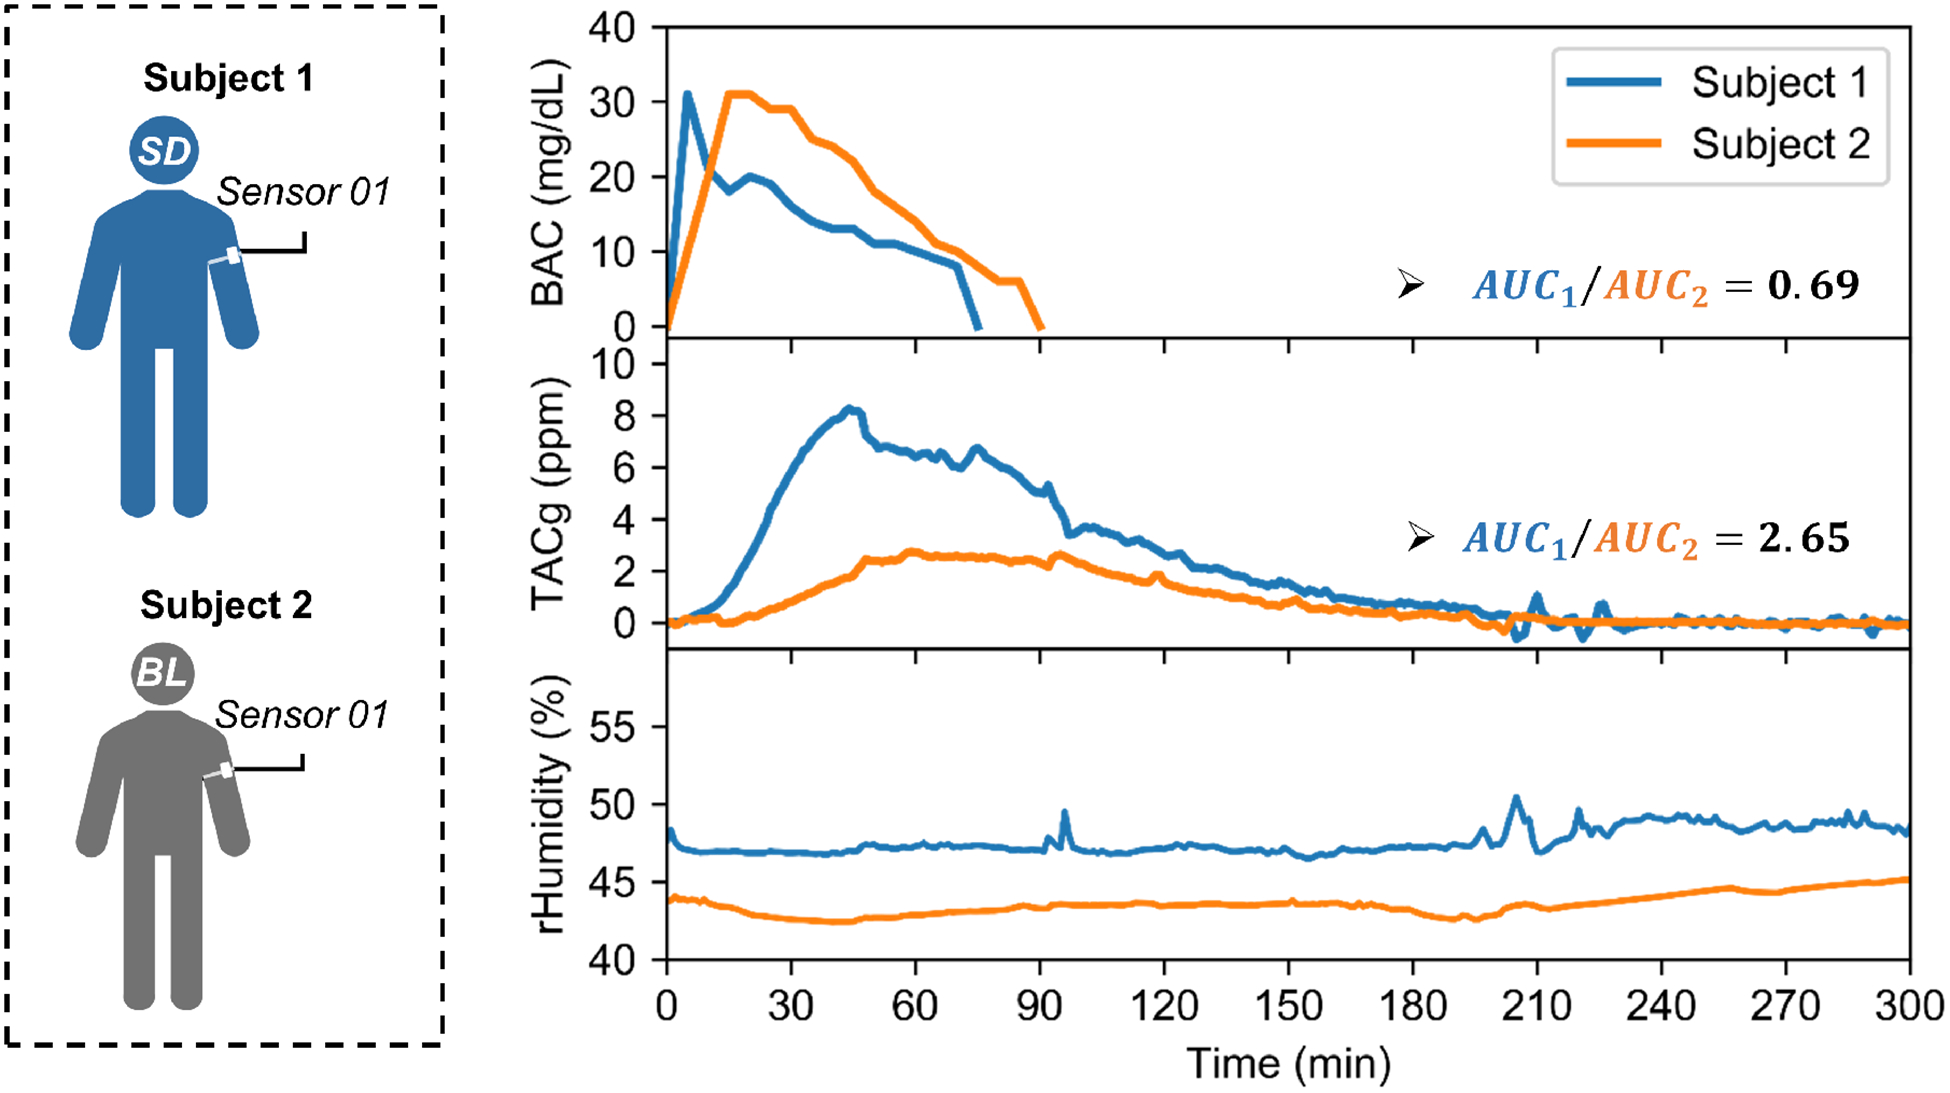
Interpersonal variability of transdermal alcohol sensing: two male subjects, each consuming one standard drink, with the same sensor attached to the same location on the body (left upper arm), under similar ambient conditions. The areas under curves (AUCs) ratio of BAC measurements were 0.69, while the AUCs ratio of TACg results were 2.65. The relative humidity data from subject 1 was also consistently higher than that from subject 2.
IV. Discussion
Our preliminary results demonstrated that the TACg sensors can monitor vapor-phase alcohol content released from skin under low doses (1–2 standard drinks). Meanwhile, the sensor also measures humidity and temperature above the skin. The alcohol measurements for different doses can be easily distinguished. However, under less controlled experimental conditions, both alcohol and humidity measurement data exhibited interpersonal and intrapersonal variabilities after the same doses of alcohol administration.
Arguably, one ultimate goal for personalized alcohol monitor development is to achieve a discreet non-invasive continuous sensor capable of measuring BAC levels in realtime. Despite continuing efforts, this goal remains elusive due to the daunting challenges in performing continuous blood measurements. TACg sensing offers a promising alternative by measuring alcohol content in evaporated sweat. However, advanced post data processing is required to convert TACg data into time series BAC curves, based on models of the underlying mass transport processes [21] [22] [23]. Accurately determining the model parameters and potential additional independent variables (e.g. humidity, ambient alcohol content, sweating rate, etc.) will lead to more accurate BAC results.
A. Effect of the Perspiration Rate
In one alcohol administration experiment (Fig 5.B), it was observed that the spikes in TACg data coincided with spikes in relative humidity. Since the studies were conducted in a climate-controlled environment, the most likely source for local humidity change is perspiration. Thus, we suspected that the changes in perspiration rate may be a significant contributing factor to sensor variability in this situation.
As fuel cell sensors operate by consuming vapor-phase ethanol molecules to generate electrical current, an increase in the ethanol gas concentration in the cell’s vicinity will lead to higher sensor readings. However, being the source of TACg generation, the overall perspiration rate of an individual can change dramatically, ranging from 20.8 mL/hr to 1.8 L/hr [24] [25] [26]. Before reaching Henry’s law equilibrium, such variation will result in very different gas concentrations in the sensing chamber for the same alcohol content in liquid sweat.
We believe that left uncompensated, other TAC sensors employing similar sensing mechanisms will also be susceptible to changes in perspiration rates. This may have partially contributed to the variabilities and errors reported in previous studies using SCRAM TAC sensors [27] [28].
However, given the experimental design and small sample sizes, we cannot rule out other possible influencing factors (e.g. accumulation of sweat within the jackets) or characterize the impact of sweating rates. Further alcohol administration studies under consistent clothing conditions should be conducted with sufficient sample sizes to evaluate the impact of perspiration rates. Researchers have demonstrated continuous quantification of perspiration rate using multiple humidity sensors [29] [30].
B. Limitations and potential confounding factors
Gas leakage is almost unavoidable in our design, due to the challenges in sealing between the sensor and skin. Therefore, ambient alcohol could affect the sensor readings, such as vapors released from cleaners, hand sanitizers, perfumes, etc. One potential improvement is to add a flexible rubber gasket between the sensor and the skin to form a better seal. Another option is to add a second fuel cell sensor to monitor alcohol concentration in ambient environment and perform post data analysis to estimate the actual alcohol content produced by the body.
Interfering gases (e.g. methanol, aldehydes, etc.) presented in the ambient environment can affect the fuel cell sensor readings. This is a general issue for most wearable TAC sensors. The common interfering gases and their cross sensitivities for the fuel cell sensor used in this work are provided in supplementary information (SI.2). Incorporating multiple alcohol sensing modalities and combining contextual information will be helpful to increase the sensor specificity.
Temperature is another important factor to consider. In lab settings, the ambient temperature is relatively stable. However, temperature fluctuations in less controlled environments will change the skin temperature, which will subsequently affect both baseline of the fuel cell sensor and evaporation rate of ethanol. These temperature effects need to be analyzed and characterized for real-world applications.
C. TACg-to-BAC conversion
Due to the variabilities observed, the conversion factor between TACg and TAC level in sweat was not established. A mathematical model considering ethanol evaporation and diffusion is needed to transform TACg to TAC data. Previous literature has demonstrated using TAC sensors allows the detection of low-level drinking, such as distinguishing 1–3 standard drinks in clinical and research settings [31] [32] [33]. In other studies, researchers have developed mathematical models to estimate BAC curves from TAC data [21] [22] [23], given all contributing factors affecting BAC-to-TAC transformation can be determined. Another approach is to use machine learning techniques, which can apply nonparametric algorithms to estimate BAC values from TAC measurements [34] [35].
V. Conclusions
In this work, we designed and implemented a wearable IoT sensor system for continuous transdermal alcohol monitoring. Wearable sensor prototypes were fabricated and characterized in a laboratory environment and validated by human subject studies with alcohol consumption in lab settings.
We demonstrated that it is feasible to acquire continuous TACg data using our system. Results from six trials in one human subject showed that different doses of alcohol consumption can be clearly distinguished using AUCs of TACg data. However, interpersonal and intrapersonal sensor variabilities were observed in several comparative experiments. In one drinking test, it was observed that the spikes in TACg data coincided with spikes in relative humidity. Further studies are required to validate and characterize the impact of perspiration rates. Other factors like clothing conditions, skin temperature, sensor placement also require further studies.
Supplementary Material
Acknowledgments
Research reported in this publication was supported by the National Institute on Alcohol Abuse and Alcoholism of the National Institutes of Health under Award Number 1R41AA02464801. The content is solely the responsibility of the authors and does not necessarily represent the official views of the National Institutes of Health. The authors also thank Dr. Walter King for helpful discussions on the fuel cell sensor technologies.
Biography

Baichen Li was born in Shenzhen, China. He received a B.S. degree in electronic and information engineering and an M.S. degree in electrical and electronic engineering from The Hong Kong Polytechnic University and The University of Hong Kong, respectively. He completed his second master’s degree in biomedical engineering at The George Washington University (GWU) in 2013. Afterwards, he worked in a medical device startup as an electrical engineer before he returned to GWU to pursue a Ph.D. degree in 2015.
Currently, he is a PhD candidate in the Nanophotonics and Microfluidics Lab at GWU (Washington, DC), with research focuses in low-power wearable sensors and microfluidic-based point-of-care diagnostic tools. His research interests include wearable sensors, point-of-care diagnostics, microfluidics, system integration, and rapid prototyping and manufacturing technologies.
Contributor Information
Baichen Li, Department of Biomedical Engineering, George Washington University, Washington, DC, 20052 USA.
R. Scott Downen, Department of Biomedical Engineering, George Washington University, Washington, DC, 20052 USA.
Quan Dong, Department of Biomedical Engineering, George Washington University, Washington, DC, 20052 USA.
Nam Tran, Department of Biomedical Engineering, George Washington University, Washington, DC, 20052 USA.
Maxine LeSaux, Department of Emergency Medicine, George Washington University, Washington, DC, 20052 USA..
Andrew C. Meltzer, Department of Emergency Medicine, George Washington University, Washington, DC, 20052 USA.
Zhenyu Li, Department of Biomedical Engineering, George Washington University, Washington, DC, 20052 USA..
References
- [1].Sacks JJ, Gonzales KR, Bouchery EE, Tomedi LE, and Brewer RD, “2010 national and state costs of excessive alcohol consumption,” American journal of preventive medicine, vol. 49, no. 5, pp. e73–e79, 2015. [DOI] [PubMed] [Google Scholar]
- [2].Harper C, “The neurotoxicity of alcohol,” Human & experimental toxicology, vol. 26, no. 3, pp. 251–257, 2007. [DOI] [PubMed] [Google Scholar]
- [3].Organization WH, Global status report on alcohol and health 2018. World Health Organization, 2019. [Google Scholar]
- [4].Rehm J, Baliunas D, Borges GL, Graham K, Irving H, Kehoe T, Parry CD, Patra J, Popova S, Poznyak V et al. , “The relation between different dimensions of alcohol consumption and burden of disease: an overview,” Addiction, vol. 105, no. 5, pp. 817–843, 2010. [DOI] [PMC free article] [PubMed] [Google Scholar]
- [5].McHugh RK, Sugarman DE, Kaufman JS, Park S, Weiss RD, and Greenfield SF, “Readability of self-report alcohol misuse measures,” Journal of studies on alcohol and drugs, vol. 75, no. 2, pp. 328–334, 2014. [DOI] [PMC free article] [PubMed] [Google Scholar]
- [6].Simons JS, Wills TA, Emery NN, and Marks RM, “Quantifying alcohol consumption: Self-report, transdermal assessment, and prediction of dependence symptoms,” Addictive behaviors, vol. 50, pp. 205–212, 2015. [DOI] [PMC free article] [PubMed] [Google Scholar]
- [7].Devaux M and Sassi F, “Social disparities in hazardous alcohol use: self-report bias may lead to incorrect estimates,” The European Journal of Public Health, vol. 26, no. 1, pp. 129–134, 2016. [DOI] [PMC free article] [PubMed] [Google Scholar]
- [8].Nyman E and Palmlöv A, “The elimination of ethyl alcohol in sweat,” Skandinavisches Archiv Für Physiologie, vol. 74, no. 2, pp. 155–159, 1936. [Google Scholar]
- [9].Kim J, Jeerapan I, Imani S, Cho TN, Bandodkar A, Cinti S, Mercier PP, and Wang J, “Noninvasive alcohol monitoring using a wearable tattoo-based iontophoretic-biosensing system,” Acs Sensors, vol. 1, no. 8, pp. 1011–1019, 2016. [Google Scholar]
- [10].Chung M, Fortunato G, and Radacsi N, “Wearable flexible sweat sensors for healthcare monitoring: a review,” Journal of the Royal Society Interface, vol. 16, no. 159, p. 20190217, 2019. [DOI] [PMC free article] [PubMed] [Google Scholar]
- [11].Li B, Dong Q, Downen RS, Tran N, Jackson JH, Pillai D,Zaghloul M, and Li Z, “A wearable iot aldehyde sensor for pediatric asthma research and management,” Sensors and Actuators B: Chemical, vol. 287, pp. 584–594, 2019. [DOI] [PMC free article] [PubMed] [Google Scholar]
- [12].Rightmire R, Rowland R, Boos D, and Beals D, “Ethyl alcohol oxidation at platinum electrodes,” Journal of the electrochemical society, vol. 111, no. 2, p. 242, 1964. [Google Scholar]
- [13].Kuzume A, Herrero E, and Feliu JM, “Oxygen reduction on stepped platinum surfaces in acidic media,” Journal of electroanalytical chemistry, vol. 599, no. 2, pp. 333–343, 2007. [Google Scholar]
- [14].Sander R, “Compilation of henry’s law constants (version 4.0) for water as solvent,” Atmos. Chem. Phys, vol. 15, no. 8, pp. 4399–4981, 2015. [Google Scholar]
- [15].Popoola OA, Stewart GB, Mead MI, and Jones RL, “Development of a baseline-temperature correction methodology for electrochemical sensors and its implications for long-term stability,” Atmospheric Environment, vol. 147, pp. 330–343, 2016. [Google Scholar]
- [16].Swift RM, Martin CS, Swette L, LaConti A, and Kackley N, “Studies on a wearable, electronic, transdermal alcohol sensor,” Alcoholism: Clinical and Experimental Research, vol. 16, no. 4, pp. 721–725, 1992. [DOI] [PubMed] [Google Scholar]
- [17].Karns-Wright TE, Roache JD, Hill-Kapturczak N, Liang Y,Mullen J, and Dougherty DM, “Time delays in transdermal alcohol concentrations relative to breath alcohol concentrations,” Alcohol and alcoholism, vol. 52, no. 1, pp. 35–41, 2017. [DOI] [PMC free article] [PubMed] [Google Scholar]
- [18].Caddy GR, Sobell MB, and Sobell LC, “Alcohol breath tests: Criterion times for avoiding contamination by “mouth alcohol”,” Behavior Research Methods & Instrumentation, vol. 10, no. 6, pp. 814–818, 1978. [Google Scholar]
- [19].Sakai JT, Mikulich-Gilbertson SK, Long RJ, and Crowley TJ, “Validity of transdermal alcohol monitoring: fixed and self-regulated dosing,” Alcoholism: Clinical and experimental research, vol. 30, no. 1, pp. 26–33, 2006. [DOI] [PubMed] [Google Scholar]
- [20].Barnett NP, Tidey J, Murphy JG, Swift R, and Colby SM, “Contingency management for alcohol use reduction: a pilot study using a transdermal alcohol sensor,” Drug and alcohol dependence, vol. 118, no. 2–3, pp. 391–399, 2011. [DOI] [PMC free article] [PubMed] [Google Scholar]
- [21].Dumett MA, Rosen IG, Sabat J, Shaman A, Tempelman L,Wang C, and Swift R, “Deconvolving an estimate of breath measured blood alcohol concentration from biosensor collected transdermal ethanol data,” Applied mathematics and computation, vol. 196, no. 2, pp. 724–743, 2008. [DOI] [PMC free article] [PubMed] [Google Scholar]
- [22].Zheng Dai I, Wang C, Barnett N, and Luczak SE, “Using drinking data and pharmacokinetic modeling to calibrate transport model and blind deconvolution based data analysis software for transdermal alcohol biosensors,” Mathematical biosciences and engineering: MBE, vol. 13, no. 5, p. 911, 2016. [DOI] [PMC free article] [PubMed] [Google Scholar]
- [23].Sirlanci M, Luczak SE, Fairbairn CE, Kang D, Pan R, Yu X, and Rosen IG, “Estimating the distribution of random parameters in a diffusion equation forward model for a transdermal alcohol biosensor,” Automatica, vol. 106, pp. 101–109, 2019. [DOI] [PMC free article] [PubMed] [Google Scholar]
- [24].Burch GE and Winsor T, “Rate of insensible perspiration (diffusion of water) locally through living and through dead human skin,” Archives of Internal Medicine, vol. 74, no. 6, pp. 437–444, 1944. [Google Scholar]
- [25].Van Beaumont W and Bullard RW, “Sweating: its rapid response to muscular work,” Science, vol. 141, no. 3581, pp. 643–646, 1963. [DOI] [PubMed] [Google Scholar]
- [26].Saladin KS, Anatomy & physiology: the unity of form and function. McGraw-Hill Higher Education, 2004. [Google Scholar]
- [27].Marques PR, McKnight AS et al. , “Evaluating transdermal alcohol measuring devices,” United States. National Highway Traffic Safety Administration, Tech. Rep., 2007. [Google Scholar]
- [28].Marques PR and McKnight AS, “Field and laboratory alcohol detection with 2 types of transdermal devices,” Alcoholism: Clinical and Experimental Research, vol. 33, no. 4, pp. 703–711, 2009. [DOI] [PubMed] [Google Scholar]
- [29].Salvo P, Di Francesco F, Costanzo D, Ferrari C, Trivella MG, and De Rossi D, “A wearable sensor for measuring sweat rate,” IEEE Sensors Journal, vol. 10, no. 10, pp. 1557–1558, 2010. [Google Scholar]
- [30].Sim JK, Yoon S, and Cho Y-H, “Wearable sweat rate sensors for human thermal comfort monitoring,” Scientific reports, vol. 8, no. 1, pp. 1–11, 2018. [DOI] [PMC free article] [PubMed] [Google Scholar]
- [31].Roache JD, Karns TE, Hill-Kapturczak N, Mullen J, Liang Y, Lamb RJ, and Dougherty DM, “Using transdermal alcohol monitoring to detect low-level drinking,” Alcoholism: Clinical and Experimental Research, vol. 39, no. 7, pp. 1120–1127, 2015. [DOI] [PMC free article] [PubMed] [Google Scholar]
- [32].Roache JD, Karns-Wright TE, Goros M, Hill-Kapturczak N,Mathias CW, and Dougherty DM, “Processing transdermal alcohol concentration (tac) data to detect low-level drinking,” Alcohol, vol. 81, pp. 101–110, 2019. [DOI] [PMC free article] [PubMed] [Google Scholar]
- [33].Alessi SM, Barnett NP, and Petry NM, “Objective continuous monitoring of alcohol consumption for three months among alcohol use disorder treatment outpatients,” Alcohol, vol. 81, pp. 131–138, 2019. [DOI] [PMC free article] [PubMed] [Google Scholar]
- [34].Fairbairn CE and Kang D, “Temporal dynamics of transdermal alcohol concentration measured via new-generation wrist-worn biosensor,” Alcoholism: Clinical and Experimental Research, vol. 43, no. 10, pp. 2060–2069, 2019. [DOI] [PMC free article] [PubMed] [Google Scholar]
- [35].Fairbairn C, Kang D, and Bosch N, “Examining the validity of bac predictions from a new-generation transdermal alcohol biosensor in the laboratory,” 2020. [DOI] [PMC free article] [PubMed]
Associated Data
This section collects any data citations, data availability statements, or supplementary materials included in this article.


