Abstract
We evaluated a 16-channel loop + dipole (LD) transceiver antenna array with improved specific absorption rate (SAR) efficiency for 10.5 Tesla (T) human head imaging apsplications. Three different array designs with equal inner dimensions were considered: an 8-channel dipole antenna, an 8-channel loop, and a 16-channel LD antenna arrays. Signal-to-noise ratio (SNR) and B1 + efficiency (in units of μT per √W) were simulated and measured in 10.5 T magnetic resonance imaging (MRI) experiments. For the safety validation, 10 g SAR and SAR efficiency (defined as the B1 + over √ (peak 10 g SAR)) were calculated through simulation. Finally, high resolution porcine brain images were acquired with the 16-channel LD antenna array, including a fast turbo-spin echo (TSE) sequence incorporating B1 shimming techniques. Both the simulation and experiments demonstrated that the combined 16-channel LD antenna array showed similar B1 + efficiency compared to the 8-channel dipole antenna and the 8-channel loop arrays in a circular polarized (CP) mode. In a central 2 mm × 2 mm region of the phantom, however, the 16-channel LD antenna array showed an improvement in peak 10 g SAR of 27.5 % and 32.5 % over the 8-channel dipole antenna and the 8-channel loop arrays, respectively. We conclude that the proposed 16-channel head LD antenna array design is capable of achieving ~7% higher SAR efficiency at 10.5 T compared to either the 8-channel loop-only or the 8-channel dipole-only antenna arrays of the same dimensions.
Keywords: dipole antenna array, human head array, loop array, magnetic resonance imaging, RF coil, ultra-high field
I. INTRODUCTION
Noninvasive exploration of the human body using magnetic resonance imaging (MRI) benefits from ultra-high field (UHF) systems, which are capable of achieving higher signal-to-noise ratios (SNR) than the systems widely used within the current clinical market [1–6]. Numerous new applications for human brain imaging have been developed for UHF [7–9]. However, the short wavelength in the human body at such frequencies contributes to a significantly non-uniform field distribution [10–12]. Upon expanding the highest MR field strength from 4 tesla (T) [13] to 7 T [5], [12] then to 10.5 T [14], [15], it became apparent that more control over the transmit field was required to achieve acceptable imaging uniformity in the human body. Considering an average relative permittivity (εr) of 50 for water dominated tissue types at UHF for 10.5 T proton based imaging, the resulting shortened wavelength (~95 mm) leads to the type of non-uniform field distribution in the head at 10.5 T previously experienced in the torso at 7 T [16], [17].
Loop [18], [19] and stripline [20], [21] transmit arrays have been the dominant element types for lower field MRI (< 7 T). At 7 T and above, however, dipole type antennas, which were suggested by Raaijmakers et al., can be more efficient for UHF arrays compared to loop and stripline arrays [22]. Dipole antennas have been shown to produce more uniform B1 + field patterns and achieve better penetration depth compared to either loop or stripline type arrays at UHF [23–26]. Thus, the advantages of dipole antennas for UHF have been studied extensively and demonstrated both in theory [27], [28], and practice [22], [29], [30]. However, dipole antennas face greater challenges in minimizing the mutual coupling between neighboring elements.
In this work, we propose the concept of a loop + dipole (LD) antenna array that combines the structure of loops and dipoles in each element. To increase the number of array elements, this combined structure has been suggested for UHF utilizing the complimentary decoupled fields produced by loops and dipole antennas [16], [31], [32]. From 7 T human torso imaging by Erturk et al., a LD antenna array was compared favorably to either individual loop or dipole antenna arrays. To investigate potential benefits, such as improvement of SAR efficiency for human head imaging at 10.5 T, we built an 8-channel dipole antenna, an 8-channel loop, and a 16-channel combined LD antenna arrays, all with the same inner dimensions and the same overall spacing between individual elements. To evaluate the correlation among elements, scattering (S) parameters of all three arrays were measured and compared with a phantom on the bench and noise covariance maps were acquired with a 10.5 T MRI scanner. Then the intrinsic SNR (iSNR) and B1 + efficiency (defined as B1 amplitude per unit square root total power) of all arrays were simulated and compared to MR experiments at 10.5 T. For the safety validation, 10 g SAR and SAR efficiency (defined as (B1 + over √ (peak SAR 10 g))) of all arrays were calculated for each array type. Finally, we obtained high resolution turbo spin echo (TSE) images of an in vivo porcine brain with the 16-channel LD antenna array incorporating B1 shimming to explore the image quality.
II. METHODS
A. COIL DESIGN AND BENCH MEASUREMENTS
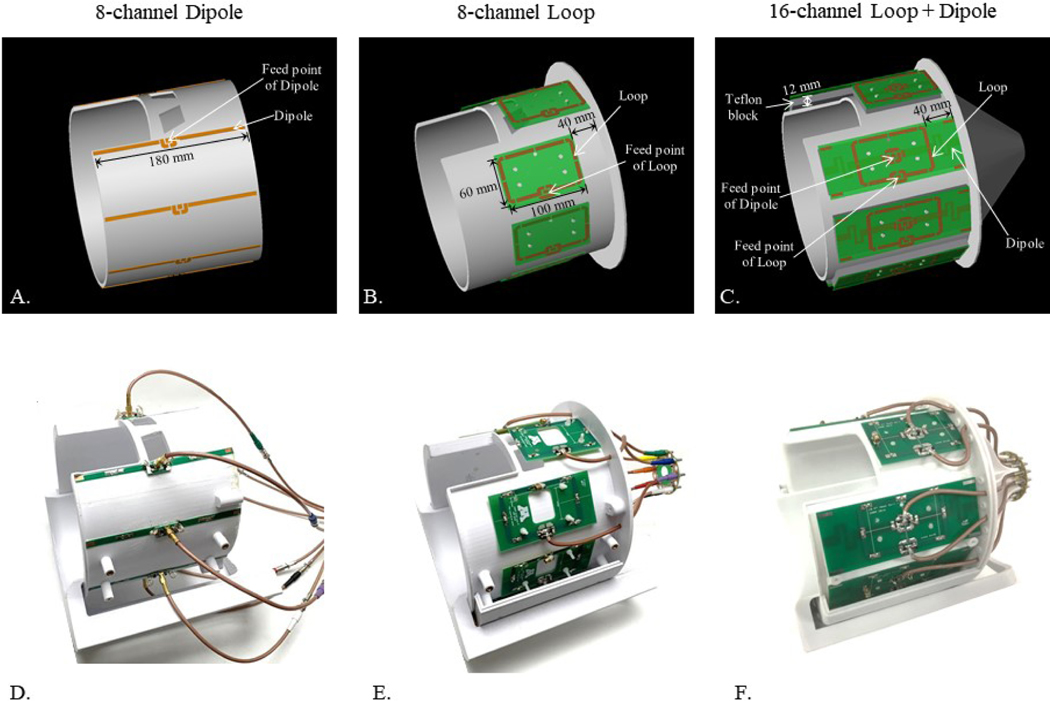
Three different types of coil arrays were built onto similar head support frames, all with the same inner elliptical cross-section dimensions (200 mm × 220 mm). The head support frames, shown in Fig. 1, were fabricated using a 3D printer (F410, Fusion3 Design, Greensboro, NC, USA). The individual formers were made of polyethylene terephthalate glycol-modified (PETG) materials. All arrays had a similar gap (88 mm ± 14 mm) between individual elements. In other words, sets of eight loops and eight fractionated dipole antennas [33] were mounted for the 16-channel LD antenna array. All elements of the 8-channel dipole antenna and the 8-channel loop arrays were mounted directly on the 3D printed elliptical housing frame (Thickness 4 mm). For the 16-channel LD antenna array, eight 12 mm thick Teflon bars were placed between each individual LD element and the former. The addition of the Teflon bars moved the elements of the 16-channel LD antenna array (outer diameter: 232 mm × 252 mm) further from the load compared to both the 8-channel dipole antenna and the 8-channel loop arrays (outer diameter: 208 mm × 228 mm). As shown in Fig. 1b and 1c on the anterior side, one element of the 8-channel loop array and one set (one pair of a loop and a dipole antenna) of the 16-channel LD antenna array was shifted upwards by 40 mm compared to the other seven elements and sets, respectively.
FIGURE 1.
3D drawing (a-c) and corresponding photographs (d-f) of an 8-channel dipole antenna, an 8-channel loop, and a 16-channel LD antenna arrays.
The 16-channel LD antenna array was configured with loops and dipole antennas printed on opposite sides of the same FR4 boards (Advanced circuits, Maple Grove, MN, USA). The same loop size (60 mm × 100 mm) and material was chosen for the 8-channel loop and the 16-channel LD antenna arrays to allow direct comparisons between antenna types. Fractionated dipole antennas [33] were used for the 16-channel LD antenna array, while straight dipole antennas were used for the 8-channel dipole antenna array. Tuning inductors were used to reduce the physical length of the dipole antenna to 180 mm for both the 8-channel dipole and the 16-channel LD antenna arrays, respectively. Furthermore, the anterior dipole element of the 16-channel LD antenna array was shortened to a total length of 100 mm with tuning inductors positioned at the feed point. Fine tuning of all dipole type antennas was performed with slight modifications in the feed point inductors. The loops were tuned with four 4.7 pF, two 5.1 pF ceramic capacitors (100B series, American Technical Ceramics, Huntington Station, NY, USA) and one variable capacitor (JZ200HV, Knowles Voltronics, Cazenovia, NY, USA). A lattice balun with two 10 pF ceramic capacitors and two 12.5 nH inductors (A04T_L, Coilcraft, Coilcraft Inc., Cary, IL, USA) was used for all matching networks of all three arrays at 447 MHz.
S-parameters of all arrays were measured on the bench using a 16-channel network analyzer (ZNBT8, Rohde & Schwarz, Munich, Germany). Input reflection and coupling coefficients are shown in Table 1. For realistic loading conditions reflecting that of a human head and neck, these values were measured while the arrays were loaded with a human head shaped spherical phantom with short neck structure [34]. This human head shaped phantom (diameter: 150 mm and height: 180 mm) was filled with a PVP-agar gel mixture with known electrical properties (conductivity (σ) of 0.69 S/m and relative permittivity (εr) of 49). For the reference of isocenter in the phantom, a small cylinder (diameter: 30 mm and height: 50 mm) filled with oil (σ: 0.32 S/m and εr: 2.8) was inserted from the end (neck side) of the phantom. Dielectric parameters were measured with a DAKS-12 coaxial dielectric probe (SPEAG AG, Zurich, Switzerland) at 447 MHz.
TABLE 1.
S11 (reflection coefficient) and S21 (coupling coefficient) between the adjacent elements of the 8-channel dipole antenna, the 8-channel loop, and the 16-channel LD antenna arrays in dB scale. Note that none of the arrays have any additional decoupling circuitry and consequently show relative higher coupling coefficient values
| S11(dB) (Reflection coefficient) | S21(dB)(Coupling coefficient between adjacent) | |||||
|---|---|---|---|---|---|---|
| Min | Max | Mean | Min | Max | Mean | |
| 8-channel Dipole | −36.5 | −12.5 | −22.2 | −19.6 | −13.9 | −16.6 |
| Dipole to Dipole | ||||||
| 8-channel Loop | −22.1 | −15.1 | −16.5 | −16.0 | −9.5 | −11.8 |
| Loop to Loop | ||||||
| 16-channel Loop + Dipole | −24.1 | −12.0 | −15.4 | −24.0 | −12.0 | −13.7 |
| Loop to Loop | ||||||
| −16.2 | −8.2 | −10.4 | ||||
| Loop to Dipole | ||||||
| −24.1 | −18.5 | −21.4 | ||||
| Dipole to Dipole | ||||||
B. EXPERIMENTAL SETUP
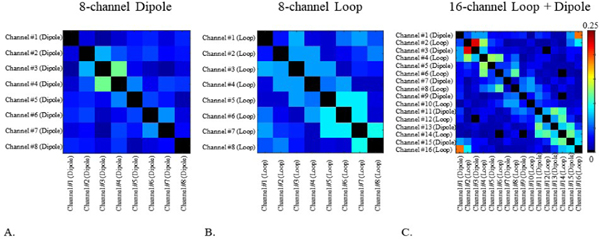
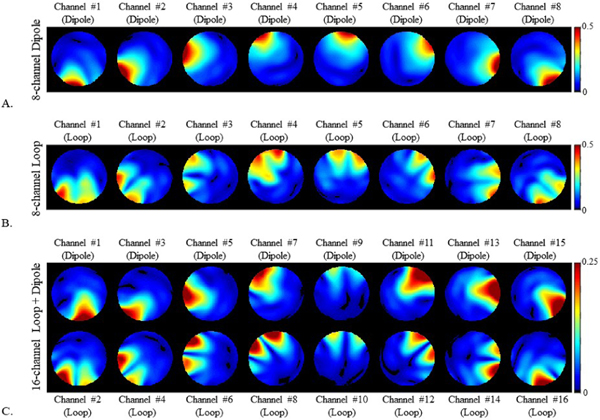
A 10.5 T magnet with an 88 cm free bore diameter (Agilent, Santa Clara, CA, USA) was used in conjunction with a whole body gradient coil (Siemens, Erlangen, Germany). The 16-channel full parallel transmit console (Siemens Healthineers, Erlangen, Germany) was equipped with sixteen power amplifiers, providing 2 KW peak power per channel. All data presented were acquired with equal RF transmit power per channel with a custom built in-bore 16-channel transmit/receive interface. Noise covariance matrices of all arrays were obtained to evaluate crosstalk between all elements experimentally, as shown in Fig. 2 [35]. Fig. 3 displays relative transmit field maps (B1 + profiles) of individual elements in the phantom for all arrays, obtained using an actual flip angle imaging (AFI) sequence (TR1/TR2 = 25/115 ms, TE = 3.39 ms, nominal flip angle = 60°, GRAPPA (R=2) and resolution = 2 mm × 4 mm × 6 mm) [36]. The flip angle (α) with short TR1 and TR2 was calculated and converted to B + [37]. A gradient echo (GRE) sequence (TR = 4000 ms, TE = 3.00 ms, TA = 7:48 ms, nominal flip angle = 60°, FOV = 354 × 354 and resolution = 3.0 mm × 1.5 mm × 3 mm) was obtained to calculate the iSNR (Fig. 4) with the human head shaped phantom at the isocenter of the magnet.
FIGURE 2.
Noise covariance matrices of the 8-channel dipole antenna (a), the 8-channel loop (b), and the 16-channel LD antenna (c) arrays. The color bar represents the noise covariance coefficient
FIGURE 3.
Relative individual transmit fields of the 8-channel dipole antenna (a), the 8-channel loop (b), and the 16-channel LD antenna (c) arrays. These figures show relative percentage contribution of each transmitter on each pixel.
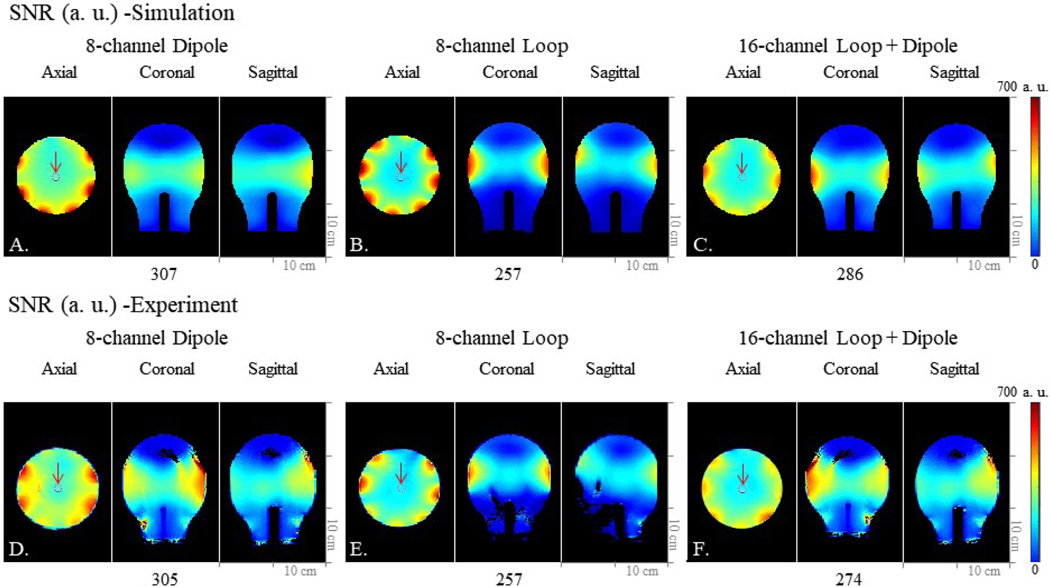
FIGURE 4.
Simulation (a-c) and experimental (d-f) SNR maps of the 8-channel dipole antenna, the 8-channel loop, and the 16-channel LD antenna arrays. Simulation data set of the 8-channel dipole antenna (a), the 8-channel loop (b), and the 16-channel LD antenna (c) arrays in the axial, coronal, and sagittal planes. Experimental data set of the 8-channel dipole antenna (d), the 8-channel loop (e), and the 16-channel LD antenna (f) arrays in the axial, coronal, and sagittal planes. Red arrows indicate ROIs where values are measured and compared.
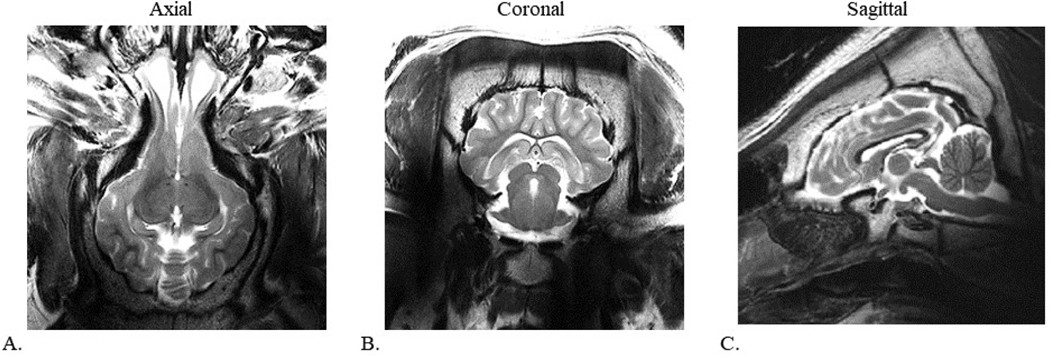
High resolution turbo spin echo (TSE) images with TR = 5000 ms, TE = 72 ms, TA = 3:45 and BW = 488 Hz/pixel were obtained with in-vivo porcine. The resolution of these images was 0.75 mm × 0.75 mm × 2 mm in the axial, coronal, and sagittal planes.
C. SIMULATION AND NUMERICAL ANALYSIS
All electromagnetic simulations were performed using a commercial computational EM simulation software (XFdtd, REMCOM, State College, PA, USA) using a phantom with the dimensions and contents as previously described. All data were calculated utilizing MATLAB (The Mathworks, Inc., Natick, MA, USA) after EM simulation and experiments. In Fig. 4, iSNR was calculated using B1 - fields of the 8-channel dipole antenna, the 8-channel loop, and the 16-channel LD antenna arrays both with simulation (Fig. 4a-c) and experiments (Fig. 4d-f) in the phantom [38], [39]. The iSNR maps were calculated from proton density-weighted images divided by the flip angle maps, divided by the measured noise; the noise was obtained using no-RF pulses.
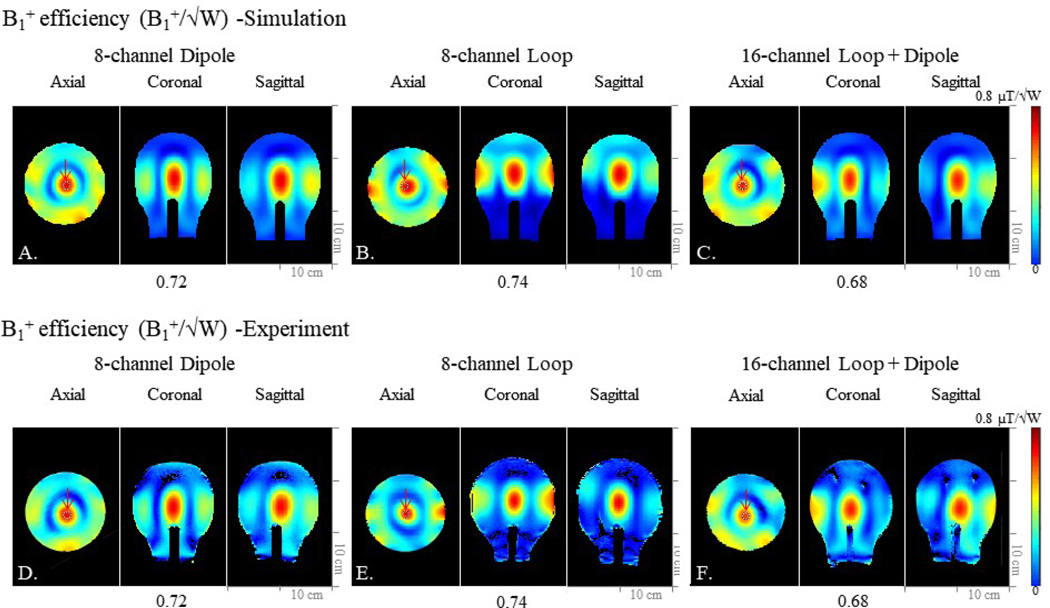
To evaluate the B1 + efficiency (B1 + /√W), the B1 + fields with a circularly polarized (CP) shimmed mode were normalized to 1 W, both in simulations and experiments. Simulated (Fig. 5a-c) and experimental (Fig. 5d-f) B1 + efficiency of the 8-channel dipole antenna, the 8-channel loop, and the 16-channel LD antenna arrays are shown. 10 g SAR values and SAR efficiency (B1 + /√ (peak SAR 10 g)) values were calculated. A centrally located 2mm by 2mm region of interest (ROI) was chosen in the axial plane, as indicated by red arrows in Figs. 4 and 5. A comparison of B1 + efficiency, 10 g SAR, SAR efficiency, and iSNR is summarized in Table 2.
FIGURE 5.
Simulation (a-c) and experimental (d-f) B1 + efficiency (B1 +/√W) maps of the 8-channel dipole antenna, the 8-channel loop, and the 16-channel LD antenna arrays. Simulation data set of the 8-channel dipole antenna (a), the 8-channel loop (b), and the 16-channel LD antenna (c) arrays in the axial, coronal, and sagittal planes. Experimental data set of the 8-channel dipole antenna (d), the 8-channel loop (e), and the 16-channel LD antenna (f) arrays in the axial, coronal, and sagittal planes. Red arrows indicate ROIs where values are measured and compared.
TABLE 2.
Quantitative comparison of B1+ efficiency (simulation and experiments), 10 g SAR, SAR efficiency, and SNR (simulation and experiments) among the 8-channel dipole antenna, the 8-channel loop, and the16-channel LD antenna arrays with phantom in the ROI marked for the highest value.
| 8-channel Dipole | 8-channel Loop | 16-channel Loop + Dipole | |
|---|---|---|---|
| B1+ efficiency (μT/√w) -Simulation | 0.72 | 0.73 | 0.68 |
| B1+ efficiency (μT/√w) -Experiment | 0.72 | 0.73 | 0.68 |
| Peak 10g SAR (W/kg) | 0.51 | 0.52 | 0.4 |
| SAR efficiency (μT/√w/√kg) | 1.00 | 1.01 | 1.08 |
| SNR (A.U.) -Simulation | 307 | 257 | 286 |
| SNR (A.U.) -Experiment | 305 | 257 | 274 |
III. RESULTS
Table 1 indicates a similar range of S11 values for all three arrays, −12.5 dB to −36.5 dB for the 8-channel dipole antenna array, −15.1 dB to −22.1 dB for the 8-channel loop array, and −12 dB to −24.1 dB for the 16-channel LD antenna array. Due to the increased number of elements, the 16-channel LD antenna array shows relatively higher S21 coupling values (−8.2 dB to −24.1 dB) compared to both the 8-channel dipole antenna (−13.9 dB to −19.6 dB) and the 8-channel loop (−9.5 dB to −16 dB) arrays. As indicated in Fig. 2, the noise covariance of the 16-channel LD antenna array also shows higher coupling to neighboring elements among the channels compared to the 8-channel dipole antenna and the 8-channel loop arrays. The maximum correlation value was 0.11 for both the 8-channel dipole antenna and the 8-channel loop arrays. For the 16-channel LD antenna array, the noise covariance among the elements was increased - but still an acceptable value (0.25) was achieved.
Fig. 3 shows transmit field patterns of individual elements in the arrays. The patterns indicate that individual elements were able to generate acceptable B1 + in all arrays. An individual relative B1 + magnitude map is the total magnitude of each individual transmitter divided by the magnitude sum of the magnitude of all sixteen individual transmitter maps. Channel #8 (loop) and #9 (dipole antenna) of the 16-channel LD antenna array were located 40 mm higher up compared to the other elements. Hence, the loop and the dipole antenna (channel #8 and #9) showed relatively lower B1+ field contribution compared to the other elements of the 16-channel LD antenna array.
In Fig. 4, iSNR values were compared among the arrays both in the simulation and experiments. The central iSNR values of all arrays in the ROI located in the middle of the phantom were shown similarly in the simulation and the experiment. We measured that the 8-channel dipole antenna array shows ~7.4 % and ~15.2 % higher iSNR compared to the 8-channel loop and the 16-channel LD antenna arrays in the ROI, respectively.
In Fig. 5, simulated B1 + efficiency is shown to be consistent with experiment. Simulation and experiment with CP mode excitation shows that the highest B1 + efficiency values of all arrays are found in the ROI, which is located in the middle of the phantom. Red arrows indicate the ROI locations. In supplementary Fig. 1 and supplementary Table 1, similar B1 + efficiency values among all the arrays were observed in the ROIs of the human model (Duke) [40].
Table 2 summarizes the key values of the calculations and measurements from the simulation and the experimental results. Importantly, we observed lower peak 10 g SAR with the 16-channel LD antenna array (0.4 W/kg) than the 8-channel dipole antenna (0.51 W/kg) and the 8-channel loop (0.53 W/kg) arrays. As observed in Fig. 4, B1 + efficiency values among all arrays were similar. This indicates that the 16-chanel LD antenna array shows the highest SAR efficiency compared to the 8-channel dipole antenna and 8-channel loop arrays. The SAR efficiency of the 16-channel LD antenna array in the ROI of the phantom is ~7 % higher than the 8-channel dipole antenna and 8-channel loop arrays. Our 16 channel LD array may benefit from the increased distance of the array elements from the sample, which can improve SAR efficiency, as was recently demonstrated by Sadeghi-Tarakameh, et al [15]. Further supporting material is demonstrated in the supplementary Fig. 2, the 16-channel LD antenna array showed ~12 % higher SAR efficiency compared to the 8-channel dipole antenna and the 8-channel loop arrays with the human model.
Fig. 6 shows high resolution T2* weighted TSE images of an in vivo porcine brain obtained with the 16-channel LD antenna array. These images demonstrate remarkably uniform B1 field distribution with B1 shimming in the porcine brain.
FIGURE 6.
TSE images of the porcine brain with the 16-channel LD antenna array in the axial (a), coronal (b), and sagittal (c) planes. TR = 5000 ms, TE = 72 ms, TA = 3:45 and BW = 488 Hz/pixel, resolution = 0.75 mm × 0.75 mm × 2 mm.
IV. DISCUSSIONS
Overall, our results based on improvement of SAR efficiency indicate that the array structure of the 16-channel LD concept has the benefit of tighter spacing for head applications at 447 MHz without the need for decoupling circuitry. The 16-channel LD antenna array experienced relatively higher coupling (−8.2 dB) and correlation (0.25) compared to the 8-channel loop array and the 8-channel dipole antenna array. However, those are acceptable values to achieve individual field patterns of each elements of the 16-channel LD antenna array in Fig. 3.
All arrays performed consistently between simulation and experiment as shown in Fig. 4 and 5. In our simulation and experimental results at 447 MHz, the 16-channel LD antenna array does not show higher B + efficiency per se, but we do observed lower peak SAR values compared to both the 8-channel dipole antenna and the 8-channel loop arrays at 10.5 T. As a result, the 16-channel LD antenna array showed slightly improved SAR efficiency compared to both the 8-channel arrays. All three arrays have the same inner dimensions, however all elements of the 16-channel LD antenna array were placed further from the object, by the integration of the Teflon blocks, compared to the 8-channel loop and the 8-channel dipole antenna arrays. Hence, the SNR performance of the 16-channel LD antenna array does not show any significant improvement over the 8-channel arrays [27], [41]. However, the increased distance to the object leads to an improvement in safety (10 g SAR), furthermore, the 16-channel LD antenna array showed the advantage of SAR efficiency.
V. CONCLUSION
A 16-channel LD antenna combination array was developed for 10.5 T human brain imaging. This array is composed of 8 dipole antennas and 8 loops which are geometrically decoupled from each other. Based on performance evaluations using a human head shaped phantom, the 16-channel LD antenna array showed higher SAR efficiency compared to 8-channel dipole antenna and 8-channel loop arrays, both in simulation and experiment. The use of additional decoupling circuitry for both the dipole antenna and loop elements will be evaluated in future work aimed at achieving better decoupling performance.
The longitudinal dimensions and overall straight arrangement of antenna elements in this initial work, supported a careful comparison, but did not provide ideal coverage in the superior parts of the phantom and head. To improve on this, future work will evaluate array element arrangements that conform to the shape of a human head. We also plan to introduce additional decoupling circuitry that would allow for tighter spaced 16-channel loop and dipole antenna arrays. We will also conduct human brain imaging with this array under FDA guidelines.
Supplementary Material
Acknowledgments
This work was supported in part by the U.S. Department of National Institutes of Health under Grants U01-EB025144, S10-RR029672, P41-EB015894, P41-EB027061, and P30-NS076408
REFERENCES
- [1].Bandettini PA, Bowtell R, Jezzard P, and Turner R, “Ultrahigh field systems and applications at 7 T and beyond: Progress, pitfalls, and potential,” Magn Reson Med, vol. 67, no. 2, pp. 317–321, February, 2012. [DOI] [PMC free article] [PubMed] [Google Scholar]
- [2].Pohmann R, Speck O, and Scheffler K, “Signal-to-noise ratio and MR tissue parameters in human brain imaging at 3, 7, and 9.4 tesla using current receive coil arrays,” Magn Reson Med, vol. 75, no. 2, pp. 801–809, 2016. [DOI] [PubMed] [Google Scholar]
- [3].Uğurbil K, “Magnetic resonance imaging at ultrahigh fields,” IEEE Trans Biomed Eng, vol. 61, no. 5, pp. 1364–1379, 2014. [DOI] [PMC free article] [PubMed] [Google Scholar]
- [4].Uğurbil K, “Imaging at ultrahigh magnetic fields: History, challenges, and solutions,” Neuroimage, vol. 168, pp. 7–32, 2018. [DOI] [PMC free article] [PubMed] [Google Scholar]
- [5].Vaughan T. et al. , “Whole-body imaging at 7T: preliminary results,” Magn Reson Med, vol. 61, no. 1, pp. 244–248, 2009. [DOI] [PMC free article] [PubMed] [Google Scholar]
- [6].Vaughan T. et al. , “9.4T human MRI: preliminary results,” Magn Reson Med, vol. 56, no. 6, pp. 1274–82, December, 2006. [DOI] [PMC free article] [PubMed] [Google Scholar]
- [7].Kang C, Woo MK, Hong SM, Kim YB, and Cho ZH, “Intracranial microvascular imaging at 7 T MRI with transceiver RF coils,” Magn Reson Imag, vol. 32, no. 9, pp. 1133–1138, 2014. [DOI] [PubMed] [Google Scholar]
- [8].Koopmans PJ, Barth M, Orzada S, and Norris DG, “Multi-echo fMRI of the cortical laminae in humans at 7 T,” Neuroimage, vol. 56, no. 3, pp. 1276–1285, June 1, 2011. [DOI] [PubMed] [Google Scholar]
- [9].Moser E, Stahlberg F, Ladd ME,, and Trattnig S, “7-T MR—from research to clinical applications?,” NMR Biomed, vol. 25, no. 5, pp. 695–716, 2012. [DOI] [PubMed] [Google Scholar]
- [10].Cao Z, Park J, Cho ZH, and Collins CM, “Numerical evaluation of image homogeneity, signal-to-noise ratio, and specific absorption rate for human brain imaging at 1.5, 3, 7, 10.5, and 14T in an 8-channel transmit/receive array,” J Magn Reson Med, vol. 41, no. 5, pp. 1432–1439, 2015. [DOI] [PMC free article] [PubMed] [Google Scholar]
- [11].Erturk MA et al. , “Toward imaging the body at 10.5 tesla,” Magn Reson Med, vol. 77, no. 1, pp. 434–443, January, 2017. [DOI] [PMC free article] [PubMed] [Google Scholar]
- [12].Vaughan JT et al. , “7T vs. 4T: RF power, homogeneity, and signal-to-noise comparison in head images,” Magn Reson Med, vol. 46, no. 1, pp. 24–30, 2001. [DOI] [PubMed] [Google Scholar]
- [13].Ogawa S. et al. , “Functional brain mapping by blood oxygenation level-dependent contrast magnetic resonance imaging. A comparison of signal characteristics with a biophysical model,” Biophysical journal, vol. 64, no. 3, pp. 803–812, 1993. [DOI] [PMC free article] [PubMed] [Google Scholar]
- [14].He X. et al. , “First in-vivo human imaging at 10.5 T: Imaging the body at 447 MHz,” Magn Reson Med, 2019. [DOI] [PMC free article] [PubMed] [Google Scholar]
- [15].Sadeghi-Tarakameh A. et al. , “In vivo human head MRI at 10.5 T: A radiofrequency safety study and preliminary imaging results,” Magn Reson Med, vol. 84, no. 1, pp. 484–496, 2020. [DOI] [PMC free article] [PubMed] [Google Scholar]
- [16].Ertürk MA, JE A. Raaijmakers G. Adriany K. Uğurbil, and Metzger GJ,, “A 16-channel combined loop-dipole transceiver array for 7 T esla body MRI,” Magn Reson Med, vol. 77, no. 2, pp. 884–894, 2017. [DOI] [PMC free article] [PubMed] [Google Scholar]
- [17].Metzger GJ, Snyder C, Akgun C, Vaughan T, Ugurbil K, and Van de Moortele PF, “Local B1+ shimming for prostate imaging with transceiver arrays at 7T based on subject-dependent transmit phase measurements,” Magn Reson Med, vol. 59, no. 2, pp. 396–409, 2008. [DOI] [PMC free article] [PubMed] [Google Scholar]
- [18].Avdievich NI et al. , “Evaluation of transmit efficiency and SAR for a tight fit transceiver human head phased array at 9.4 T,” Nmr in Biomedicine, vol. 30, no. 2, pp. e3680, February, 2017. [DOI] [PubMed] [Google Scholar]
- [19].Shajan G, Kozlov M, Hoffmann J, Turner R, Scheffler K, and Pohmann R, “A 16-channel dual-row transmit array in combination with a 31-element receive array for human brain imaging at 9.4 T,” Magn Reson Med, vol. 71, no. 2, pp. 870–879, 2014. [DOI] [PubMed] [Google Scholar]
- [20].Adriany G. et al. , “A 32-channel lattice transmission line array for parallel transmit and receive MRI at 7 tesla,” Magn Reson Med, vol. 63, no. 6, pp. 1478–1485, 2010. [DOI] [PMC free article] [PubMed] [Google Scholar]
- [21].Adriany G. et al. , “Transmit and receive transmission line arrays for 7 Tesla parallel imaging,” Magn Reson Med, vol. 53, no. 2, pp. 434–45, February, 2005. [DOI] [PubMed] [Google Scholar]
- [22].Raaijmakers A. et al. , “Design of a radiative surface coil array element at 7 T: the single-side adapted dipole antenna,” Magn Reson Med, vol. 66, no. 5, pp. 1488–1497, 2011. [DOI] [PubMed] [Google Scholar]
- [23].Hong SM, Park JH, Woo MK, Kim YB, and Cho ZH, “New design concept of monopole antenna array for UHF 7T MRI,” Magn Reson Med, vol. 71, no. 5, pp. 1944–52, May, 2014. [DOI] [PubMed] [Google Scholar]
- [24].Kang C-K, Kim H-K, Son Y-D, Yeong-Bae L, and Woo M-K, “Magnetic resonance imaging apparatus with spirally extended monopole antenna structure,” U.S. Patent No. 10,488,474. 26 November. 2019, 2019.
- [25].Oezerdem C. et al. , “16-channel bow tie antenna transceiver array for cardiac MR at 7.0 tesla,” Magn Reson Med, vol. 75, no. 6, pp. 2553–2565, 2016. [DOI] [PubMed] [Google Scholar]
- [26].Woo MK et al. , “Extended monopole antenna array with individual shield (EMAS) coil: An improved monopole antenna design for brain imaging at 7 tesla MRI,” Magn Reson Med, vol. 75, no. 6, pp. 2566–2572, 2016. [DOI] [PubMed] [Google Scholar]
- [27].Lattanzi R, Wiggins GC, Zhang B, Duan Q, Brown R, and Sodickson DK, “Approaching ultimate intrinsic signal-to-noise ratio with loop and dipole antennas,” Magn Reson Med, vol. 79, no. 3, pp. 1789–1803, March, 2018. [DOI] [PMC free article] [PubMed] [Google Scholar]
- [28].Pfrommer A, and Henning A, “The ultimate intrinsic signal-to-noise ratio of loop-and dipole-like current patterns in a realistic human head model,” Magn Reson Med, vol. 80, no. 5, pp. 2122–2138, 2018. [DOI] [PubMed] [Google Scholar]
- [29].Clément JD, Gruetter R, and Ipek Ö, “A human cerebral and cerebellar 8-channel transceive RF dipole coil array at 7T,” Magnetic resonance in medicine, vol. 81, no. 2, pp. 1447–1458, 2019. [DOI] [PubMed] [Google Scholar]
- [30].Wiggins GC, Zhang B, Lattanzi R. et al. , “The electric dipole array: an attempt to match the ideal current pattern for central SNR at 7 Tesla,” Proceedings of the 20th scientific meeting, International Society for Magnetic Resonance in Medicine, Melbourne, Australia, vol. 541, 2012. [Google Scholar]
- [31].Eryaman Y. et al. , “SAR reduction in 7T C-spine imaging using a “dark modes” transmit array strategy,” Magn Reson Med, vol. 73, no. 4, pp. 1533–1539, 2015. [DOI] [PMC free article] [PubMed] [Google Scholar]
- [32].Woo MK et al. , “A 16-channel transceiver loop+ dipole antennas head array for human head imaging at 10.5 T,” in IEEE-ICEAA, 2017. pp. 1649–1652. [DOI] [PMC free article] [PubMed] [Google Scholar]
- [33].Raaijmakers AJ et al. , “The fractionated dipole antenna: A new antenna for body imaging at 7 T esla,” Magn Reson Med, vol. 75, no. 3, pp. 1366–1374, 2016. [DOI] [PubMed] [Google Scholar]
- [34].Brink WM, Wu Z, and Webb AG, “A simple head-sized phantom for realistic static and radiofrequency characterization at high fields,” Magn Reson Med, vol. 80, no. 4, pp. 1738–1745, 2018. [DOI] [PubMed] [Google Scholar]
- [35].Jesmanowicz AJ, Hyde S, Froncisz W, and Kneeland BJ, “Noise correlation,” Magn Reson Med, vol. 20, no. 1, pp. 36–47, July, 1991. [DOI] [PubMed] [Google Scholar]
- [36].Yarnykh VL, “Actual flip-angle imaging in the pulsed steady state: a method for rapid three-dimensional mapping of the transmitted radiofrequency field,” Magn Reson Med, vol. 57, no. 1, pp. 192–200, 2007. [DOI] [PubMed] [Google Scholar]
- [37].Collins CM, and Smith MB, “Signal-to-noise ratio and absorbed power as functions of main magnetic field strength, and definition of “90°” RF pulse for the head in the birdcage coil,” Magnetic Resonance in Medicine: An Official Journal of the International Society for Magnetic Resonance in Medicine, vol. 45, no. 4, pp. 684–691, 2001. [DOI] [PubMed] [Google Scholar]
- [38].Collins CM, and Smith MB, “Calculations of B1 distribution, SNR, and SAR for a surface coil adjacent to an anatomically-accurate human body model,” Magn Reson Med, vol. 45, no. 4, pp. 692–699, 2001. [DOI] [PubMed] [Google Scholar]
- [39].Kellman P, and McVeigh ER, “Image reconstruction in SNR units: a general method for SNR measurement,” Magn Reson Med, vol. 54, no. 6, pp. 1439–1447, 2005. [DOI] [PMC free article] [PubMed] [Google Scholar]
- [40].Christ A. et al. , “The Virtual Family—development of surface-based anatomical models of two adults and two children for dosimetric simulations,” Physics in Medicine & Biology, vol. 55, no. 2, pp. N23, 2009. [DOI] [PubMed] [Google Scholar]
- [41].Corea JR et al. , “Screen-printed flexible MRI receive coils,”Nature communications, vol. 7, no. 1, pp. 1–7, 2016. [DOI] [PMC free article] [PubMed] [Google Scholar]
Associated Data
This section collects any data citations, data availability statements, or supplementary materials included in this article.


