

Longitudinal clustering of symptoms can predict the need for respiratory support in severe COVID-19.
Abstract
As no one symptom can predict disease severity or the need for dedicated medical support in coronavirus disease 2019 (COVID-19), we asked whether documenting symptom time series over the first few days informs outcome. Unsupervised time series clustering over symptom presentation was performed on data collected from a training dataset of completed cases enlisted early from the COVID Symptom Study Smartphone application, yielding six distinct symptom presentations. Clustering was validated on an independent replication dataset between 1 and 28 May 2020. Using the first 5 days of symptom logging, the ROC-AUC (receiver operating characteristic – area under the curve) of need for respiratory support was 78.8%, substantially outperforming personal characteristics alone (ROC-AUC 69.5%). Such an approach could be used to monitor at-risk patients and predict medical resource requirements days before they are required.
INTRODUCTION
During the spread of the coronavirus disease 2019 (COVID-19) pandemic, the strain on health care systems has been felt globally, and varying strategies for appropriate use of limited medical resource have been proposed (1, 2). However, heterogeneity in disease and presentation is evident, and the ability to predict required medical support ahead of time is limited. In this work, we sought to develop a clinical tool based on the time series of early development of COVID-19 that could be predictive of the need for high-level care in individuals more likely to seek medical help.
The COVID Symptom Study is a unique prospective population-based study collecting daily reports of symptoms from millions of users. The smartphone app offers a guided interface to report a range of baseline demographic information and comorbidities [as previously reported (3, 4)] and was developed by Zoe Global Limited with input from clinicians and scientists from King’s College London and Massachusetts General Hospital. With continued use, participants provide daily updates on symptoms, information on health care visits, COVID-19 testing results, and whether they are seeking medical support, including the level of intervention and related outcomes. Case reports have highlighted that individuals infected with COVID-19 may present with different symptoms (5–7). We hypothesized that longitudinal symptoms reported during the illness would cluster into distinct subtypes with differing clinical needs and that we could use this information to create a predictive tool for medical support that could be used for resource planning and improvement of COVID 19 patient monitoring. To study the time series of symptom occurrence for the most severe cases for which respiratory support may be needed, clusters of longitudinally reported symptoms were obtained from an unsupervised clustering analysis (8).
RESULTS AND DISCUSSION
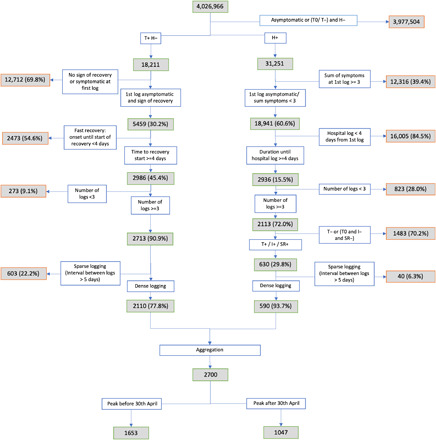
For our training dataset, we used data obtained from 1653 users of the app with persistent symptoms and regular logging, from disease onset until hospitalization or beginning of recovery, for which the data inclusion cutoff was 30 April 2020. An independent replication set was created using separate individuals fitting the criteria with a disease peak from the 30 April to 28 May 2020. Patient selection is detailed in the “Methods” section and associated with a flow diagram (Figure 4). The training sample for this analysis comprised 1653 participants, of whom 383 reported at least one hospital visit and 107 reported respiratory support (defined as ventilation or supplementary oxygen). The independent replication sample consisted of 1047 participants of which 207 reported a visit to hospital and 59 received respiratory support. Of participants in the independent replication 20 set, 87.8% were from the United Kingdom, 7.5% were from the United States, and 4.7% were from Sweden. Prediction of the final cluster into which a participant would fall based on a short reporting period was assessed through tabulation of confusion matrices and weighted precision and recall. A predictive system focused on the need for respiratory support (supplemental oxygen or ventilation) was then built featuring the inferred cluster, the aggregated sum of symptoms and features of individual characteristics using 5 days of symptom reporting. Both clustering and predictive models were applied to the independent replication set of 1047 individuals.
Fig. 4. Flowchart showing entry of participants into analysis.
Over the whole set of 2700 selected subjects, a number of demographic and health parameters were associated with higher risk for respiratory support requirement with the following odds ratios (ORs) and 95% confidence intervals (95% CIs): body mass index (BMI) in kg/m2 1.05 per unit increase (95% CI [1.03; 1.08], P < 0.0005), older age (OR 1.02, 95% CI: [1.01; 1.03], P = 0.003), chronic lung disease (OR 2.72, 95% CI: [1.90; 3.90], P < 0.0005), frailty as assessed by PRISMA7 questionnaire (9) (OR 5.98, 95% CI: [2.96; 12.10], P < 0.0005), and a suggestive association with male sex (OR 1.49, 95% CI: [1.04; 2.13], P = 0.029), respectively.
Unsupervised time series clustering (5) over the training set enabled us to distinguish six different clusters of symptom presentation. To visualize how clusters differed, we used the reported average occurrence of a symptom on each day for the median duration (Fig. 1, top) and the associated Z-score for occurrence for each cluster with reference to the average presentation of 1 of the 14 reported symptoms (Fig. 1, bottom). Equivalent plots for the independent replication dataset are presented in the Supplementary Materials (fig. S2).
Fig. 1. Illustrative representation of the 6 clusters.
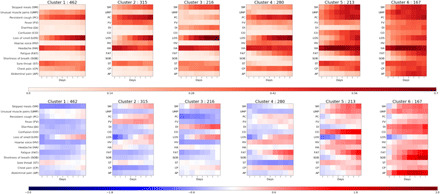
(Top) Frequency of positive answers per symptom across days for each cluster (darker, reported more frequently) and (bottom) associated Z-score of presentation of symptoms over overall symptom distribution (red, reported more than average; blue, reported less than average). The clusters are ordered from left to right by rates of reported hospital visit with associated rates of respiratory support of 1.5, 4.4, 3.7, 8.6, 9.9, and 19.8%, respectively.
Compared to clusters 3 to 6, of which 8.6 to 19.8% required respiratory support, clusters 1 and 2 represent milder forms of COVID-19 with 1.5 and 4.4%, respectively, requiring respiratory support. These clusters showed predominantly upper respiratory tract symptoms and were distinguished from each other by the absence of muscle pain in cluster 2 compared to cluster 1 and slightly increased reports of skipped meals and fever in cluster 2. Cluster 1 had notably lower mean age and BMI than the clusters containing patients with higher likelihood of requiring respiratory support (Table 1).
Table 1. Demographic details for the app users in each cluster, stratified by training/independent replication set membership.
BMI, body mass index; Hosp, hospital visit; RS, respiratory support. For continuous variables (age and BMI), results are given as mean (SD); frailty, PRISMA7 score ≥ 3; numbers in parentheses indicate the origin of the participants (UK, United Kingdom; US, United States; SE, Sweden).
| Training 1653 (1621–32-/) | Independent replication 1047 (919–79–49) | |||||||||||
| Cluster 1 | Cluster 2 | Cluster 3 | Cluster 4 | Cluster 5 | Cluster 6 | Cluster 1 | Cluster 2 | Cluster 3 | Cluster 4 | Cluster 5 | Cluster 6 | |
|
Number (UK-US- SE) |
462 (452-10-/) |
315 (310-5-/) |
216 (210-6-/) |
(273-7-/) | 213 (211-2-/) |
167 (165-2-/) |
404 (348-35-21) |
199 (174-16-9) |
130 (115-9-6) |
102 (88-9-5) |
118 (111-4-3) |
94 (83-6-5) |
| Age | 41.1 (11.6) |
43.2 (12.1) |
41.0 (12.4) |
43.0 (11.9) |
43.7 (13.2) |
43.8 (12.2) |
44.2 (12.3) |
46.4 (14.1) |
45.9 (13.5) |
48.9 (14.5) |
48.1 (15.5) |
46.7 (15.8) |
| BMI | 26.9 (5.5) | 27.3 (5.7) | 26.9 (5.8) | 27.4 (5.9) | 28.0 (5.9) | 28.9 (6.3) | 27.1 (5.7) | 28.2 (5.9) | 28.6 (6.5) | 27.2 (5.3) | 28.7 (6.5) | 29.3 (6.2) |
| Male | 29.4% | 26.3% | 19.9% | 16.8% | 27.7% | 24.6% | 21.3% | 24.6% | 21.5% | 25.5% | 28.8% | 34.0% |
| Lung | 13.6% | 10.5% | 10.2% | 19.6% | 19.7% | 28.1% | 12.1% | 15.1% | 11.5% | 18.6% | 16.1% | 30.9% |
| Heart | 1.5% | 1.0% | 1.9% | 2.1% | 3.8% | 4.2% | 0.7% | 2.0% | 1.5% | 3.9% | 5.9% | 1.1% |
| Diabetes | 2.2% | 3.2% | 4.2% | 3.2% | 4.2% | 4.8% | 1.7% | 4.0% | 6.9% | 2.0% | 5.1% | 7.4% |
| Kidney | 0.4% | 0.6% | 0.5% | 1.1% | 0.9% | 1.8% | 0.5% | 0.5% | 0.0% | 0.0% | 1.7% | 2.1% |
| Frailty | 0.0% | 1.3% | 0.0% | 0.0% | 3.3% | 5.4% | 1.0% | 2.0% | 1.5% | 2.0% | 5.9% | 8.5% |
| Hosp | 16.0% | 17.5% | 23.6% | 24.6% | 27.2% | 45.5% | 11.6% | 13.1% | 13.8% | 24.5% | 37.3% | 50.0% |
| RS | 1.5% | 4.4% | 3.7% | 8.6% | 9.9% | 19.8% | 0.2% | 2.5% | 2.3% | 7.8% | 16.9% | 23.4% |
Cluster 3 shows stronger gastrointestinal symptoms in isolation (diarrhea and skipped meals) and a relatively reduced need for respiratory support, of 3.7%. However, the associated rate of hospital visit was high compared to clusters 1 and 2. Clusters 4 to 6 included participants reporting more severe COVID-19 with 8.6, 9.9, and 19.8% of individuals within these clusters requiring respiratory support, respectively. These three clusters represent distinct presentations, with cluster 4 marked by the early presence of severe fatigue and the continuous presence of chest pain and persistent cough. In turn, individuals in cluster 5 reported confusion, skipped meals, and severe fatigue. Last, individuals in cluster 6 reported more marked symptoms of respiratory distress including early onset of shortness of breath accompanied by chest pain. These respiratory symptoms were combined with substantial abdominal pain, diarrhea, and confusion when compared with other clusters. The proportion of frail people was higher in cluster 5 and 6 (3.3 and 5.4%, respectively) than in what we consider to be the milder clusters. Table S2 and fig, S4 show the frequency of presentation of symptoms and their cooccurrence across the different clusters.
The ability to predict into which cluster a participant with COVID-19 will fall early in the disease process may enable the provision of adequate respiratory monitoring with pulse oximetry to at-risk patients. We used a confusion matrix analysis (as seen in Fig. 2) and considered between 2 to 9 days of recorded symptom data to perform the projection to different clusters. We found that after 5 days of reporting, despite 84.8% of the included samples presenting longer time series in the training set, the error in projection was modest both in the training and the independent replication set. In this six-class problem, the precision rose from 48.0% [45.9; 50.3] to 70.4% [68.4; 72.2] when moving from 2 to 5 days of data, while the recall increased from 47.2% [45.1; 49.5] to 70.3% [68.4; 72.1]. Notably, when using 9 days of reported data, precision was 84.9% [83.5; 86.3] with a recall of 84.6% [83.2; 86.1].
Fig. 2. Confusion matrix showing cluster prediction using projections based on 2 to 9 days after onset of symptoms.
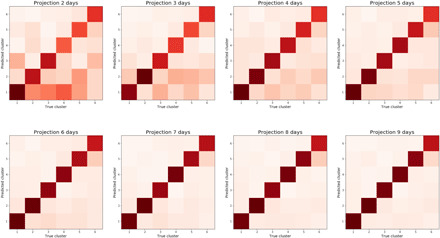
By day 5 of COVID-19, the cluster in which a participant falls can be predicted with 72% weighted average precision.
The projections used to create the final clustering of the training set and those obtained from a reduced number of days were applied to the independent replication set, and similar average patterns were observed: average precision and recall rose from (52.0 [49.4; 54.6], 51.8 [49.1; 54.3]) at 2 days to (72.4 [70.1; 74.6], 72.3 [70.1; 74.5]) at 5 days, and finally to (88.7 [87.1; 90.4], 88.7 [87.0; 90.3]) at 9 days (see fig. S3).
At 5 days, it appeared that headache was the symptom most consistently reported across all clusters (see Fig. 3), while severe fatigue appeared in those clusters with increased risk of requiring medical support (P < 0.0001) (see table S2). The duration of confusion was longer in more severe clusters, while loss of smell or taste was reported over a longer duration in milder clusters.
Fig. 3. Frequency of occurrence and duration of symptoms at 5 days.
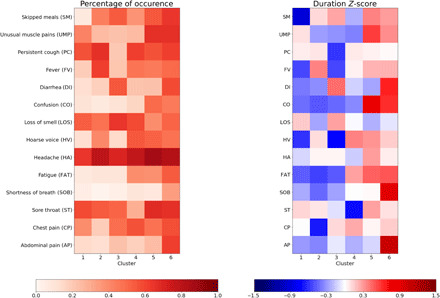
(Left) Percentage of occurrence of symptoms at 5 days per cluster. (Right) Z-score in duration of symptom when occurring over the five first days.
While informative in their own right, we sought to develop a clinically useful tool using these clusters as a feature in a machine learning–based system for predicting the need for respiratory support in COVID-19. Five days of reporting produced stable symptom clusters allowing for the construction of a predictive system that used data collected in the initial 5 days. The model used the predicted cluster (given 5 days reporting), the aggregated sum of symptoms up to and including that day, and personal characteristics including BMI, age, frailty (PRISMA7 score), and presence of comorbidities. The best model, trained with a fivefold cross-validation and grid search hyperparameter tuning, resulted in an area under the curve (AUC) of 78.8% [73.1; 84.2] on the independent replication set. In comparison, the demographic data alone led to an AUC of 69.5% [62.9; 74.5] where BMI, age, and chronic lung disease were prominent features. Using the optimal Youden index derived from the training set (10), symptom information yielded a good recall (79.9% [60.3; 80.4]) with a false positive rate of 38.0% [35.3; 40.6], whereas, without symptoms, demographic and baseline health information led to a reduced recall (72.8 [63.2; 82.2]) with a larger false positive rate (46.5 [43.8; 49.0]), providing a clear argument for the inclusion of symptomatology alongside personal characteristics in prediction models for more severe forms of COVID-19.
Our study was limited by the use of self-reported information collected from individuals who used smartphone devices. Generalizability may be affected by the demographics of the app users (predominantly female), and the development of stratified models may bring further insight. In addition, where individuals become too unwell to record their symptoms on the app later in the disease course, time series used in this work may not have accounted fully for the peak of the disease. To address this limitation, reporting-by-proxy was included on the app in late April 2020. National and regional differences in guidelines for hospital admissions and utilization of respiratory support exist, and given the multinational nature of this study, they must be acknowledged. In addition, our model cannot account for silent presentations such as cases of silent hypoxia reported in the literature (11), and the study of symptom trajectory focuses on presentations for which peak of the disease occurs at least 5 days after onset. It must also be noted that due to the prospective design of the study and changes in population characteristics using the app, the independent replication set was observed to be older than the training set that may lead to slight overestimation of severity in some younger individuals. Last, as strategy of care evolves over time as we get a better understanding of the disease, similar patterns of symptoms may lead to different clinical decisions regarding medical support and prediction of required resources (12–14).
The ability to predict medical resource requirements days before they arise and identify high-risk patients has significant clinical utility in this pandemic. If widely used and adapted to evolving guidelines, health care providers and managers could track large groups of patients and predict numbers requiring hospital care and respiratory support days ahead of these needs arising, allowing for staff, bed, and intensive care planning. As a clinical tool, this approach could be implemented at a local level, allowing patients to be monitored remotely by their primary health care teams with alert systems triggered when individuals demonstrate symptomatology associated with a high-risk cluster. Higher-risk individuals could be targeted for increased care to ensure that they do not struggle to access advice when becoming more unwell. For instance, patients who fall into cluster 5 or 6 at day 5 of the illness have a significant risk of hospitalization and respiratory support and may benefit from home pulse oximetry with daily phone calls from their general practice to ensure that hospital attendance occurs at the appropriate point in the course of their illness. Those in clusters 3 and 4 may also be at high risk and benefit from proactive care, for example, with glucose and electrolyte monitoring. A trigger system could be inbuilt as suggested in other initiatives (15), alerting these patients at high risk to seek medical attention at a point of specified predicted risk. In addition, some patients and practitioners may be empowered by a clinical tool into which they could input longitudinal symptomatology and personal characteristics and receive personalized information on risk stratification. However, further work is required to evaluate how to practically adapt such tools and benefit from this insight into symptom patterns.
MATERIALS AND METHODS
Material
Assessment of exposure, ascertainment of outcomes, and ascertainment of covariates
Exposure, outcome, and covariates were all ascertained via the app as previously described (7). A subset of individuals reported being tested for COVID-19. BMI was calculated as kilogram per square meter (kg/m2). Visit to hospital was recorded if the location was ever recorded as hospital or “back from hospital.”
Data from the app were downloaded into a server, and only records where the self-reported characteristics fell within the following ranges were used for further analyses: age between 16 (18 in the United States) and 100 years; BMI between 16 and 55 kg/m2. Fourteen symptoms were recorded: abdominal pain, chest pain, sore throat, shortness of breath, fatigue, hoarse voice, headache, loss of smell or taste, confusion, diarrhea, fever, persistent cough, unusual muscle pains, and skipped meals.
Linear interpolation between time points was used in the case of days of missing logs to impute symptoms. A limit of 5 days of interrupted record was filled in. Where more than one record was present for a single day, the latest record was considered. Indication of proportion of missing logs and selected subjects with more than three logs are presented in table S1.
Subject selection
All participants included in the analysis were required to: 1)Report a hospital visit or show sign of recovery [recovery was defined as a significant drop (at least 2) in number of reported symptoms at the day of last report compared to the day where sum of symptom was maximal] 2)Record their symptoms on the app at least three times over 4 days or more between the time their symptoms start and either a hospital visit or the start of symptom decline 3)For the recovery group: be tested positive 4)For the group visiting hospital: either (i) be tested positive, (ii) be imputed positive from the day where sum of symptoms was maximal following the imputation method described in Menni et al. (4), or (iii) reported classic symptoms of COVID-19 (2 days or more of fever and cough).
All participants fulfilling the criteria of selection were included with no selection done in the country (United Kingdom, United States, or Sweden) in which they reported.
Methods
Statistical analysis
For the assessment of risk factors, reported respiratory support was used as dependent variable in a logistic regression, using age and BMI as continuous variables and sex, frailty score, diabetes, lung, heart, or kidney disease as binary variables. The frailty score was binarized at a threshold of three points. Abbreviations are as follows: T0, no test; T+/−, tested positive/negative; H+/H−, attended hospital or did not attend hospital; I+, imputed COVID-19; SR+, self-reported classical symptoms of COVID-19 (2 days or more of fever and cough).
Modeling
The analysis of the disease course was separated into the unsupervised clustering and a predictive analysis for need of respiratory support using the learnt clusters.
Clustering analysis
Unsupervised time series clustering was performed using Mc2PCA (5) with 6 dimensions of projection from the 14 recorded binarized symptom course. This method allows for the clustering of time series with nonequal duration, using the covariance matrix of the time series. Optimization of the clustering is performed using a K-means iterative process as follows: For each cluster, a singular value decomposition is performed over the average of covariance matrices, and the first n (here 6) dimensions are used to calculate the projection. Attribution to each cluster is then chosen to minimize the residual error after projection. The process was iterated until the change in error ratio was below 10−4 (convergence criteria).
To determine the optimal number of clusters to consider over the disease continuum, for each number of clusters, the K-means clustering Mc2PCA was run with 20 random initialization, and the attempt with final minimal average distortion was selected. The Bayesian information criteria (BIC) was applied to balance model fit and model complexity leading to a choice of six clusters. Figure S1 presents the output of the BIC selection.
After separation of the different clusters, an average symptom course was calculated as the interpolated frequency of reported symptom for each given day over the mean duration for the given cluster. Ability to predict final cluster classification with a reduced number of days of reporting was assessed via weighted precision and recall score in the six-class problem and reported for the training and test set through the tabulation of confusion matrices.
Predictive analysis
To demonstrate the relevance of the clustering to predict need for respiratory support (supplemental oxygen or ventilation), we compared the performance of two random forest models on the independent testing set. The first one used only the demographic characteristics while the second further included the projected cluster at 5 days and the associated aggregated sum of symptoms over the 5 days. Youden Index obtained from the training set (0.066 and 0.059) for the model including symptomatology or only personal characteristics was applied on the independent test set of 1047 individuals for binary classification.
The random forests were trained to optimize the receiver operating curve area in a fivefold cross-validation setting with randomized grid search over hyperparameters. A bootstrap analysis with 1000 samples was used to provide CIs in the reported precision and false positive rates.
Supplementary Material
Acknowledgments
Funding: Zoe provided support for all aspects of building, running, and supporting the app and service to all users worldwide. Support for this study was provided by the NIHR-funded Biomedical Research Centre based at GSTT NHS Foundation Trust. This work was supported by the UK Research and Innovation London Medical Imaging and Artificial Intelligence Centre for Value Based Healthcare. Investigators also received support from the Wellcome Trust, the MRC/BHF, Alzheimer’s Society, EU, NIHR, CDRF, and the NIHR-funded BioResource, Clinical Research Facility and BRC based at GSTT NHS Foundation Trust in partnership with KCL. A.T.C. was supported in this work through a Stuart and Suzanne Steele MGH Research Scholar Award. C.M. is funded by the Chronic Disease Research Foundation and by the MRC AimHy project grant. L.H.N., D.A.D., A.D.J., A.T.C., C.G., and W.M. are supported by the Massachusetts Consortium on Pathogen Readiness (MassCPR) and Mark and Lisa Schwartz. The work performed on the Swedish study is supported by grants from the Swedish Research Council, Swedish Heart-Lung Foundation, and the Swedish Foundation for Strategic Research (LUDC-IRC 15-0067). Ethics statement: In the United Kingdom, the App Ethics has been approved by KCL ethics Committee REMAS ID 18210, review reference LRS-19/20-18210 and all subscribers provided consent. In Sweden, ethics approval for the study was provided by the central ethics committee (DNR 2020-01803). Author contributions: C.H.S., K.A.L., M.N.L., C.J.S., and S.O. conceived of and designed the experiments. C.H.S. analyzed the data. B.M., S.O., C.J.S., M.M., M.J.C., J.W., T.D.S., T.F., M.F.G., P.W.F., A.T.C., D.A.D., and L.H.N. contributed reagents, materials, and/or analysis tools. C.H.S., K.A.L., and M.N.L. wrote the manuscript. All authors revised the manuscript. Competing interests: Zoe Global Limited codeveloped the app pro bono for noncommercial purposes. Investigators received support from the Wellcome Trust, the MRC/BHF, EU, NIHR, CDRF, and the NIHR-funded BioResource, Clinical Research Facility and BRC based at GSTT NHS Foundation Trust in partnership with KCL. R.D., J.W., J.C.P., A.B., S.G., and J.L.C. work for Zoe Global Limited, and T.D.S. and P.W.F. are consultants to Zoe Global Limited. L.H.N., D.A.D., P.W.F., and A.T.C. previously participated as investigators on a diet study unrelated to this work that was supported by Zoe Global Ltd. All other authors declare that they have no competing interests. Data and materials availability: Data used in this study are available to bona fide researchers through U.K. Health Data Research using the following link https://healthdatagateway.org/detail/9b604483-9cdc-41b2-b82c-14ee3dd705f6. The code for the cluster modeling and projection is available at https://github.com/csudre/CovidClusters.
SUPPLEMENTARY MATERIALS
Supplementary material for this article is available at http://advances.sciencemag.org/cgi/content/full/7/12/eabd4177/DC1
REFERENCES AND NOTES
- 1.Emanuel E. J., Persad G., Upshur R., Thome B., Parker M., Glickman A., Zhang C., Boyle C., Smith M., Phillips J. P., Fair allocation of scarce medical resources in the time of Covid-19. N. Engl. J. Med. 382, 2049–2055 (2020). [DOI] [PubMed] [Google Scholar]
- 2.Phua J., Weng L., Ling L., Egi M., Lim C. M., Divatia J. V., Shrestha B. R., Arabi Y. M., Ng J., Gomersall C. D., Nishimura M., Koh Y., Du B.; Asian Critical Care Clinical Trials Group , Intensive care management of coronavirus disease 2019 (COVID-19): Challenges and recommendations. Lancet Respir. Med. 8, 506–517 (2020). [DOI] [PMC free article] [PubMed] [Google Scholar]
- 3.Drew D. A., Nguyen L. H., Steves C. J., Menni C., Freydin M., Varsavsky T., Sudre C. H., Cardoso M. J., Ourselin S., Wolf J., Spector T. D., Chan A. T.; COPE Consortium , Rapid implementation of mobile technology for real-time epidemiology of COVID-19. Science 368, 1362–1367 (2020). [DOI] [PMC free article] [PubMed] [Google Scholar]
- 4.Menni C., Valdes A. M., Freidin M. B., Sudre C. H., Nguyen L. H., Drew D. A., Ganesh S., Varsavsky T., Cardoso M. J., El-Sayed Moustafa J. S., Visconti A., Hysi P., Bowyer R. C. E., Mangino M., Falchi M., Wolf J., Ourselin S., Chan A. T., Steves C. J., Spector T. D., Real-time tracking of self-reported symptoms to predict potential COVID-19. Nat. Med. 26, 1037–1040 (2020). [DOI] [PMC free article] [PubMed] [Google Scholar]
- 5.Mackett A. J., Keevil V. L., COVID-19 and gastrointestinal symptoms—A case report. Geriatrics 5, 31 (2020). [DOI] [PMC free article] [PubMed] [Google Scholar]
- 6.Tay H. S., Harwood R., Atypical presentation of COVID-19 in a frail older person. Age Ageing 49, 523–524 (2020). [DOI] [PMC free article] [PubMed] [Google Scholar]
- 7.Butt I., Sawlani V., Geberhiwot T., Prolonged confusional state as first manifestation of COVID-19. Ann. Clin. Transl. Neurol. 7, 1450–1452 (2020). [DOI] [PMC free article] [PubMed] [Google Scholar]
- 8.Li H., Multivariate time series clustering based on common principal component analysis. Neurocomputing 349, 239–247 (2019). [Google Scholar]
- 9.Raîche M., Hébert R., Dubois M. F., PRISMA-7: A case-finding tool to identify older adults with moderate to severe disabilities. Arch. Gerontol. Geriatr. 47, 9–18 (2008). [DOI] [PubMed] [Google Scholar]
- 10.Youden W. J., Index for rating diagnostic tests. Cancer 3, 32–35 (1950). [DOI] [PubMed] [Google Scholar]
- 11.Wilkerson R. G., Adler J. D., Shah N. G., Brown R., Silent hypoxia: A harbinger of clinical deterioration in patients with COVID-19. Am. J. Emerg. Med. 38, 2243.e5–2243.e6 (2020). [DOI] [PMC free article] [PubMed] [Google Scholar]
- 12.Gómez C. C., Rodríguez Ó. P., Torné M. I. L., Santaolalla C. E., Jiménez J. F. M., Fernández J. G., Perales J. M. C., Heili-Frades S. B., Monreal M. F., de Andrés Nilsson J. M., Arias E. L., Rocamora J. L. S., Garrote J. I., Serrano M. J. Z., Martínez M. G., Muñoz E. F., San Andrés O. M., Cervera G. R., Mas Serra A., Martínez G. H., de Haro López C., Gas O. R., Roca R. F., Berrocal A. R., Ortola C. F., Clinical consensus recommendations regarding non-invasive respiratory support in the adult patient with acute respiratory failure secondary to SARS-CoV-2 infection. Rev. Esp. Anestesiol. Reanim. 67, 261–270 (2020). [DOI] [PMC free article] [PubMed] [Google Scholar]
- 13.Camporota L., Vasques F., Sanderson B., Barrett N. A., Gattinoni L., Identification of pathophysiological patterns for triage and respiratory support in COVID-19. J. Clean. Prod. 8, 752–754 (2020). [DOI] [PMC free article] [PubMed] [Google Scholar]
- 14.Zhu L., Hu L. J., Rational application of respiratory support technique in patients with COVID-19 pneumonia. Fudan Univ. J. Med. Sci. 47, 170–172 (2020). [Google Scholar]
- 15.T. Annis, S. Pleasants, G. H. Mph, E. Lindemann, J. A. Thompson, S. Billecke, S. Badlani, G. B. Melton, Rapid Implementation of a COVID-19 Remote Patient Monitoring Program BACKGROUND & SIGNIFICANCE, doi: 10.1093/jamia/ocaa097/5835871. [DOI] [PMC free article] [PubMed]
Associated Data
This section collects any data citations, data availability statements, or supplementary materials included in this article.
Supplementary Materials
Supplementary material for this article is available at http://advances.sciencemag.org/cgi/content/full/7/12/eabd4177/DC1