

Abstract
Objective:
The objective of this study was to examine the associations between self-reported ability to afford dental care and quality of life in adults aged 45 years and older.
Method:
We used publicly available cross-sectional data from the 2008 National Health Interview Survey and its oral health supplement for 11,760 adults aged 45+ years. The increased probabilities of reporting dental problems attributable to an inability to afford dental care were estimated from multivariate models and combined with respective dental problem disability weights from the Global Burden of Disease to measure loss in quality of life.
Results:
Prevalence of reported inability to afford dental care, severe tooth loss, severe periodontitis, and untreated caries were 11.9%, 8.5%, 14.3%, and 37.9%, respectively. Inability to afford dental care was associated with an increase of 0.017 disability-adjusted life-years (DALYs) per person per year under base case and 0.020 DALYs under generous assumptions.
Conclusion:
Making dental care affordable could improve adult’s (age 45 and above) quality of life at a reasonable cost.
Keywords: dental problems, inability to afford dental care, quality of life in older adults, disability-adjusted life-years
Introduction
Oral health is essential to general health and quality of life (Glick et al., 2016; Jones et al., 2004; Jones, Spiro, Miller, Garcia, & Kressin, 2002). And yet, dental care is the highest reported unmet health need due to affordability among adults and older adults (Vujicic, Buchmueller, & Klein, 2016). Dental diseases, if left untreated, cause problems in eating, speaking, and ability to work and compromise the quality of life. National data show a high burden of oral diseases, untreated caries, and tooth loss among low-income and racial-ethnic minority adults (Centers for Disease Control and Prevention, National Center for Health Statistics, 2011; Dye, Thornton-Evans, Li, & Iafolla, 2015). Non-Hispanic Blacks and persons under 200% of the federal poverty level are more likely to report oral pain, avoid food due to a dental or oral problem, be embarrassed due to their teeth or mouth and have less satisfaction with life compared with their non-Hispanic White and higher income counterparts, respectively (Griffin, Jones, Brunson, Griffin, & Bailey, 2012). Access to and use of primary and secondary preventive dental services is critical to maintaining good oral health (U.S. Department of Health and Human Services, 2000) and is largely dependent on enabling resources such as income and dental insurance (Kelekar & Naavaal, 2018; Naavaal, Barker, & Griffin, 2017).
There are substantial disparities in dental insurance status by income, age, gender, race, and state of residence (Center for Health Care Strategies, 2018; Manski et al., 2010). Low-income adults face additional challenges to maintain good oral health due to inadequate dental coverage and gaps in oral health literacy (Griffin et al., 2012; U.S. Department of Health and Human Services, 2000). Unlike pediatric dental benefits, which are covered in Medicaid programs in every state, adult dental benefits are optional and vary from state to state. Only 17 states provide comprehensive dental coverage to Medicaid eligible adults (Center for Health Care Strategies, 2018). A similar situation is mirrored for adults over age 65 years as Medicare does not have any dental coverage and the majority of baby boomers who are retiring every day (Pew Research Center, 2010) will also lack access to dental care. Upon retirement, adults are less likely than nonretirees to have dental insurance (58.3% vs. 37.9% among persons aged 51 and over) (Manski et al., 2010). These differences can have major implications for retirees’ oral health-seeking behavior. A recent analysis of 2012 data found that only 12% of Medicare beneficiaries had dental insurance and less than half of all beneficiaries had any dental visits in the past 12 months. Dental visits reduced steeply as income reduced among these older adults (Willink, Schoen, & Davis, 2016).
Because cost is the most commonly reported barrier in accessing dental care among older adults (Vujicic et al., 2016), a recent study examined the feasibility of providing dental benefits through a premium-financed, voluntary supplemental plan similar to prescription drug coverage in Medicare Part D with income-related subsidies (Willink et al., 2016). The study estimated that it would cost Medicare on average $540 to fully cover one preventive dental care visit and 50% of allowable additional preventive care and treatment of periodontal disease and dental caries up to $1500 limit per year (Willink et al., 2016). The per capita average insurance premium would be $348 per year or $29 per month and the subsidy from the federal government to cover the premium and some cost sharing for 13 million eligible low-income beneficiaries would be $4.4 billion (Willink et al., 2016), which is 0.62% of total Medicare spending (Centers for Medicare & Medicaid Services, 2019).
However, to date, we are aware of no studies that have examined the impact of dental care affordability on older adults’ quality of life. Information on both cost and resulting benefit are necessary to evaluate policies aimed at decreasing financial barriers to obtaining needed dental care. Tooth loss, untreated dental caries, and periodontitis can reduce older adults’ quality of life (Griffin et al., 2012). Globally, the burden of other health conditions has decreased in the past decade, whereas the burden of these three oral conditions has increased (Marcenes et al., 2013). This increase in oral health disease burden is primarily due to age and the growth in the population; in 2010, oral conditions accounted for an average loss of 224 years of good health per 100,000 persons (Marcenes et al., 2013).
This analysis used data from the 2008 National Health Interview Survey (NHIS) and examined the increased risk of reporting dental problems attributable to an inability to afford dental care. We combined our findings with the associated disability-adjusted weights obtained from the Global Burden of Disease (GBD) project to estimate the annual disability-adjusted life-years (DALYs) that could be averted if dental care were affordable (Marcenes et al., 2013). The analysis used the most recent national survey with special oral health supplement that included information on ability to afford dental care and prevalence of symptoms associated with poor oral health (e.g., difficulty eating). NHIS is also the only survey that provides the above information along with dental insurance status.
Method
Data Set and Study Population
This study used data from the 2008 NHIS and its adult oral health supplement. Although the NHIS includes core oral health questions each year, only the 2008 NHIS included a special supplement with detailed questions about oral health problems. The NHIS supports national estimates of health status and health care access and utilization for the civilian, noninstitutionalized, U.S. population. It is a household interview survey, but as part of that interview, a sample adult is randomly selected from each family in the household to answer additional questions about his or her health. In 2008, the adult oral health supplement was administered to all adults aged 18 and over within the sample adult questionnaire. The detailed information regarding the survey design, questionnaire, and implementation are available from ftp://ftp.cdc.gov/pub/Health_Statistics/NCHS/Dataset_Documentation/NHIS/2008/srvydesc.pdf. The conduct of the NHIS was approved by the National Center for Health Statistics research ethics review board. For this study, we used deidentified publicly available data and thus did not require separate institutional review board approval. The study sample included 11,760 adults aged 45 years and older.
Questions regarding oral problems in the oral health supplement that were used in this analysis included (a) during the past 6 months, did respondent have any of the following problems that lasted more than a day: difficulty eating or chewing, bad breath, or dry mouth. (b) Only dentate respondents (n= 9647) were asked questions regarding the condition of their teeth during the past 6 months—whether they had bleeding gums, broken/missing fillings or teeth, and toothache/sensitive teeth. We assumed that edentate respondents did not have any of the conditions related to teeth.
Questions from the core NHIS used in this analysis were whether there was any time during the past 12 months when the respondent needed dental care but did not get it because he or she could not afford it (yes, no); age group (45–54, 55–64, 65–74, 75–84 and 85+); sex; race/ethnicity (Hispanic, non-Hispanic [NH] White, NH Black, NH Asian, and NH other); education level <High School [HS], HS or equivalent, >HS); presence of chronic health conditions including heart disease (yes, no) and diagnosed diabetes status (yes, no); and smoking status (current, former, never). NHIS also included questions on family income and insurance. Respondent’s dental insurance status was categorized as private, Medicaid, Medicare, no insurance, and other. Respondents who reported that they had private health insurance were asked whether the plan pays for any of the cost for dental care. If they reported yes, they were classified as having private dental insurance. Similarly, if the respondent reported having any single service plan that covered dental care, they were categorized as having private dental insurance. Family income was categorized into four categories based on the ratio of family income to the poverty threshold (under 1, 1–1.99, 2–3.99, and 4 and above).
Measuring Loss in Quality of Life Due to Dental Conditions
The GBD project includes case and disability (symptoms) definitions and disability weights (DWs) for various diseases and injuries. The DW measures the annual loss in quality of life attributable to a condition where 0 = perfect health and 1 = death. The three oral conditions included in the GBD are (a) untreated dental caries (case definition: unmistakable coronal cavity at dentin level, root cavity in cementum that feels soft or leathery to probing, temporary or permanent restorations with a caries lesion; disability defined as toothache causing some difficulty eating; DW = 0.012); (b) severe periodontitis (case definition: clinical attachment loss more than 6 mm or gingival pocket depth more than 4 mm; disability defined as bad breath, bad taste in the mouth, and bleeding gums; DW = 0.0079); and (c) severe tooth loss (case definition: eight or fewer remaining teeth; disability defined as great difficulty in eating meat, fruits, and vegetables; DW = 0.073).
Two of the authors, who are dentists, determined whether a respondent in NHIS had one of the three oral conditions by mapping NHIS oral problem questions to GBD disability definitions (Table 1). Under base case, we assumed that persons reporting eating problems had severe tooth loss and those reporting bad breath or bleeding gums had severe periodontitis. Under conservative assumptions (mapped NHIS responses to GBD condition with lowest DWs), we again assumed that persons reporting bad breath or bleeding gums had severe periodontitis but for persons reporting eating problems we now assumed they had untreated dental caries. Under generous assumptions (result in highest DALYs), we used the same assumptions as under base case but also assumed that persons reporting sensitivity/toothache, missing/broken fillings, missing/broken teeth, or dry mouth had untreated dental caries.
Table 1.
NHIS Symptoms, Global Burden of Disease Definitions, and Condition Assigned for Disability Weight Calculations.
| Maps to GBD | GBD condition assigned to respondents answering yes to NHIS question | ||
|---|---|---|---|
| NHIS question | Disability definition | Case definition | |
| Base-case assumptions | |||
| Difficulty eating/chewing | Great difficulty in eating meat, fruits, and vegetables | Not used | Severe tooth loss |
| Bad breath/bleeding gums | Bad breath, a bad taste in the mouth, and gums that bleed a little from time to time, but this does not interfere with daily activities | Not used | Severe periodontitis |
| Conservative assumptions | |||
| Difficulty eating/chewing | Toothache causing some difficulty eating | Not used | Untreated caries |
| Bad breath/bleeding gums | Bad breath, a bad taste in the mouth, and gums that bleed a little from time to time, but this does not interfere with daily activities | Not used | Severe periodontitis |
| Generous assumptions | |||
| Difficulty eating/chewing | Great difficulty in eating meat, fruits, and vegetables | Not used | Severe tooth loss |
| Bad breath/bleeding gums | Bad breath, a bad taste in the mouth, and gums that bleed a little from time to time, but this does not interfere with daily activities | Not used | Severe periodontitis |
| Sensitivity/toothache, missing/ broken fillings, missing/broken teeth, or dry mouth | Not used | Unmistakable coronal cavity at dentin level, root cavity in cementum that feels soft or leathery to probing, temporary or permanent restorations with a caries lesion | Untreated caries |
Note. NHIS = National Health Interview Survey; GBD = Global Burden of Disease.
For all combinations of conditions under base, conservative, and generous assumptions, we used multivariate logistic regression models (specification in following section) to estimate the increased probability of reporting an oral condition that was attributable to inability to afford dental care. It was calculated as the difference in the probability of reporting the respective condition among persons who reported inability to afford dental care and ability to afford dental care. For example, under base-case assumptions there were three possible combinations: severe tooth loss (only reported eating problem in NHIS), severe periodontitis (only reported bad breath/bleeding gums in NHIS), and severe periodontitis + severe tooth loss (reported eating problem and bad breath/bleeding gums). We ran a separate regression for each of the possible combinations as the dependent variable.
DALYs attributable to an inability to afford dental care were obtained by multiplying the increased probability of reporting each dental condition by its respective DW. Persons with multiple conditions (e.g., severe periodontitis + severe tooth loss) were assigned the sum of the corresponding DWs. Finally, we estimated economic losses attributable to an inability to afford dental care by multiplying the resulting increased DALYs by estimated costs per DALY ranging from $20,000 to $180,000.
Statistical Analyses
We used a chi-square test of independence to examine whether there were differences in the composition of the sample of adults who reported they could and could not afford dental care. To examine the association between reporting inability to afford dental care and validated predictors of dental utilization (private dental insurance and income), we used a logistic regression model. Explanatory variables included private dental insurance (yes, no), household income (less than 1.99, 2–3.99, and 4+ FPL ratio), age group, sex, race/ethnicity, education level, smoking status, lost all teeth, heart disease status, and diagnosed diabetes status. Probabilities (predicted marginals) of reporting inability to afford dental care obtained from the regression were compared across categories of private dental insurance and age (Bieler, Brown, Williams, & Brogan, 2010). We also ran a logistic regression for each combination of dental conditions from the GBD for the different assumption scenarios. The primary explanatory variable was inability to afford dental care. To control for confounding, all regressions included the following independent variables: age group, sex, race/ethnicity, education level, smoking status, heart disease status, and diagnosed diabetes status. We also ran logistic regression models including interaction terms to examine whether the association between inability to afford dental care and reporting a dental problem varied by age. Model-adjusted probabilities (predicted marginals) of reporting each condition for persons reporting and not reporting inability to afford dental care were obtained from these regressions.
We used t tests to determine whether the probability of reporting inability to afford dental care varies for the various categories of independent variables. T tests were also used to examine whether (a) differences in adjusted probabilities of reporting inability to afford dental care significantly varied across categories of private dental insurance and income, and (b) reporting a dental condition attributable to an inability to afford dental care were significant.
All analyses were conducted using SUDAAN (Release 11.0, Research Triangle Institute, Research Triangle Park, NC) to account for survey weighting and to adjust the variance (Taylor Series Linearization method) for the multistage, clustered survey design. Data were weighted to produce prevalence/probability estimates for the civilian noninstitutionalized U.S. population aged 45 years and older. Values of p < .05 were considered statistically significant unless stated otherwise.
Results
Main Explanatory Variable—Inability to Afford Dental Care
Among adults aged 45+ years, the prevalence of self-reported inability to afford dental care in the past 12 months was 11.9% (Table 2). Factors associated with reporting inability versus ability to afford needed dental care included being younger, female, non-Hispanic Black or Hispanic, less educated, poor, uninsured or Medicaid insured, a current smoker, and reporting diagnosed diabetes or cardiovascular disease.
Table 2.
Characteristics of Adults Reporting Ability/Inability to Afford Dental Care—National Health Interview Survey, 2008.
| Overall | Can’t afford dental care | Can afford dental care | p value | ||||
|---|---|---|---|---|---|---|---|
| Total | 11.9 | (0.4) | 88.1 | (0.4) | |||
| Age group | <.001 | ||||||
| 45–54 | 38.3 | 0.6 | 53.4 | 1.6 | 36.3 | 0.7 | |
| 55–64 | 29.2 | 0.5 | 31.3 | 1.5 | 28.9 | 0.6 | |
| 65–74 | 17.3 | 0.4 | 10.8 | 0.8 | 18.2 | 0.4 | |
| 75–84 | 11.2 | 0.3 | 3.7 | 0.5 | 12.2 | 0.4 | |
| 85 + | 3.9 | 0.2 | 0.8 | 0.2* | 4.3 | 0.3 | |
| Sex | .0003 | ||||||
| Male | 46.8 | 0.6 | 41.1 | 1.7 | 47.6 | 0.6 | |
| Female | 53.2 | 0.6 | 58.9 | 1.7 | 52.4 | 0.6 | |
| Race/ethnicity | <.001 | ||||||
| Hispanic | 9.1 | 0.3 | 14.8 | 1.2 | 8.3 | 0.4 | |
| NH White | 75.9 | 0.6 | 67.5 | 1.6 | 77.1 | 0.6 | |
| NH Black | 10.2 | 0.4 | 13.9 | 1.1 | 9.7 | 0.4 | |
| NH Asian | 4.0 | 0.2 | 2.6 | 0.4 | 4.1 | 0.2 | |
| NH All other race groups | 0.8 | 0.1 | -* | 0.8 | 0.1 | ||
| Education | <.001 | ||||||
| <HS | 16.4 | 0.5 | 21.7 | 1.3 | 15.6 | 0.5 | |
| HS grad/GED | 29.8 | 0.5 | 31.9 | 1.5 | 29.5 | 0.6 | |
| >HS | 53.9 | 0.6 | 46.4 | 1.7 | 54.9 | 0.6 | |
| Poverty ratio | <.001 | ||||||
| Less than 1 | 9.1 | 0.3 | 19.4 | 1.3 | 7.7 | 0.3 | |
| 1 to 1.99 | 14.8 | 0.5 | 28.0 | 1.6 | 13.0 | 0.5 | |
| 2 to 3.99 | 29.1 | 0.5 | 31.0 | 1.6 | 28.8 | 0.6 | |
| 4+ | 47.0 | 0.7 | 21.6 | 1.4 | 50.5 | 0.8 | |
| Dental insurance | <.001 | ||||||
| No insurance | 22.0 | 0.5 | 42.6 | 1.7 | 19.2 | 0.5 | |
| Private | 43.6 | 0.7 | 22.2 | 1.4 | 46.5 | 0.7 | |
| Medicaid | 6.1 | 0.3 | 11.4 | 1.1 | 5.4 | 0.2 | |
| Medicare | 24.4 | 0.5 | 18.0 | 1.1 | 25.3 | 0.5 | |
| Other government | 3.9 | 0.2 | 5.9 | 0.8 | 3.6 | 0.2 | |
| Smoking status | <.001 | ||||||
| Current | 18.2 | 0.5 | 30.5 | 1.5 | 16.6 | 0.5 | |
| Former | 30.5 | 0.6 | 25.6 | 1.4 | 31.1 | 0.6 | |
| Never | 51.3 | 0.6 | 43.9 | 1.7 | 52.3 | 0.6 | |
| Heart disease | .0083 | ||||||
| Yes | 18.8 | 0.4 | 22.1 | 1.4 | 18.3 | 0.5 | |
| No | 81.2 | 0.4 | 77.9 | 1.4 | 81.7 | 0.5 | |
| Diagnosed diabetes | .0038 | ||||||
| Yes | 15.8 | 0.4 | 18.9 | 1.2 | 15.4 | 0.4 | |
| No | 84.2 | 0.4 | 81.1 | 1.2 | 84.6 | 0.4 | |
Note. NH = non-Hispanic; HS = high school; GED = general educational development/diploma.
Estimate is statistically unstable (RSE >30 percent or denominator n <50).
After controlling for covariates, inability to afford dental care was still strongly associated with income, private dental insurance, age, edentulousness, smoking status, heart disease, and sex in multivariate regression model (Figure 1). Adults living in poverty or having no private dental insurance were over 3 and 2 times more likely, respectively, to report inability to afford dental care. When tested, interactions between age and insurance or age and income were not found to be significant; however, age had a strong relationship with dental care affordability. Adjusted probability of inability to afford dental care decreased as age increased.
Figure 1.
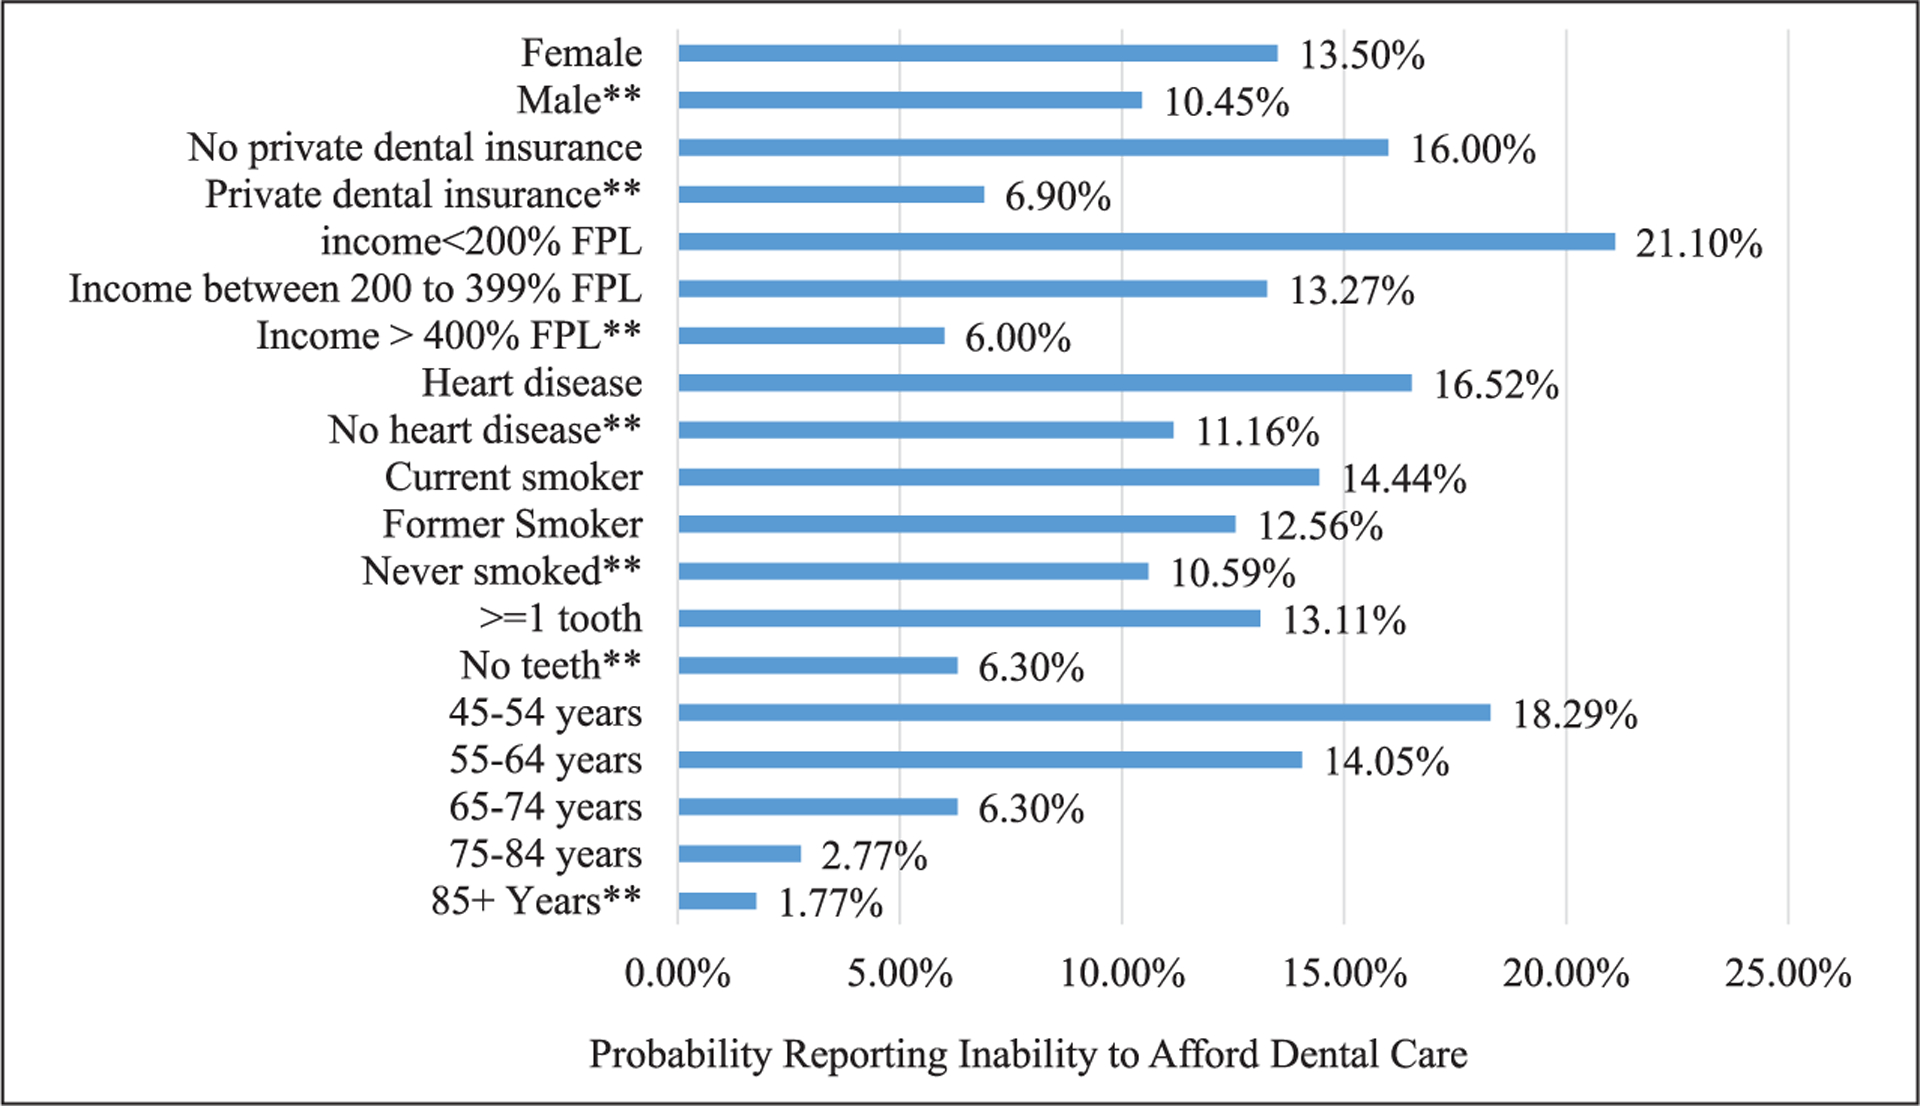
Adjusted percentage of adults, aged 45+ years, reporting inability to afford dental care by characteristics.
Source. National Health Interview Survey (2008).
Note. Predicted marginals obtained from regression model and adjusted for race/ethnicity, education, and diagnosed diabetes status.
**Reference category significantly different from other categories at p < .01.
Prevalence of Reported Dental Disabilities
Crude prevalence of self-reported eating problem (GBD disability for severe tooth loss) was 8.5%; self-reported bad breath/bleeding gum (GBD disability for severe periodontitis) was 14.3%; and 37.7% reported sensitivity/toothache, missing/broken fillings, missing/broken teeth, or dry mouth (GBD disability assigned for untreated caries under generous assumptions). Under base-case assumptions, the prevalence of symptoms associated with severe periodontitis and severe tooth loss was 19.0%. The prevalence of dental conditions/symptoms associated with severe periodontitis, severe tooth loss, and untreated caries was 41.9% under generous assumptions (Table 3).
Table 3.
Increase in Adjusted Prevalence (Standard Error) of Reporting Dental Conditions Attributable to an Inability to Afford Dental Care and Associated Disability Life Years.
| Crude prevalence | Adjusted prevalencea | Adjusted prevalence | Increased prevalence of disability | Increased disability-adjusted life years | |
|---|---|---|---|---|---|
| Condition | All | Can’t afford | Can afford | ||
| Base-case scenario | |||||
| Severe tooth loss | 4.6 (0.2) | 12.0 (1.0) | 3.6 (0.2) | 8.5 (l.l)* | 0.006 |
| Severe periodontitis only | 10.4 (0.3) | 16.8 (1.2) | 9.5 (0.4) | 7.2 (1.3)* | 0.001 |
| Severe tooth loss and periodontitis | 3.9 (0.2) | 14.6 (l.l) | 2.3 (0.2) | 12.3 (l.l)* | 0.010 |
| Total | 19.0 (0.5) | 44.4 (1.7) | 15.4 (0.5) | 29.0 (1.8)* | 0.017 |
| Generous-case Scenario | |||||
| Severe tooth loss only | 1.2 (0.1) | 2.8 (0.6) | 0.9 (0.1) | 1.8 (0.6)* | 0.001 |
| Severe periodontitis only | 2.9 (0.2) | 2.2 (0.5) | 3.0 (0.2) | −0.9 (0.6) | 0.0 |
| Untreated caries only | 22.9 (0.5) | 27.8 (1.5) | 22.4 (0.5) | 5.4 (1.6)* | 0.001 |
| Severe tooth loss and periodontitis | 0.2 (0.0) | 1.2 (0.4) | 0.5 (0.1) | 0.7 (0.4) | 0.0 |
| Severe tooth loss and untreated caries | 3.5 (0.2) | 9.3 (0.9) | 2.6 (0.2) | 6.7 (1.0)* | 0.006 |
| Severe periodontitis and untreated caries | 7.5 (0.3) | 14.5 (l.l) | 6.5 (0.3) | 8.0 (1.2)* | 0.002 |
| Severe periodontitis, severe tooth loss, and untreated caries | 3.8 (0.2) | 13.7(1.1) | 2.1 (0.2) | 11.6 (l.l)* | 0.011 |
| Total | 41.9 (0.7) | 73.7(1.4) | 37.9 (0.7) | 35.9 (1.6)* | 0.020 |
Obtained from logistic regression model adjusted for sociodemographic factors, chronic diseases, and smoking status.
significance at p<0.01.
Increased Adjusted Prevalence/Probability of Reporting Dental Disabilities Attributable to Affordability
Under base-case assumptions, inability to afford dental care and reporting dental symptoms vary by age for the report of severe tooth loss problem only (disability defined as great difficulty in eating meat, fruits, and vegetables) (p = .037). Inability to afford dental care was associated with an 8.5 percentage point increase in the adjusted prevalence of severe tooth loss symptoms, a 7.2 percentage point increase in severe periodontitis symptoms, and 12.3 percentage point increase in symptoms associated with both severe tooth loss and severe periodontitis (Table 3). Multiplying the increased prevalences by their respective DWs indicated that inability to afford dental care was associated with an increase of 0.017 DALYs per person per year (Table 3). The annual per-person economic losses from an inability to afford dental care ranged from $335 if the cost per DALY was $20,000 to $3,011 if the DALY cost was $180,000 (Table 4).
Table 4.
Among Persons Reporting Inability to Afford Dental Care, Per-Person Economic Loss for Various Valuations of Averted DALY Per Year Under the Conservative, Base-Case, and Generous Assumptions.
| Annual per-person economic loss from 1 DALY | Conservative | Base | Generous |
|---|---|---|---|
| Average economic loss (95% CI) | Average economic loss (95% CI) | Average economic loss (95% CI) | |
| $20,000 | $81 [$67, $95] | $335 [$285, $396] | $400 [$327, $488] |
| $30,000 | $121 [$ 101, $142] | $502 [$427, $593] | $600 [$491, $732] |
| $40,000 | $162 [$135, $189] | $669 [$569, $791] | $800 [$654, $976] |
| $50,000 | $202 [$168, $237] | $836 [$712, $989] | $999 [$818, $1,219] |
| $60,000 | $242 [$202, $284] | $1,004 [$854, $1,1871] | $1,199 [$982, $1,463] |
| $70,000 | $283 [$236, $331] | $1,171 [$997, $1,385] | $1,399 [$ 1,145, $1,707] |
| $80,000 | $323 [$269, $379] | $1,338 [$ 1,139, $1,583] | $1,599 [$1,309, $1,951] |
| $90,000 | $364 [$303, $426] | $1,506 [$ 1,281, $1,780] | $1,799 [$1,472, $2,195] |
| $100,000 | $404 [$337, $473] | $1,673 [$1,424, $1,978] | $1,999 [$1,636, $2,439] |
| $110,000 | $444 [$370, $521] | $1,840 [$1,566, $2,176] | $2,199 [$1,799, $2,683] |
| $120,000 | $485 [$404, $568] | $2,007 [$1,708, $2,374] | $2,399 [$1,963, $2,927] |
| $130,000 | $525 [$438, $615] | $2,175 [$1,851, $2,572] | $2,598 [$2,127, $3,171] |
| $140,000 | $566 [$471, $663] | $2,342 [$1,993, $2,769] | $2,798 [$2,290, $3,414] |
| $150,000 | $606 [$505, $710] | $2,509 [$2,135, $2,967] | $2,998 [$2,454, $3,658] |
| $160,000 | $647 [$539, $757] | $2,677 [$2,278, $3,165] | $3,198 [$2,617, $3,902] |
| $170,000 | $687 [$572, $805] | $2,844 [$2,420, $3,361] | $3,398 [$2,781, $4,146] |
| $180,000 | $727 [$606, $852] | $3,011 [$2,563, $3,561] | $3,598 [$2,945, $4,390] |
Note. 95% interval obtained by multiplying upper and lower values in 95% confidence interval for the increased prevalence of disability attributable to an inability to afford dental care multiplied by corresponding DALY weights and per-person annual loss from 1 DALY. Base case includes two dental conditions—tooth loss and severe periodontitis with disability-adjusted life year weight (DW) of 0.073 assigned to tooth loss. Conservative-case scenario includes tooth loss and severe periodontitis with DW of 0.012 assigned to tooth loss. Generous-case scenario includes tooth loss, severe periodontitis, and untreated caries with DW of 0.073 assigned to tooth loss.
DALY = disability-adjusted life-year; CI = confidence interval; DW = disability weight.
Under conservative assumptions, the prevalence of symptoms would not differ from those in the base case but the DW assigned to reporting eating problem would be that for untreated caries, not severe tooth loss. The increase in DALYs attributable to inability to afford dental care would equal 0.004, and the per-person annual economic loss ranged from $81 to $727 for estimated costs per DALY ranging from $20,000 to $180,000, respectively (Table 4).
Under generous assumptions, inability to afford dental care was associated with a 1.8 percentage point increase in prevalence of reported severe tooth loss, 5.4 percentage point increase in untreated caries, 6.7 percentage point increase in reporting both severe tooth loss and untreated caries, 8.0 percentage point increase in reporting both severe periodontitis and untreated caries, and 11.6 percentage point increase in reporting all three conditions (Table 3). Increased DALYs per person attributable to an inability to afford dental care would equal 0.02 (Table 3), and the associated economic loss ranged from $400 to $3,598 for estimated costs per DALY ranging from $20,000 to $180,000, respectively (Table 4).
Discussion
Our study suggests that providing dental care to the 12% of adults aged 45 years and older who reported inability to afford needed dental care could reduce the prevalence of their reported dental problems by 29 percentage points (standard error 1.8) and prevent 0.017 DALYs per person. Under base-case assumptions, the associated economic gains (averted economic losses) would range from about $335 to $3,011 per person per year depending on a community’s value of a year of perfect health.
A recent study conducted an actuarial analysis to estimate cost of dental benefit for Medicare beneficiaries and estimated that it would cost about $384 to provide preventive and restorative dental care per beneficiary per year (Jones & Monopoli, 2017). Among older adults with a dental visit in 2015, their average annual dental expenditures were $677 (Manski & Rohde, 2017).
There are some difficulties in directly comparing our annual economic benefit per person to these values. First, there are no data on how many years of affordable dental care would be required to prevent/restore severe tooth loss. This, however, is likely less of an issue for untreated caries. Because caries incidence can be significant in older adults, the cost of restoring untreated decay, and the derived benefit (averted economic losses) would likely be incurred in the same year and each year thereafter. One systematic review estimated that older adults experienced about one new decayed tooth surface per person per year (Griffin, Griffin, Swann, & Zlobin, 2005). The disability associated with the severe periodontitis (bleeding gums and bad breath) would also likely be prevented in the same year the treatment and costs were incurred. If we were to limit the economic benefit to untreated caries and periodontitis (conservative-case scenario), then the economic benefit from making dental care affordable would range from $81 to $727 per person.
Another issue in direct comparisons is that this analysis did not include the averted treatment costs attributable to increased uptake of preventive dental services from making dental care affordable. Increasing access to dental care could result in lower restorative expenditures, fewer emergency room visits, and savings in overall health costs. Combining findings on caries incidence (1 surface), the percentage of caries typically averted with fluoride (25%) (Griffin, Regnier, Griffin, & Huntley, 2007), and the cost of 1-surface composite restoration ($190) (American Dental Association, Health Policy Institute, 2018), suggests that the savings in direct treatment costs per averted tooth surface with caries would be over $47.
There is no consensus regarding acceptable thresholds for the economic value of an averted DALY. The World Health Organization has used thresholds that indicate an intervention is cost-effective if it prevented 1 DALY at a cost less than 3 times GDP per capita ($172,914 2017 US$) and as being highly cost-effective if it prevented 1 DALY at the cost of 1 time GDP per capita ($57,638 2017 US$) (Marseille, Larson, Kazi, Kahn, & Rosen, 2015). Limiting the benefits of making dental care affordable to caries and periodontitis (conservative scenario) suggests that under the WHO criteria, policies aimed at increasing dental care affordability would be highly cost-effective and cost-effective if the annual per-person cost were less than $242 and $727, respectively. Threshold values have been criticized because, on their own, they do not provide sufficient information to rank the relative values of local interventions. For a community, the best combination of health interventions will depend on local conditions, including the prevalence of various diseases/conditions and the relative costs and benefits of implementing different interventions.
We found notable disparities in self-reported dental problems and ability to afford needed dental care—One in every eight adults aged 45+ years was unable to afford needed dental care, and one in every two, and three in every four of these adults reported at least one dental symptom in base-case and generous-case scenario, respectively. Analyses of NHANES 2005–2008 data, which includes a dental exam, also found high levels of unmet dental treatment needs among older adults who were poor or racial/ethnic minorities—older adults living in poverty are over 3 times more likely to have untreated tooth decay compared with their higher income counterparts (42% vs. 13%). Prevalence of untreated caries was also at least 2 times higher in Mexican American (33%) and non-Hispanic Black (32%) than non-Hispanic White adults (18%) (Centers for Disease Control and Prevention National, Center for Health Statistics, 2011).
Recent research indicates that cost barriers to dental care have declined among younger adults and children but have remained among adults aged 45 years and older (Nasseh, Wall, & Vujicic, 2015). Another report found that eliminating financial barriers increased dental care use—higher income older adults were 3 times more likely to receive dental care than were lower income and those with dental insurance were twice as likely compared with those without dental insurance (Willink et al., 2016). Our findings suggest similar relationship between inability to afford dental care and income level and dental insurance. Adults with private dental insurance and high income were much less likely to report inability to afford dental care compared with their counterparts. Our results also found that adults aged 45 to 54 years had much higher probability and those with no teeth had half the probability of reporting unaffordable dental care compared with their counterparts, respectively, suggesting that affordability is dependent on need.
This analysis had some limitations. First, the most recent data set with the special oral health supplement containing more detailed information on dental symptoms, affordability of dental care, and dental insurance in NHIS were collected in 2008. Since 2008, however, there have been few changes in policy that would affect adult dental insurance coverage. The Medicare Modernization Act that introduced Medicare Advantage plans that could include dental benefits was passed in 2003. Although poor childless adults became eligible for Medicaid in 2014 due to the Affordable Care Act, few states provide comprehensive dental benefits—in 2018, it was only 16 states and the District of Columbia (Center for Health Care Strategies, 2018). Between 2008 and 2015, the percentage of adults aged 65+ years with dental insurance increased slightly from 32.6 (standard error = 1.1) to 38.4 (1.2) and the percent with a past year dental visit remained relatively stable, 43.9 (1.2) to 46.7 (1.1) (Manski & Rohde, 2017). In addition, studies examining untreated dental disease, another measure of access, suggest that untreated caries prevalence has remained the same among working-aged (about 40%) (Centers for Disease Control and Prevention, 2019) and older adults (about 28%) (Griffin et al., 2019). The latter study also found that disparities by income had actually increased from 1999–2004 to 2011–2016 (Griffin et al., 2019). Second, the age range, 45+ years used in our analysis does not map directly to the age groups covered by government payment mechanism that could address dental care affordability. Including dental care as a Medicare benefit would primarily increase access among persons aged 65+ years and including comprehensive dental benefits to low-income adults through Medicaid in all states would increase access among low-income adults below age 45 years. Another limitation is that we used self-reported symptoms to estimate the prevalence of dental conditions. An analysis of the 2009–2010 National Health and Nutrition Examination Survey data found that the self-reported measures performed well in predicting periodontitis in U.S. adults (85% sensitivity and 58% specificity; Eke et al., 2013). This suggests that our results maybe are conservative—persons with the condition tend to underreport and persons without the condition will typically not falsely report they have the condition. Furthermore, there may be other oral health conditions that can lead to poor quality of life but we only used three conditions listed by GBD to determine DALYS—leaning toward further conservative estimates. Finally, to avoid double counting in quantifying the association between affordable dental care and quality of life, we had to run a separate regression for each possible combination of dental symptoms. Running multiple regressions increases the probability of finding a false positive association between dental care affordability and reporting at least one of the dental symptoms.
In conclusion, many adults aged 45 years and older are unable to afford dental care. Affordable dental care can reduce the probability of dental problems among these adults, improve their quality of life, and be a good societal investment.
Funding
The authors received no financial support for the research, authorship, and/or publication of this article.
Footnotes
Declaration of Conflicting Interests
The authors declared no potential conflicts of interest with respect to the research, authorship, and/or publication of this article.
References
- American Dental Association, Health Policy Institute. (2018). 2018 survey of dental fees. Chicago, IL. Retrieved from https://success.ada.org/en/practice-management/finances/survey-of-dental-fees [Google Scholar]
- Bieler GS, Brown GG, Williams RL, & Brogan DJ (2010). Estimating model-adjusted risks, risk differences, and risk ratios from complex survey data. American Journal of Epidemiology, 171, 618–623. doi: 10.1093/aje/kwp440 [DOI] [PubMed] [Google Scholar]
- Center for Health Care Strategies. (2018). Medicaid adult dental benefits: An overview. Retrieved from https://www.chcs.org/media/Adult-Oral-Health-Fact-Sheet_011618.pdf
- Centers for Disease Control and Prevention. (2019). Oral health surveillance report: Trends in dental caries and sealants, tooth retention, and edentulism, United States, 1999–2004 to 2011–2016. Atlanta, GA: Centers for Disease Control and Prevention, U.S. Department of Health and Human Services. [Google Scholar]
- Centers for Disease Control and Prevention, National Center for Health Statistics. (2011). Health, United States, 2011: Table 76: Untreated dental caries, by selected characteristics: United States, selected years 1971–1974 through 2005–2008. Retrieved from https://www.cdc.gov/nchs/data/hus/2011/076.pdf
- Centers for Medicare & Medicaid Services. (2019). National health expenditure data: NHE fact Sheet. Baltimore, MD: Author. Retrieved from https://www.cms.gov/research-statistics-data-and-systems/statistics-trends-and-reports/nationalhealthexpenddata/nhe-fact-sheet.html [Google Scholar]
- Dye B, Thornton-Evans G, Li X, & Iafolla T (2015). Dental caries and tooth loss in adults in the United States, 2011–2012. NCHS Data Brief, 197, 1–3. [PubMed] [Google Scholar]
- Eke PI, Dye BA, Wei L, Slade GD, Thornton-Evans GO, Beck JD, …Genco RJ (2013). Self-reported measures for surveillance of periodontitis. Journal of Dental Research, 92, 1041–1047. doi: 10.1177/0022034513505621 [DOI] [PubMed] [Google Scholar]
- Glick M, Williams DM, Kleinman DV, Vujicic M, Watt RG, & Weyant RJ (2016). A new definition for oral health developed by the FDI World Dental Federation opens the door to a universal definition of oral health. British Dental Journal, 221, 792–793. doi: 10.1038/sj.bdj.2016.953 [DOI] [PubMed] [Google Scholar]
- Griffin SO, Griffin PM, Li CH, Bailey WD, Brunson D, & Jones JA (2019). Changes in older adults’ oral health and disparities: 1999 to 2004 and 2011 to 2016. Journal of the American Geriatrics Society. Advance online publication. doi: 10.1111/jgs.15777 [DOI] [PMC free article] [PubMed] [Google Scholar]
- Griffin SO, Griffin PM, Swann JL, & Zlobin N (2005). New coronal caries in older adults: Implications for prevention. Journal of Dental Research, 84, 715–720. doi: 10.1177/154405910508400806 [DOI] [PubMed] [Google Scholar]
- Griffin SO, Jones JA, Brunson D, Griffin PM, & Bailey WD (2012). Burden of oral disease among older adults and implications for public health priorities. American Journal of Public Health, 102, 411–418. doi: 10.2105/AJPH.2011.300362 [DOI] [PMC free article] [PubMed] [Google Scholar]
- Griffin SO, Regnier E, Griffin PM, & Huntley V (2007). Effectiveness of fluoride in preventing caries in adults. Journal of Dental Research, 86, 410–415. doi: 10.1177/154405910708600504 [DOI] [PubMed] [Google Scholar]
- Jones JA, Kressin NR, Miller DR, Orner MB, Garcia RI, & Spiro A III. (2004). Comparison of patient-based oral health outcome measures. Quality of Life Research, 13, 975–985. [DOI] [PubMed] [Google Scholar]
- Jones JA, & Monopoli M (2017). Designing a new payment model for oral care in seniors. Compendium of Continuing Education in Dentistry, 38, 616–624. [PubMed] [Google Scholar]
- Jones JA, Spiro A 3rd., Miller DR, Garcia RI, & Kressin NR (2002). Need for dental care in older veterans: Assessment of patient-based measures. Journal of the American Geriatrics Society, 50, 163–168. [DOI] [PubMed] [Google Scholar]
- Kelekar U, & Naavaal S (2018). Hours lost to planned and unplanned dental visits among U.S. adults. Preventing Chronic Disease, 15, E04. doi: 10.5888/pcd15.170225 [DOI] [PMC free article] [PubMed] [Google Scholar]
- Manski RJ, Moeller J, Schimmel J, St. Clair PA, Chen H, Magder L, & Pepper JV (2010). Dental care coverage and retirement. Journal of Public Health Dentistry, 70, 1–12. doi: 10.1111/j.1752-7325.2009.00137.x [DOI] [PMC free article] [PubMed] [Google Scholar]
- Manski RJ, & Rohde F (2017). Dental services: Use, expenses, source of payment, coverage and procedure type, 1996–2015 (Research Findings No. 38). Retrieved from https://meps.ahrq.gov/data_files/publications/rf38/rf38.pdf
- Marcenes W, Kassebaum NJ, Bernabe E, Flaxman A, Naghavi M, Lopez A, & Murray CJ (2013). Global burden of oral conditions in 1990–2010: A systematic analysis. Journal of Dental Research, 92, 592–597. doi: 10.1177/0022034513490168 [DOI] [PMC free article] [PubMed] [Google Scholar]
- Marseille E, Larson B, Kazi DS, Kahn JG, & Rosen S (2015). Thresholds for the cost-effectiveness of interventions: Alternative approaches. Bulletin of the World Health Organization, 93, 118–124. doi: 10.2471/BLT.14.138206 [DOI] [PMC free article] [PubMed] [Google Scholar]
- Naavaal S, Barker LK, & Griffin SO (2017). The effect of health and dental insurance on U.S. children’s dental care utilization for urgent and non-urgent dental problems—2008. Journal of Public Health Dentistry, 77, 54–62. doi: 10.1111/jphd.12171 [DOI] [PMC free article] [PubMed] [Google Scholar]
- Nasseh K, Wall T, & Vujicic M (2015). Cost barriers to dental care continue to decline, particularly among young adults and the poor. Retrieved from http://www.ada.org/~/media/ADA/Science%20and%20Research/HPI/Files/HPIBrief_1015_2.ashx
- Pew Research Center. (2010). Baby boomers retire. Retrieved from http://www.pewresearch.org/daily-number/baby-boomers-retire/
- U.S. Department of Health and Human Services. (2000). Oral health in America: A report of the surgeon general. Rockville, MD: National Institutes of Health. [Google Scholar]
- Vujicic M, Buchmueller T, & Klein R (2016). Dental care presents the highest level of financial barriers, compared to other types of health care services. Health Affairs, 35, 2176–2182. doi: 10.1377/hlthaff.2016.0800 [DOI] [PubMed] [Google Scholar]
- Willink A, Schoen C, & Davis K (2016). Dental care and Medicare beneficiaries: Access gaps, cost burdens, and policy options. Health Affairs, 35, 2241–2248. doi: 10.1377/hlthaff.2016.0829 [DOI] [PubMed] [Google Scholar]