

Abstract
Purpose:
To identify precursors of macular atrophy (MA) and of fibrotic scar (FS) in eyes treated with anti-VEGF through pixel-mapping analysis of baseline OCT.
Methods:
Design:
Cross-sectional analysis.
Setting:
Multicenter clinical trial.
Patient population:
68 eyes from the Comparison of Age-Related Macular Degeneration Treatments Trials.
Intervention:
Treatment with anti-VEGF agents.
Main outcome measure:
The percentage of MA or FS pixels with each OCT feature at baseline, and the odds ratio (OR) for baseline pixels with an OCT feature to develop MA or FS.
Results:
RPE atrophy and photoreceptor loss on OCT were highly predictive of MA at that location at years 2 and 5 (p<0.0001), but accounted for only 22.5% of the ensuing atrophy at year 2 and less at year 5. Among pixels of MA at year 2, 78% were preceded by thick drusen, 54% by subretinal macular neovascularization (MNV), and 22.5% by no detectable OCT features. MNV, subretinal hyperreflective material (SHRM), pigment epithelial detachment (PED), intraretinal fluid, and sub-RPE fluid were predictive of FS at that location (p-values<0.05). More than 75% of the pixels of FS at years 2 and 5 were preceded by pixels of baseline MNV.
Conclusions:
Most pixels of FS were preceded by components of neovascularization. While one-quarter of MA was accounted for by pre-existing evidence of atrophy on OCT alone, development of MA in areas of thick drusen, areas with and without subretinal MNV lesion, and areas without detectable OCT precursors argues that development of MA is multifactorial and may follow, in part, a non-neovascular pathway.
Table of Contents Statement
Data from optical coherence tomography scans, color fundus photographs, and fluorescein angiograms were used to identify the localized OCT precursors mapping to exact pixels of ensuing atrophy and scar in eyes treated with anti-VEGF in the Comparison of Age-related Macular Degeneration Treatments Trials. This data enabled identification of localized OCT precursors present at baseline in an exact pixel location that later develops macular atrophy (MA) or fibrotic scar (FS).
Introduction
Despite a rapid reduction in retinal fluid and early visual recovery in eyes treated with anti-vascular endothelial growth factor (anti-VEGF) for neovascular age-related macular degeneration (nAMD), data from the Comparison of AMD Treatment Trials (CATT) and other studies confirm visual acuity initially improves, but then declines with time.1,2 Such sustained visual acuity loss is more likely to occur in the presence of scarring and atrophy.3,4 It is crucial to understand the micro-anatomic precursors of scarring and atrophy to stratify risk, to guide prognosis, and to develop new therapeutic agents.
Prior studies show that atrophy and scar often develop by 2 years after initiation of anti-VEGF therapy, with further development by 5 years.5,6 The association between baseline color photographic (CP) and fluorescein angiographic (FA) findings and the risk of atrophy and scar has been previously described. Scar was associated with a larger baseline macular neovascular (MNV) area, blocked fluorescence on FA, and contiguous hemorrhage associated with the lesion on color photography.6 In 2008 at the start of the CATT study, macular atrophy (MA) was originally designated as geographic atrophy (GA) based on CP and FA findings.5,7 In these studies, GA was associated with subfoveal MNV, GA in the fellow eye, and retinal angiomatous proliferation (RAP).5 These same studies also looked at macula-wide characteristics on optical coherence tomography (OCT) that may be associated with scar or GA. Baseline subretinal fluid (SRF) was associated with a decreased risk of GA while baseline intraretinal fluid (IRF) was associated with an increased risk of GA.5 Subretinal hyperreflective material (SHRM), greater retinal thickness, and greater subretinal tissue complex thickness (defined as SHRM, RPE, and RPE elevation) were more common in eyes with FS.6 Correlating photographic and macula-wide characteristics on OCT with the development of MA (the term that will be used throughout this paper in place of GA) and scar may identify eyes at risk for vision loss. However, there is a need for more precise integrated analysis of structural features to find biomarkers that can guide more individualized treatment in nAMD.8
OCT images that reveal the retinal and subretinal micro-anatomic precursors of fibrosis and atrophy may lead to a better understanding of the local pathophysiology contributing to these outcomes. Pixel-watching-over-time analysis9 allows us to follow and compare multiple precursors of individual areas of atrophy and scar. We hypothesized that localized markers on OCT prior to the initiation of anti-VEGF treatment would predict subsequent areas of atrophy versus scar. Such markers would help the physician identify potential locations for atrophy and fibrosis, which can impact vision loss after the initiation of treatment for nAMD.
Methods
Enrollment criteria, participants, and methods of CATT have been described in prior publications10 and at the ClinicalTrials.gov website (NCT00593450). The study was approved by an institutional review board at each center, and was compliant with the Health Insurance Portability and Accountability Act.
At baseline, patients underwent CP, FA, and time-domain OCT (TD-OCT, Stratus, Carl Zeiss Meditech, Dublin, CA). Imaging was repeated at 2 and 5 years. Year 2 scans were captured either with TD-OCT or spectral domain-OCT (SD-OCT, Cirrus [Carl Zeiss Meditech, Dublin, CA] or Spectralis [Heidelberg Engineering, Heidelberg, Germany]) and year 5 scans were captured with SD-OCT.1,7 Photographic images were evaluated by the Scheie Image Reading Center at the University of Pennsylvania; OCT images were evaluated by the Duke Reading Center; the locations of specific OCT findings were delineated by readers in the Duke Advanced Research in SS/SDOCT Imaging (DARSI) Laboratory. Readers at each center were masked to the assessment from the other center. Qualitative and quantitative grading of characteristics on OCT in CATT have been shown to have good reproducibility.11,12
Seventy eyes of 70 participants at the 104-week CATT visit were selected for analysis. Of these, the OCT and fundus photographic quality was not adequate in 2 eyes, and these eyes were excluded from the baseline and follow-up analysis. The sample of eyes for this study was designed to provide information on the four main features identifiable on fundus photography (stereo color and fluorescein angiographic images): geographic atrophy, non-geographic atrophy, fibrotic scar, and non-fibrotic scar. These features were classified based on the Week 104 images. A random sample of 10 eyes was selected from among those that had the feature in the fovea and of 5 eyes from among those with the feature in an extrafoveal location. Finally, a random sample of 10 eyes was drawn from those that had 2 or more of the 4 features of interest outside the foveal center at week 104. Of these 68 eyes, 32 had follow-up at year 5 and were included in the year 5 analysis.
Terminology
In CATT, based on color photographs and FA, the definition of GA was “sharply defined areas of partial or complete depigmentation of the RPE larger than 250 μm, typically exposing the choroidal blood vessels with late FA showing well-circumscribed areas of hyperfluorescence corresponding to the hypopigmented areas on the color image”.5,13 The photographic and angiographic appearance of atrophy in eyes with nAMD may not be distinguishable from the atrophy of end-stage dry AMD.14,15 We agree with Classification of Atrophy Meetings (CAM) group and others that the overarching term macular atrophy (MA) is more appropriate to describe atrophy arising in eyes with nAMD such as those analyzed in this study.14,16,17 Therefore, the term MA throughout this paper refers to areas previously defined as GA in CATT. Non-geographic atrophy in CATT was defined as an area of atrophy that did not meet the definition of GA and will be referred to as N-MA in this paper. More specifically, as defined in prior CATT studies, the border of N-MA is “not sharply defined and choroidal vessels are not visible” as they are with MA. Additionally, when “the areas of hyperfluorescence do not correspond exactly to pigmentary changes on color images”, they are included as N-MA.13
Fibrotic scar was defined in CATT based on color photographs and FA as “mounds of white or yellowish material on color photographs; on fluorescein angiography, some fibrotic scars or portions of the scar may be hyperfluorescent and stain, whereas other scars might obstruct the view of the underlying choroidal flush and would, therefore be hypofluorescent”.6 Non-fibrotic scar in CATT was defined as “an area of flat hypopigmentation partially or completely surrounded by an area of hyperpigmentation on color images with corresponding hyperfluorescence and hypofluorescence on FA”.6
Image analysis
The image analysis methods were developed using a subset of images from CATT. The details of this image analysis were described in a previously published methods paper and are summarized here.9 Areas of MA, N-MA, FS and NFS were marked on FA within a 6 mm foveally centered circular region based on the review of the CP and FA images together. On OCT, local retinal and subretinal features were marked and segmented.
Multiple features were marked on baseline OCT: RPE atrophy with choroidal hypertransmission (called RPE atrophy), photoreceptor layer loss (PR loss), subretinal highly reflective material (SHRM), non-drusenoid pigment epithelial detachment (PED), indeterminate SHRM/PED, intraretinal fluid (IRF), subretinal fluid (SRF), and subRPE fluid as defined in Supplemental Table 1 based on prior definitions.9 OCT features could be co-localized at the same pixel location (e.g. IRF could be co-localized with SHRM), except for RPE atrophy without MNV lesion. RPE atrophy without MNV lesion could not be present at the same pixel location as SHRM, PED, indeterminate SHRM/PED, subRPE fluid, and RPE atrophy with MNV lesion.
Custom MATLAB software (CATTREG version 2.9, developed by Stephanie J. Chiu of the DARSI Laboratory) was then used to register and compare OCT markings side by side with CP or FA markings. The overlays of the OCT scan at baseline with the CP/FA data were used to determine the presence or absence of each OCT feature listed above and the presence or absence of atrophy or scar on CP/FA for each pixel analyzed. The OCT volumes varied in scan density and pixel resolution. For Stratus, 6 radial scans were acquired and used for the analysis. For Spectralis, volume scans with 49 or 97 B-scans were analyzed, and for Cirrus macular cubes with 128 B-scans were assessed. Both OCT and FA data were standardized to 1001 × 1001 pixel matrix maps centered at the fovea to facilitate comparison. An in depth explanation of this standardization and registration process is described in a previously published methods paper and an image in that paper demonstrates this process.9 After image registration and standardization, the program output a data table containing each pixel’s location on the standardized grid and a binary value specifying whether the OCT, CP, or FA component was present or absent for that pixel.
Cirrus and Spectralis volumes were segmented semi-automatically using Duke OCT Retinal Analysis Program Marking Code version 63.6 to obtain thickness measurements for the neurosensory retinal thickness18,19 and subretinal lesion complex termed the retinal pigment epithelium plus drusen plus lesion complex (RPEDLC).4,9,12,20–22 The thickness was categorized relative to the mean thickness at that foveally centered location based on a dataset from 110 eyes of control participants without AMD from the AREDS2 (Age-Related Eye Disease Study 2) ancillary SDOCT study.18
Statistical analysis
We described the association between OCT features at baseline and incidence of MA, or FS during follow-up in two complementary ways: 1) identifying pixels of MA, and FS at 2 and 5 years and calculating the percentage of pixels with a particular OCT feature at baseline; 2) identifying pixels of each OCT feature at baseline and evaluating the probability of those pixels having MA, and FS at 2 and 5 years. The association between the baseline OCT feature with the development of MA, or FS (compared to pixels without the feature) was summarized with the odds ratio (OR), 95% confidence interval (95% CI), and associated p-value using pixels without this particular OCT feature as the reference group. Estimates were made using logistic regression models with generalized estimating equations to accommodate the correlation between pixels in the same eye of each person. P-values less than 0.05 were considered statistically significant. Statistical computations were performed with SAS software, version 9.4 (SAS Institute).
Results:
Sixty-eight eyes of 68 participants were included in the analysis at year 2 and 32 eyes at year 5. The mean age of the participants was 78±7 years (range 64–94 years). Thirty-nine (57%) patients were female. Sixty-seven (99%) patients identified as “white” and one (1%) patient identified as “other”. Twenty-six (38%) patients were never smokers, 37 (54%) were former smokers, and 5 (7%) patients were current smokers. Thirty-seven (54%) eyes received ranibizumab and 31 (46%) eyes received bevacizumab.
Any pixels of MA and FS at baseline were removed from the analysis as the goal of this study was to analyze precursors of new MA and FS that developed over time. At baseline, 4 eyes had small sites of MA (2,011 pixels). These comprised only 0.6% of all baseline pixels and these were dropped from the analysis. Similarly, 1 eye had any FS at baseline (157 pixels), comprising 0.05% of all baseline pixels, which were dropped from the analysis.
Twenty-five of 68 eyes (37%) had MA at year 2, of which 11 eyes had fovea involving MA. Nineteen of 32 eyes (59%) had MA at year 5, of which 9 eyes had fovea involving MA. Twenty-six of 68 eyes (38%) had FS at year 2, of which 13 eyes had fovea involving FS. Thirteen of 32 eyes (41%) had FS at year 5, of which 5 eyes had fovea involving FS.
The significant localized OCT precursors of MA and FS are summarized below with further details of the percentage of pixels of MA and FS preceded by each baseline OCT feature available in Table 1 and the predictive value for each baseline OCT feature summarized in Table 2. (Supplemental Table 2 shows the baseline pixels of each OCT feature included in the analysis).
Table 1:
Percent of macular atrophy and fibrotic scar at years 2 and 5 preceded by features on optical coherence tomography (OCT) at baseline.
| Macular Atrophy | Fibrotic Scar | |||
|---|---|---|---|---|
| Year 2 (34527 pixels in 25/68 eyes) | Year 5 (38004 pixels in 19/32 eyes) | Year 2 (34020 pixels in 26/68 eyes) | Year 5 (13577 pixels in 13/32 eyes) | |
| Baseline Localized OCT features | % preceded by baseline OCT characteristic | |||
| RPE atrophy with choroidal hypertransmission | 22.5% | 12.2% | 2.0% | 1.1% |
| RPE atrophy with lesion | 18.5% | 8.2% | 2.0% | 1.1% |
| RPE atrophy without lesion | 4.0% | 4.0% | 0.0% | 0.0% |
| Photoreceptor loss | 6.2% | 2.8% | 0.0% | 0% |
| SHRM | 40.7% | 26.9% | 58.6% | 45.8% |
| PED | 18.1% | 12.2% | 36.4% | 51.5% |
| Indeterminate SHRM/PED | 6.5% | 6.5% | 1.9% | 0.3% |
| Any MNV/subretinal lesion | 54.4% | 40.5% | 77.6% | 78.8% |
| Intraretinal fluid | 15.9% | 8.7% | 21.3% | 8.4% |
| Subretinal fluid | 11.9% | 18.3% | 24.4% | 31.4% |
| SubRPE fluid | 8.6% | 6.0% | 15.2% | 41.2% |
| Thin neurosensory retina | 9.7% | 7.2% | 4.7% | 6.7% |
| Thick neurosensory retina | 42.5% | 37.7% | 65.5% | 64.2% |
| Thin RPEDLC | 1.9% | 2.5% | 0.7% | 1.5% |
| Thick RPEDLC | 78.5% | 70.1% | 85.8% | 88.5% |
| No OCT features | 22.5% | 36.5% | 12.7% | 8.6% |
OCT = optical coherence tomography;
RPE atrophy = RPE atrophy with choroidal hypertransmission;
SHRM = subretinal hyperreflective material; PED = pigment epithelial detachment;
Any MNV/subretinal lesion = SHRM+PED+indeterminate; SubRPE = sub-retinal pigment epithelium;
RPEDLC = retinal pigment epithelium plus drusen plus lesion complex.
One eye may have geographic atrophy and fibrotic scar.
OCT features could be co-localized at the same pixel location (e.g. IRF could be co-localized with SHRM)
Table 2:
Odds ratios for areas of optical coherence tomography (OCT) features at baseline to develop into areas of macular atrophy and fibrotic scar at years 2 and 5.
| Macular Atrophy | Fibrotic Scar | |||
|---|---|---|---|---|
| Year 2 (34527 pixels in 25/68 eyes) | Year 5 (38004 pixels in 19/32 eyes) | Year 2 (34020 pixels in 26/68 eyes) | Year 5 (13577 pixels in 13/32 eyes) | |
| Baseline Localized OCT features | Likelihood of baseline OCT characteristic proceeding to MA or FS (OR (95% CI) and p-value)* | |||
| Any RPE atrophy w/choroidal hypertransmission | 7.51 (4.06,13.88) p<0.001 | 6.81 (3.16, 14.65) p<0.001 | 0.32 (0.09, 1.11) p=0.07 | 0.24 (0.04, 1.24) p=0.09 |
| RPE atrophy with lesion | 6.20 (3.14, 12.23) p<0.001 | 4.43 (2.06,9.51) p<0.001 | 0.36 (0.10, 1.26) p=0.11 | 0.30 (0.05,1.62) p=0.16 |
| RPE atrophy without lesion | 22.40 (6.84, 73.42) p<0.001 | 186.78 (56.91,612.98) p<0.001 | NA (0 pixels) | 0.03 (0.00,0.28) p=0.002 |
| Photoreceptor loss | 12.93 (6.14, 27.25) p<0.001 | 15.73 (3.49,70.83) p<0.001 | 0.04 (0.01, 0.32) p=0.002 | NA (0 pixels) |
| SHRM | 1.77 (0.97, 3.23) p=0.06 | 1.29 (0.59, 2.85) p=0.52 | 4.04 (1.81, 9.01) p<0.001 | 3.15 (0.76,12.95) p=0.11 |
| PED | 1.13 (0.56, 2.29) p=0.72 | 0.54 (0.22, 1.30) p=0.17 | 3.46 (1.32, 9.06) p=0.01 | 5.81 (1.82, 18.53) p=0.003 |
| Indeterminate SHRM/PED | 2.43 (0.88, 6.77) p=0.09 | 6.27 (2.98, 13.19) p<0.001 | 0.58 (0.15, 2.27) p=0.43 | 0.12 (0.01, 1.05) p=0.55 |
| Any MNV/subretinal lesion | 1.93 (1.07, 3.50) p=0.03 | 1.26 (0.60, 2.62) p=0.54 | 6.15 (3.02, 12.53) p<0.001 | 7.72 (3.08, 19.34) p<0.001 |
| Intraretinal fluid | 2.06 (0.93, 4.58) p=0.08 | 1.51 (0.53, 4.30) p=0.44 | 3.20 (1.64, 6.24) p<0.001 | 1.33 (0.69, 2.57) p=0.40 |
| Subretinal fluid | 0.60 (0.27, 1.37) p=0.23 | 0.91 (0.46, 1.79) p=0.77 | 1.60 (0.7,7 3.34) p=0.21 | 2.03 (0.79, 5.18) p=0.14 |
| SubRPE fluid | 1.09 (0.4,1 2.94) p=0.86 | 0.49 (0.15, 1.55) p=0.22 | 2.30 (0.51, 10.38) p=0.28 | 8.82 (2.20, 35.33) p=0.002 |
| Thin neurosensory retina | 2.35 (1.31, 4.22) p=0.01 | 1.93 (0.86, 4.35) p=0.28 | 1.70 (0.60, 4.80) p=0.003 | 3.03 (1.71, 5.35) p<0.001 |
| Thick neurosensory retina | 1.20 (0.63, 2.27) p=0.01 | 0.97 (0.60, 1.57) p=0.28 | 3.28 (1.57, 6.86) p=0.003 | 3.48 (1.25, 9.70) p<0.001 |
| Thin RPEDLC | 1.14 (0.67, 1.93) p=0.004 | 1.06 (0.61, 1.84) p=0.25 | 0.58 (0.33, 1.05) p=0.009 | 1.68 (0.78, 3.64) p=0.006 |
| Thick RPEDLC | 2.40 (1.23, 4.70) p=0.004 | 1.77 (0.88, 3.59) p=0.25 | 3.91 (1.62, 9.43) p=0.009 | 5.98 (1.76, 20.28) p=0.006 |
| No OCT features | 0.34 (0.19, 0.60) p<0.001 | 0.61 (0.33, 1.10) p=0.10 | 0.17 (0.07, 0.40) p<0.001 | 0.10 (0.04, 0.25) p<0.001 |
Odds ratio was calculated using pixels without this particular OCT feature as reference
OCT = optical coherence tomography;
RPE atrophy = RPE atrophy with choroidal hypertransmission;
SHRM = subretinal hyperreflective material; PED = pigment epithelial detachment;
Any MNV/subretinal lesion= SHRM+PED+indeterminate; SubRPE = sub-retinal pigment epithelium;
RPEDLC = retinal pigment epithelium plus drusen plus lesion complex.
One eye may have geographic atrophy and fibrotic scar.
OCT features could be co-localized at the same pixel location (e.g. IRF could be co-localized with SHRM)
Localized OCT precursors at baseline preceding MA
The localized OCT features with significantly increased likelihood of proceeding to pixels of MA at year 2 were any RPE atrophy, PR loss, any MNV lesion, thin NSR, and thick RPEDLC. RPE atrophy, PR loss, and indeterminate SHRM/PED remained predictive of MA at year 5. Of these features, thick RPEDLC preceded the largest amount of ensuing MA at both years 2 and 5 (78.5% and 70.1% respectively), though significantly predictive only at year 2 (OR 2.40).
RPE atrophy on baseline OCT, was highly predictive of ensuing MA. Of eyes with MA at year 2, 19 eyes (76%) had some RPE atrophy at baseline. Similarly, of 19 eyes with MA at year 5, 13 eyes (68%) had some RPE atrophy at baseline. At baseline, there were only small areas of RPE atrophy with or without any MNV lesion (6% of baseline pixels, present in 36 eyes) and PR loss (1% of baseline pixels, present in 15 eyes). However, these areas were highly predictive of co-localized MA at years 2 (OR 7.51) and 5 (OR 6.81). See Figure 1 for an example of MA developing in areas of baseline RPE atrophy. RPE atrophy preceded 22.5% of MA at year 2 and 12.2% at year 5. In keeping with PR loss being highly predictive of MA, atrophy was also twice as likely to occur in areas of thin NSR, though the predictive value was only significant at year 2 (OR 2.35).
Figure 1 – New macular atrophy arising from pixels of RPE atrophy with choroidal hypertransmission at baseline.
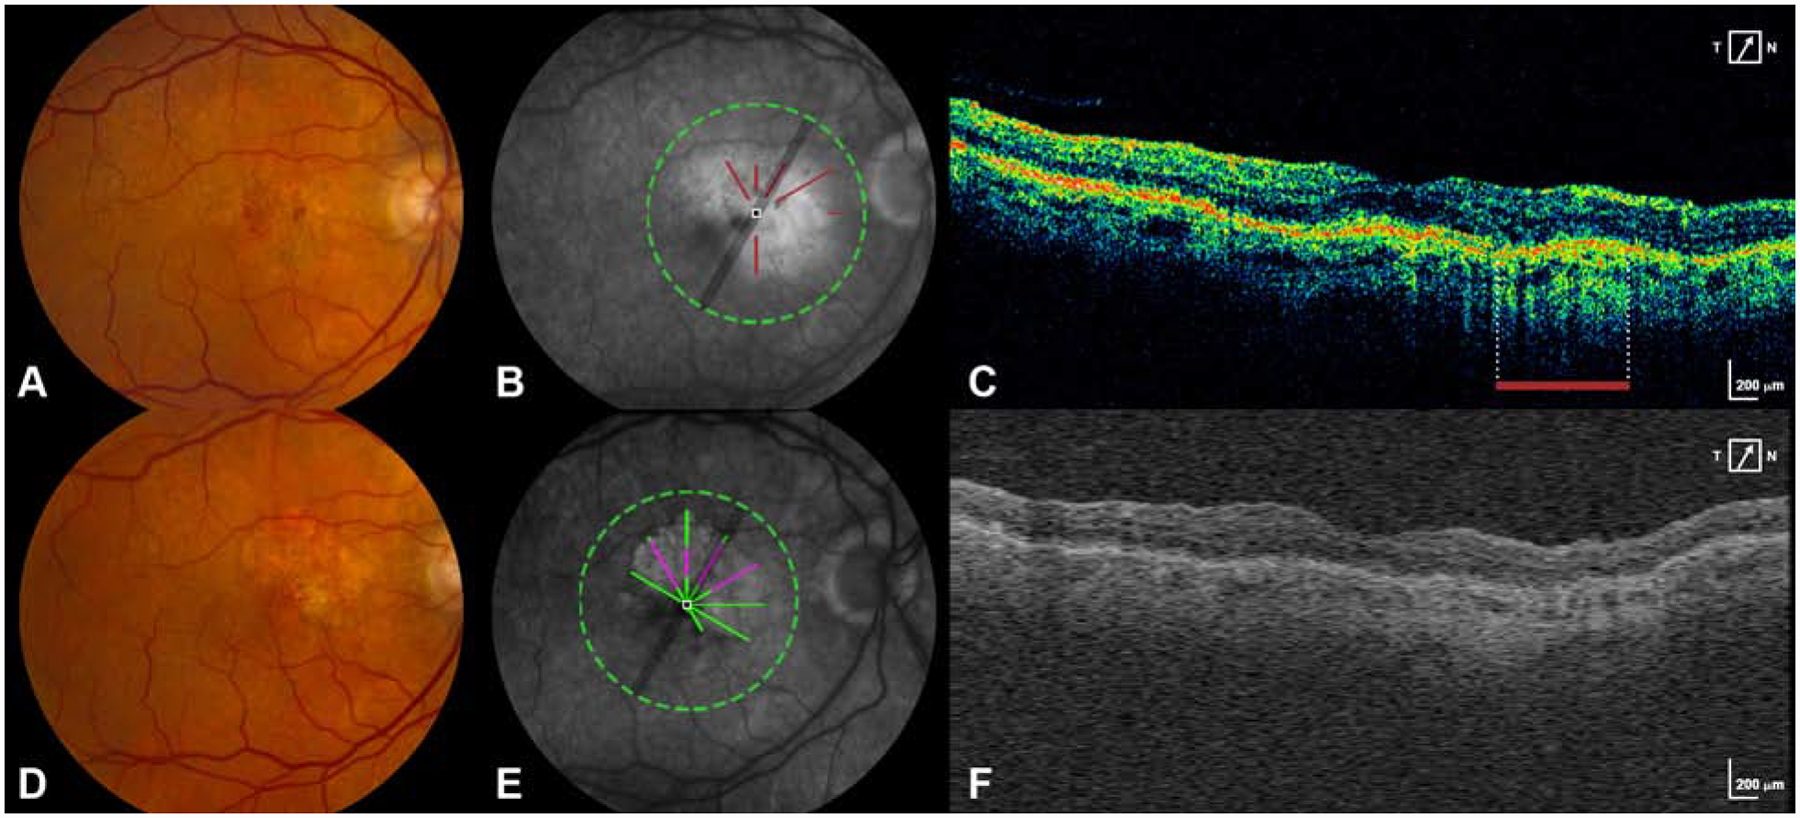
A. Baseline CFP shows an eye without macular atrophy at baseline.
B. FA at baseline is superimposed with the areas of RPE atrophy seen on the baseline OCT scan (brick red lines).
C. A B-scan from the baseline OCT scan shows the area of RPE atrophy (delineated by the brick red bar).
D. Year 2 CFP shows the development of new macular atrophy.
E. FA at year 2 is superimposed with the pixels of MA that developed at year 2 (green+magenta). Magenta represents new MA developing at year 2 in the same location as RPE atrophy on baseline OCT. Green represents new MA developing at year 2 in a location without RPE atrophy on baseline OCT.
F. A representative B scan constructed from A-scans of the year 2 SD-OCT volume.
MA at years 2 and 5 could occur almost equally in areas with baseline subretinal MNV (54.4% at year 2 and 40.5% at year 5) and areas without baseline MNV (45.6% at year 2 and 59.5% at year 5; Figure 2). However, pixels with MNV were more likely than pixels without MNV to develop into MA (OR 1.93 at year 2). Similarly, baseline pixels of MNV lesion accompanied by RPE atrophy on OCT were more predictive of MA than pixels of MNV lesion without RPE atrophy (OR 6.20 vs 1.65).
Figure 2 – New macular atrophy can arise from areas with and without preceding MNV lesion at baseline.
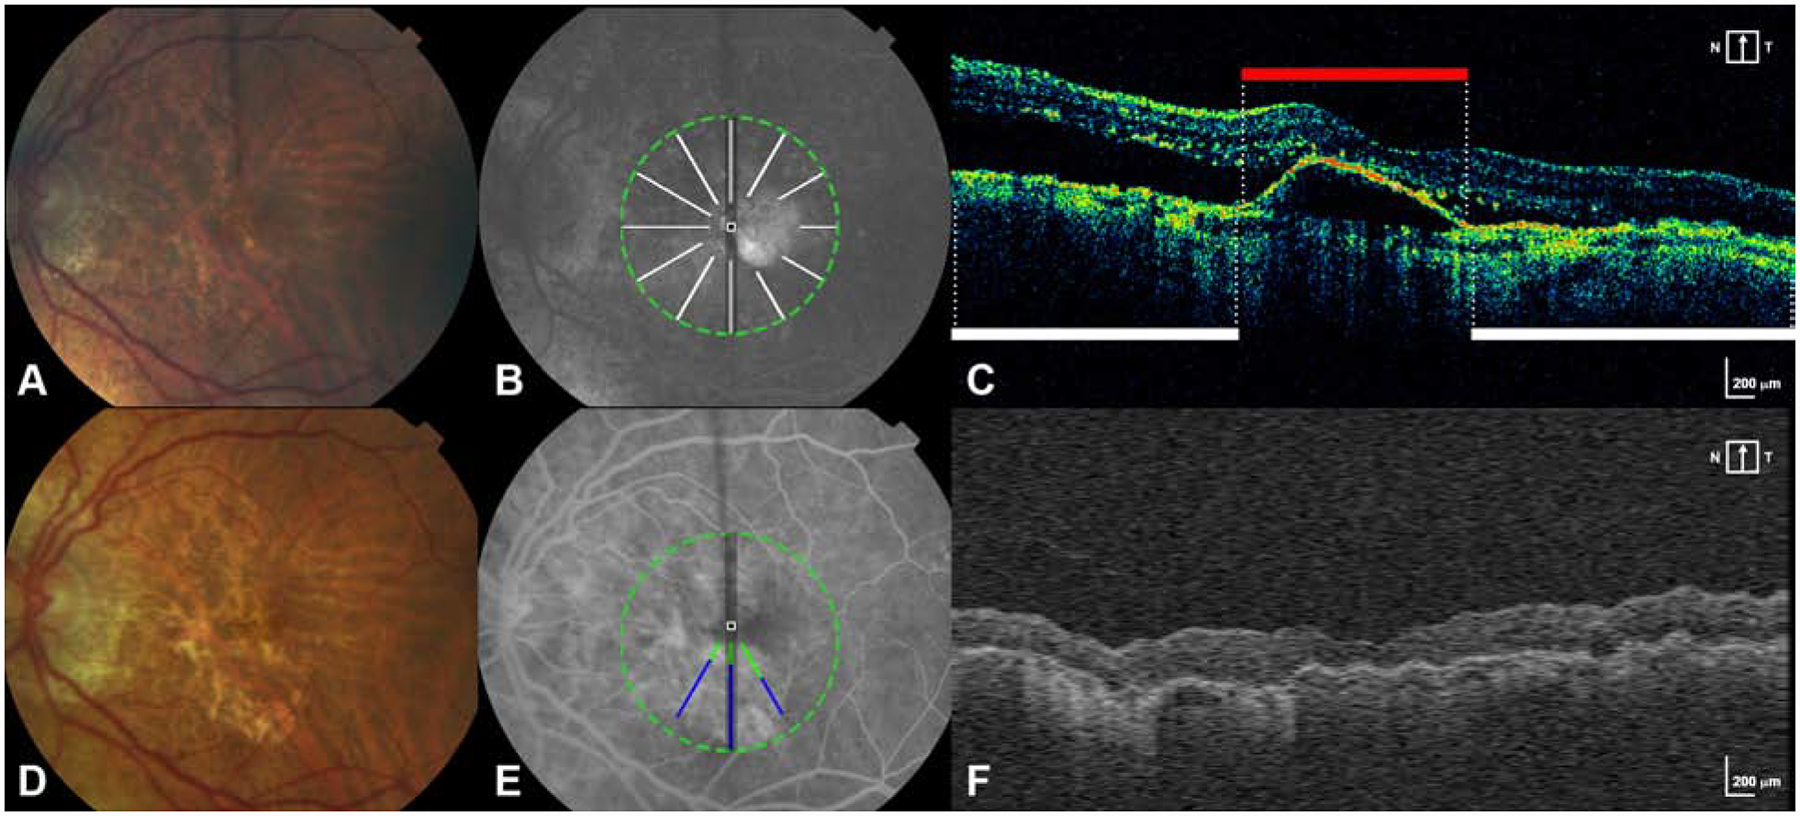
A. Baseline CFP shows an eye without macular atrophy at baseline.
B. FA at baseline is superimposed with scan areas of pixels without MNV at baseline (white lines).
C. A B-scan from the baseline OCT scan delineates area without MNV (white bar) and with MNV lesion/PED (red bar).
D. Year 2 CFP shows the development of new macular atrophy.
E. FA at year 2 is superimposed with pixels of new MA that developed at year 2 (green+blue). Blue represents new MA arising at year 2 in the same location as pixels without any MNV lesion at baseline. Green represents new MA arising at year 2 in the same location as pixels with MNV lesion at baseline.
F. A representative B scan constructed from A-scans of the year 2 SD-OCT volume.
While most areas without detectable baseline OCT features did not have atrophy at year 2, almost one quarter (22.5%) of the pixels of ensuing MA at year 2 and over one third (36.5%) of MA at year 5 were preceded by baseline areas without any detectable OCT features (Figure 3).
Figure 3 – New macular atrophy can arise from areas without any detectable OCT features at baseline.
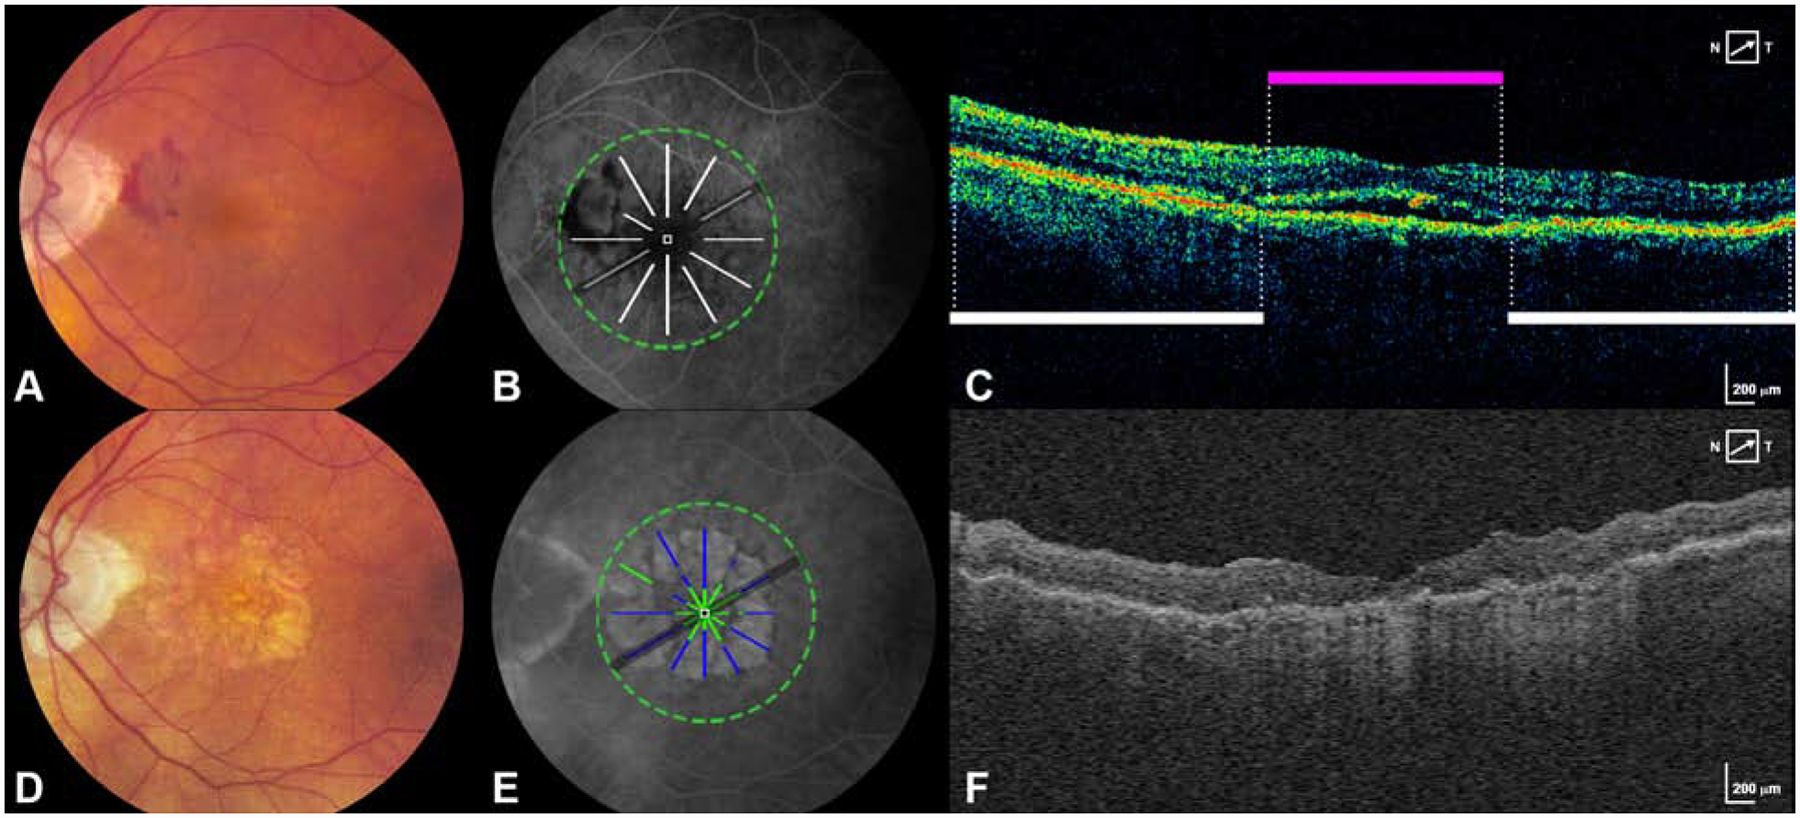
A. Baseline CFP shows an eye without macular atrophy at baseline.
B. FA at baseline is superimposed with scan areas of pixels without any detectable OCT features at baseline (white lines).
C. A B scan at baseline shows locations that were designated as subretinal fluid (magenta bar) and locations without detectable OCT features (white bars).
D. Year 2 CFP shows the development of new macular atrophy.
E. FA at year 2 is superimposed with pixels of new MA that developed at year 2 (green+blue). Blue represents new MA arising at year 2 in the same location as pixels without any detectable OCT features at baseline. Green represents new MA arising at year 2 in the same location as pixels with detectable OCT features at baseline.
F. A representative B scan constructed from A-scans of the year 2 SD-OCT volume.
Localized OCT precursors at baseline preceding FS
The localized OCT features with significantly increased likelihood of proceeding to pixels of FS at both years 2 and 5 were PED, any subretinal MNV lesion, and thick RPEDLC. A large number of baseline pixels (40%, present in 64 eyes at year 2) were composed of subretinal MNV lesion and these pixels were highly predictive of FS (OR 6.15 at year 2 and 7.72 at year 5). 77.6% of the pixels of FS at year 2 and 78.8% of the pixels of FS at year 5 were co-localized to pixels of MNV lesion at baseline. Figure 4 demonstrates pixels of FS arising from baseline areas of MNV.
Figure 4 – New fibrotic scar arises in large part from areas of MNV at baseline.
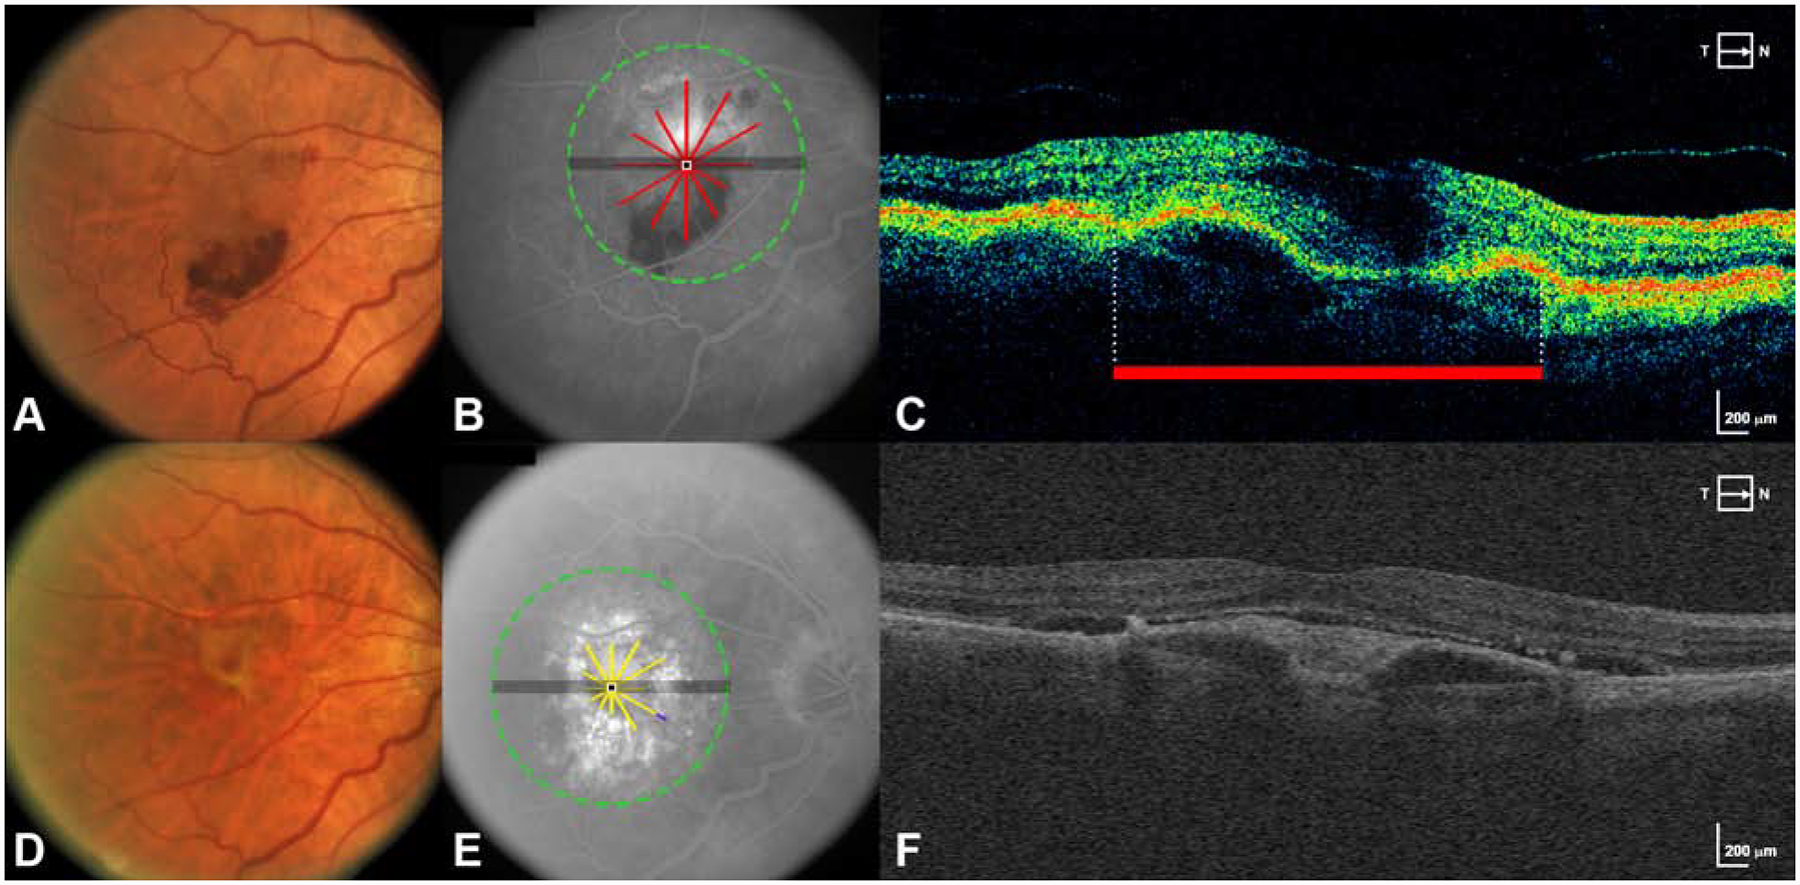
A. Baseline CFP shows an eye without fibrotic scar at baseline.
B. FA at baseline is superimposed with scan areas of pixels with MNV/subretinal lesion at baseline (red lines).
C. A B-scan from the baseline OCT scan delineates area with MNV/subretinal lesion (red bar).
D. CFP at year 2 shows the development of fibrotic scar.
E. FA at year 2 is superimposed with pixels of new FS that developed at year 2 (yellow and purple lines). Yellow is pixels of FS at year 2 arising in the same location as subretinal MNV lesion at baseline. Purple is pixels of FA at year 2 arising in locations without subretinal MNV lesion at baseline.
F. A representative B scan constructed from A-scans of the year 2 SD-OCT volume.
Pixels of IRF on baseline OCT were significantly predictive of FS only at year 2 (OR 3.20) and pixels of subRPE fluid were predictive of FS at year 5 (OR 8.82). Twenty-one percent of the FS pixels at year 2 were preceded by IRF at baseline, while subRPE fluid predicted 41.2% of year 5 FS.
Overall, thin and thick NSR at baseline were predictive of FS at years 2 and 5, but thicker NSR pixels had a stronger predictive value (OR 3.28 at year 2) and preceded a larger amount of the FS at years 2 and 5. The majority of the FS in years 2 and 5 (>80%) was preceded by localized areas of thick RPEDLC at baseline.
Pixels without any detectable OCT features at baseline were unlikely to proceed to FS at year 2 or 5 and preceded only 12.7% of the incident FS pixels at year 2 and 8.6% at year 5.
Discussion
We co-localized OCT precursors in precise pixel locations across the macula to analyze an array of characteristics that mapped to exact pixels of ensuing MA and FS at 2 and 5 years after anti-VEGF therapy. We found that the development of MA was multifactorial occurring in areas of thick RPEDLC, areas with and without MNV lesion, and areas without detectable OCT features at baseline whereas FS was most often restricted to areas of MNV lesion.
Subretinal MNV lesion (whether SHRM+PED+indeterminate), IRF, and subRPE fluid preceded the vast majority of the developing scar. Less than 10% of the incident FS at year 5 was preceded by pixels without any detectable baseline OCT abnormality. Prior studies that assessed the development of scar anywhere in the macula rather than at the same exact pixel location of developing scar, indicate SHRM, IRF, SRF, increased retinal thickness, and increased subretinal tissue complex thickness as risk factors of FS.6 Our study showed similar OCT precursors as risk factors in the exact pixel location of the developing scar: these included SHRM, IRF, thick neurosensory retina, and thick RPEDLC at baseline. However, in contrast to studies that did not colocalize SRF and FS, we found that SRF was not a precursor to FS at that location. The findings in this study corroborate prior macula-wide studies20,21,23 showing the majority of ensuing scar develops at sites of MNV lesion at baseline highlighting the unmet need for antifibrotics in nAMD patients.
Eyes analyzed in this study had similar rates of foveal atrophy as compared to the CATT group as a whole. Studies that did not colocalize various pathological features have reported that eyes with IRF and larger MNV area were at increased risk of MA, while SRF was associated with less atrophy.5,24 Our study did not support IRF as a localized predictor of MA sites; however, the study may not have been powered to detect the local impact as IRF was present only in 9% of pixels at baseline. Alternatively, IRF may instead be a macula-wide marker of some aspect of the genetics or type of nAMD. The presence of SRF in CATT as well as other studies is associated with less risk of MA and better visual outcomes.24–27 Similarly, there was no significant association between co-localized SRF in this study and the risk of developing MA. The mechanism by which subretinal fluid protects against MA is unknown, however the ELM remains intact potentially serving as a barrier to SRF8 and there is less disruption of the outer retinal layers than in the presence of IRF.27 In addition, it has been proposed that subclinical MNV that might produce SRF could provide nutrient support that protects against MA.28
Our study showed key differences to previously described macula-wide predictors of MA. The observation in macula-wide studies that larger MNV area was associated with ensuing MA was in part corroborated by our analysis; however, we saw that pixels of incident MA in eyes treated with anti-VEGF agents could also occur in areas without a pre-existing MNV lesion on baseline OCT. While pixels with subretinal MNV lesion were more predictive of MA than pixels without subretinal MNV lesion on baseline OCT, about 50% or more of the MA at years 2 and 5 arose from areas without MNV lesion. Also contrary to the macula-wide studies, thick RPEDLC was not only predictive of MA at year 2 but areas of thick rather than thin RPEDLC preceded the vast majority of MA (78.5% preceded by thick versus 1.9% preceded by thin). The thick RPEDLC could include areas of lesion or areas of large drusen, and it is important to note that the latter was not an OCT lesion feature.
While many believe that incident atrophy in eyes with nAMD occurs in areas of prior MNV, the site and pathophysiology of developing atrophy in relation to baseline subretinal MNV lesion has not clearly been established and diverse hypotheses remain. A post-hoc analysis from the TREX-AMD study showed that atrophy, while occurring more frequently in areas with baseline MNV, could also be observed in areas beyond the MNV.29 Another study showed MA could occur both within and outside the bounds of MNV, but MA occurring outside the bounds of MNV was likely to be enlargement of pre-existing MA unrelated to the MNV lesion.30 Others hypothesize that nAMD and geographic atrophy have overlap and atrophy may be the final common pathway of AMD with the neovascular process intercepting the process in some eyes.17 Different mechanisms may lead to the advancement of atrophy in areas over lesion and outside lesion such as atrophy due to exudation itself, neurotoxic effects of anti-VEGF, or progression of underlying dry AMD.26,29,31 Notably, large drusen volume may be a predictor for progression for AMD.32–35 Our study indicates new MA occurring after anti-VEGF treatment does not occur solely in the area of pre-existing MNV lesion, or in areas of pre-existing atrophy, as seen on OCT. A large amount of the ensuing atrophy was preceded by thick RPEDLC that was not just accounted for by subretinal MNV lesion alone and likely includes large drusen. Thus, atrophy could be an underlying progression of the non-neovascular AMD component (e.g. in areas without lesion but with thick drusen) and also a pattern that develops over areas of lesion. These findings point to the importance of the use of multimodal imaging with mapping of lesions and atrophy to further elucidate the relationship of MNV lesion to ensuing atrophy.36
As our definition of atrophy shifts from one previously defined by photographic and angiographic features to one defined by OCT features, there is added benefit to using OCT features to study outcomes and precursors. A consensus group recently published an OCT-based definition for OCT atrophy in AMD and applied the term “complete RPE and outer retinal atrophy” (cRORA) to OCT findings of hypertransmission, RPE attenuation, and photoreceptor degeneration which could refer to areas with or without lesion and was not further sub-defined.14 OCT-based definitions of atrophy should be considered in future studies.
Our study has limitations. The use of time domain OCT could have created potential visualization and grading barriers on OCT. However, those OCTs that were not felt to be adequate to grade for the OCT features assessed in this study were eliminated from the analysis. Additional variables that may be present on SD-OCT cannot be addressed in this study due to the limitations in TD-OCT imaging to visualize microstructures such as the external limiting membrane and ellipsoid zone and because of the extent of the area covered by OCT scans we may miss features such as hyperreflective foci present outside of the OCT-imaged area. Lastly, potential bias could have been introduced by Readers who assessed CP and angiographic findings as these Readers could reference year 2 findings when determining year 5 findings.
Overall, our study to examine pixel by pixel precursors of atrophy and scar added new insights not evident in prior macula-wide studies, particularly as related to MA. While pixels of FS were likely to be preceded by similar macula-wide and baseline localized OCT precursors such as SHRM and PED; new MA could occur in areas without a pre-existing neovascular lesion but often with a thickened subretinal-drusen-lesion complex. The development of MA in areas with and without MNV lesion, with thick RPEDLC, and in areas without detectable time domain OCT precursors at baseline argues there are other factors at play in the development of atrophy in eyes with nAMD, such as the natural progression of non-neovascular AMD from thick drusen to atrophy. New OCT findings such as vessel patterns on OCT angiography or intra-drusen or intralesional components that were not discerned here may be addressed in future imaging studies to further identify loci protective of or predictive of incident atrophy in eyes with nAMD.
Supplementary Material
Highlights.
Fibrotic scar was most likely to be preceded by components of neovascularization (MNV).
Macular atrophy (MA) development is less predictable and likely multifactorial.
New MA was seen in areas with and without prior MNV and in areas of thick drusen.
Acknowledgments:
Stephanie J. Chiu of DARSI laboratory for her work on the CATTREG V2.9 software.
Funding:
Supported by cooperative agreements U10 EY017823, U10 EY017825, U10 EY017826, U10 EY017828, and U10 EY023530 from the National Eye Institute, National Institutes of Health, Department of Health and Human Services, Bethesda, Maryland. The funding organization participated in the design and conduct of the study and review of the manuscript.
ClinicalTrials.gov number NCT00593450.
Abbreviations and acronyms used in manuscript:
- OCT
optical coherence tomography
- CATT
Comparison of Age-related macular degeneration Treatment Trials
- CP
color fundus photograph
- FA
fluorescein angiography
- GA
geographic atrophy
- MA
macular atrophy
- FS
fibrotic scar
- NGA
non-geographic atrophy
- NFS
non-fibrotic scar
- MNV
macular neovascularization
- cRORA
complete RPE and outer retinal atrophy
- PR
photoreceptor
- SHRM
subretinal hyperreflective material
- PED
pigment epithelial detachment
- IRF
intraretinal fluid
- SRF
subretinal fluid
- RPE
retinal pigment epithelium
- RPEDLC
retinal pigment epithelium + drusen + lesion complex
- VEGF
vascular endothelial growth factor
- AMD
age-related macular degeneration
- nAMD
neovascular age-related macular degeneration
Footnotes
Publisher's Disclaimer: This is a PDF file of an unedited manuscript that has been accepted for publication. As a service to our customers we are providing this early version of the manuscript. The manuscript will undergo copyediting, typesetting, and review of the resulting proof before it is published in its final form. Please note that during the production process errors may be discovered which could affect the content, and all legal disclaimers that apply to the journal pertain.
Disclosures:
Avni P. Finn: Allergan (Advisory board), Genentech (Advisory board)
Maxwell Pistilli: none
Vincent Tai: none
Ebenezer Daniel: none
Gui-shuang Ying: Chengdu Kanghong Biotech co. Ltd: Code C (Biostatistical Consultant); Ziemer Ophthalmic Systems AG (Biostatistical consultant).
Maureen G. Maguire: Genentech/Roche (Data and Safety Monitoring Committee)
Juan E. Grunwald: none
Daniel F. Martin: none
Glenn J. Jaffe: Novartis (Consultant), Neurotech (Consultant), Regeneron (Consultant), Iveric (Consultant).
Cynthia A. Toth: Alcon Laboratories, unrelated royalties, unlicensed patents on OCT analyses
References:
- 1.Comparison of Age-related Macular Degeneration Treatments Trials (CATT) Research Group. Five-Year Outcomes with Anti-Vascular Endothelial Growth Factor Treatment of Neovascular Age-Related Macular Degeneration. Ophthalmology. 2016;123(8):1751–1761. doi: 10.1016/j.ophtha.2016.03.045 [DOI] [PMC free article] [PubMed] [Google Scholar]
- 2.Rofagha S, Bhisitkul RB, Boyer DS, Sadda SR, Zhang K, SEVEN-UP Study Group. Seven-Year Outcomes in Ranibizumab-Treated Patients in ANCHOR, MARINA, and HORIZON. Ophthalmology. 2013;120(11):2292–2299. [DOI] [PubMed] [Google Scholar]
- 3.Jaffe GJ, Ying G-S, Toth CA, et al. Macular Morphology and Visual Acuity in Year Five of the Comparison of Age-related Macular Degeneration Treatments Trials (CATT). Ophthalmology. September 2018. [DOI] [PMC free article] [PubMed] [Google Scholar]
- 4.Ying G, Kim BJ, Maguire MG, et al. Sustained Visual Acuity Loss in the Comparison of Age-Related Macular Degeneration Treatments Trials. JAMA Ophthalmol. 2014;132(8):915. [DOI] [PMC free article] [PubMed] [Google Scholar]
- 5.Grunwald JE, Daniel E, Huang J, et al. Risk of Geographic Atrophy in the Comparison of Age-related Macular Degeneration Treatments Trials. Ophthalmology. 2014;121(1):150–161. [DOI] [PMC free article] [PubMed] [Google Scholar]
- 6.Daniel E, Toth CA, Grunwald JE, et al. Risk of Scar in the Comparison of Age-related Macular Degeneration Treatments Trials. Ophthalmology. 2014;121(3):656–666. [DOI] [PMC free article] [PubMed] [Google Scholar]
- 7.Martin DF, Maguire MG, Fine SL, et al. Ranibizumab and Bevacizumab for Treatment of Neovascular Age-related Macular Degeneration. Ophthalmology. 2012;119(7):1388–1398. [DOI] [PMC free article] [PubMed] [Google Scholar]
- 8.Schmidt-Erfurth U, Waldstein SM. A paradigm shift in imaging biomarkers in neovascular age-related macular degeneration. Prog Retin Eye Res. 2016;50:1–24. [DOI] [PubMed] [Google Scholar]
- 9.Toth CA, Tai V, Chiu SJ, et al. Linking OCT, Angiographic, and Photographic Lesion Components in Neovascular Age-Related Macular Degeneration. Ophthalmol Retin. 2018;2(5):481–493. [DOI] [PubMed] [Google Scholar]
- 10.Comparison of Age-related Macular Degeneration Treatments Trials (CATT) Research Group. Ranibizumab and Bevacizumab for Neovascular Age-Related Macular Degeneration. N Engl J Med. 2011;364(20):1897–1908. [DOI] [PMC free article] [PubMed] [Google Scholar]
- 11.Folgar FA, Jaffe GJ, Ying GS, Maguire MG, Toth CA. Comparison of optical coherence tomography assessments in the comparison of age-related macular degeneration treatments trials. Ophthalmology. 2014;121(10):1956–1965.e2. doi: 10.1016/j.ophtha.2014.04.020 [DOI] [PMC free article] [PubMed] [Google Scholar]
- 12.DeCroos FC, Toth CA, Stinnett SS, et al. Optical Coherence Tomography Grading Reproducibility during the Comparison of Age-related Macular Degeneration Treatments Trials. Ophthalmology. 2012;119(12):2549–2557. [DOI] [PMC free article] [PubMed] [Google Scholar]
- 13.Grunwald JE, Pistilli M, Daniel E, et al. Incidence and Growth of Geographic Atrophy during 5 Years of Comparison of Age-Related Macular Degeneration Treatments Trials. Ophthalmology. 2017;124(1):97–104. [DOI] [PMC free article] [PubMed] [Google Scholar]
- 14.Sadda SR, Guymer R, Holz FG, et al. Consensus Definition for Atrophy Associated with Age-Related Macular Degeneration on OCT. Ophthalmology. 2018;125(4):537–548. [DOI] [PMC free article] [PubMed] [Google Scholar]
- 15.Toth CA, Tai V, Pistilli M, et al. Distribution of optical coherence tomographic features within areas of macular atrophy or scar after two years of anti-VEGF treatment for neovascular age-related macular degeneration in the Comparison of Age-related Macular Degeneration Treatments Trials. Ophthalmol Retin. [Google Scholar]
- 16.Schmitz-Valckenberg S, Sadda S, Staurenghi G, et al. Geographic atrophy: Semantic Considerations and Literature Review. Retina. 2016;36(12):2250–2264. [DOI] [PMC free article] [PubMed] [Google Scholar]
- 17.Domalpally A, Danis RP, Trane R, et al. Atrophy in Neovascular Age-Related Macular Degeneration. Ophthalmol Retin. 2018;2(10):1021–1027. [DOI] [PMC free article] [PubMed] [Google Scholar]
- 18.Farsiu S, Chiu SJ, O’Connell RV., et al. Quantitative Classification of Eyes with and without Intermediate Age-related Macular Degeneration Using Optical Coherence Tomography. Ophthalmology. 2014;121(1):162–172. [DOI] [PMC free article] [PubMed] [Google Scholar]
- 19.Chiu SJ, Izatt JA, O’Connell RV, Winter KP, Toth CA, Farsiu S. Validated Automatic Segmentation of AMD Pathology Including Drusen and Geographic Atrophy in SD-OCT Images. Investig Opthalmology Vis Sci. 2012;53(1):53. [DOI] [PubMed] [Google Scholar]
- 20.Willoughby AS, Ying G, Toth CA, et al. Subretinal Hyperreflective Material in the Comparison of Age-Related Macular Degeneration Treatments Trials. Ophthalmology. 2015;122(9):1846–1853.e5. [DOI] [PMC free article] [PubMed] [Google Scholar]
- 21.Jaffe GJ, Martin DF, Toth CA, et al. Macular Morphology and Visual Acuity in the Comparison of Age-related Macular Degeneration Treatments Trials. Ophthalmology. 2013;120(9):1860–1870. [DOI] [PMC free article] [PubMed] [Google Scholar]
- 22.Toth CA, Tai V, Pistilli M, et al. Distribution of OCT Features within Areas of Macular Atrophy or Scar after 2 Years of Anti-VEGF Treatment for Neovascular AMD in CATT. Ophthalmol Retin. 2019;3(4):316–325. doi: 10.1016/j.oret.2018.11.011 [DOI] [PMC free article] [PubMed] [Google Scholar]
- 23.Daniel E, Pan W, shuang Ying G, et al. Development and Course of Scars in the Comparison of Age-Related Macular Degeneration Treatments Trials. Ophthalmology. 2018;125(7):1037–1046. [DOI] [PMC free article] [PubMed] [Google Scholar]
- 24.Sadda SVR, Tuomi LL, Ding B, Fung AE, Hopkins JJ. Macular Atrophy in the HARBOR Study for Neovascular Age-Related Macular Degeneration. Ophthalmology. 2018;125(6):878–886. doi: 10.1016/j.ophtha.2017.12.026 [DOI] [PubMed] [Google Scholar]
- 25.Sharma S, Toth CA, Daniel E, et al. Macular Morphology and Visual Acuity in the Second Year of the Comparison of Age-Related Macular Degeneration Treatments Trials. Ophthalmology. 2016;123(4):865–875. [DOI] [PMC free article] [PubMed] [Google Scholar]
- 26.Bailey C, Scott LJ, Rogers CA, et al. Intralesional Macular Atrophy in Anti-Vascular Endothelial Growth Factor Therapy for Age-Related Macular Degeneration in the IVAN Trial. Ophthalmology. October 2018. [DOI] [PubMed] [Google Scholar]
- 27.Bhavsar KV, Freund KB. Retention of good visual acuity in eyes with neovascular age-related macular degeneration and chronic refractory subfoveal subretinal fluid. Saudi J Ophthalmol Off J Saudi Ophthalmol Soc. 2014;28(2):129–133. [DOI] [PMC free article] [PubMed] [Google Scholar]
- 28.Pfau M, Möller PT, Künzel SH, et al. Type 1 Choroidal Neovascularization Is Associated with Reduced Localized Progression of Atrophy in Age-Related Macular Degeneration. Ophthalmol Retin. 2020;4(3):238–248. doi: 10.1016/j.oret.2019.09.016 [DOI] [PubMed] [Google Scholar]
- 29.Abdelfattah NS, Hariri AH, Al-Sheikh M, et al. Topographic Correspondence of Macular Atrophy With Choroidal Neovascularization in Ranibizumab-treated Eyes of the TREX-AMD Trial. Am J Ophthalmol. 2018;192:84–90. [DOI] [PubMed] [Google Scholar]
- 30.Tanaka E, Chaikitmongkol V, Bressler SB, Bressler NM. Vision-Threatening Lesions Developing with Longer-Term Follow-up after Treatment of Neovascular Age-Related Macular Degeneration. Ophthalmology. 2015;122(1):153–161. [DOI] [PubMed] [Google Scholar]
- 31.Domalpally A, Danis RP, Trane R, Blodi BA, Clemons TE, Chew EY. Atrophy in Neovascular Age-Related Macular Degeneration. Ophthalmol Retin. 2018;2(10):1021–1027. [DOI] [PMC free article] [PubMed] [Google Scholar]
- 32.Sleiman K, Veerappan M, Winter KP, et al. Optical Coherence Tomography Predictors of Risk for Progression to Non-Neovascular Atrophic Age-Related Macular Degeneration. Ophthalmology. 2017;124(12):1764–1777. [DOI] [PMC free article] [PubMed] [Google Scholar]
- 33.Cukras C, Agrón E, Klein ML, et al. Natural History of Drusenoid Pigment Epithelial Detachment in Age-Related Macular Degeneration: Age-Related Eye Disease Study Report No. 28. Ophthalmology. 2010;117(3):489–499. [DOI] [PMC free article] [PubMed] [Google Scholar]
- 34.Ferris FL, Davis MD, Clemons TE, et al. A simplified severity scale for age-related macular degeneration: AREDS report no. 18. Arch Ophthalmol. 2005;123(11):1570–1574. doi: 10.1001/archopht.123.11.1570 [DOI] [PMC free article] [PubMed] [Google Scholar]
- 35.Waldstein SM, Vogl WD, Bogunovic H, Sadeghipour A, Riedl S, Schmidt-Erfurth U. Characterization of Drusen and Hyperreflective Foci as Biomarkers for Disease Progression in Age-Related Macular Degeneration Using Artificial Intelligence in Optical Coherence Tomography. JAMA Ophthalmol. 2020;138(7). doi: 10.1001/jamaophthalmol.2020.1376 [DOI] [PMC free article] [PubMed] [Google Scholar]
- 36.Chen L, Li M, Messinger J, Ferrara D, Curcio C, Freund KB. Recognizing Atrophy and Mixed-Type Neovascularization in Age-Related Macular Degeneration Via Clinicopathologic Correlation. Transl Vis Sci Technol. 2020;9(8):8. doi: 10.1167/tvst.9.8.8 [DOI] [PMC free article] [PubMed] [Google Scholar]
Associated Data
This section collects any data citations, data availability statements, or supplementary materials included in this article.