

Summary
The antibody immune response is essential for the survival of mammals. However, we still lack a systematic understanding of the antibody repertoire. Here we developed a proteomic strategy to survey, at an unprecedented scale, the landscape of antigen-engaged, circulating camelid heavy-chain antibodies, whose minimal binding fragments are called VHH antibodies or nanobodies. The sensitivity and robustness of this approach were validated with three antigens spanning orders of magnitude in immune responses; thousands of distinct, high-affinity nanobody families were reliably identified and quantified. Using high-throughput structural modeling, cross-linking mass spectrometry, mutagenesis, and deep learning, we mapped and analyzed the epitopes of > 100,000 antigen-nanobody complexes. Our results revealed a surprising diversity of ultrahigh-affinity camelid nanobodies for specific antigen binding on various dominant epitope clusters. Nanobodies utilize both shape and charge complementarity to enable highly selective antigen binding. Interestingly, we found that nanobody-antigen binding can mimic conserved intracellular protein-protein interactions.
A record of this paper’s Transparent Peer Review process is included in the Supplemental Information.
Keywords: Antibody technology, nanobody, integrative structural proteomics, antibody immune response
Graphical Abstract
eTOC blurb:
Xiang et al. developed a strategy to systematically investigate the repertories of camelid nanobodies for antigen binding. Thousands of diverse and high-affinity Nb families have been identified and affinity-classified. The authors employed hybrid structural proteomics to map epitopes of >100,000 antigen-nanobody complexes to understand the mechanisms underlying mammalian humoral immunity.
Introduction
In response to an antigenic challenge, mammals produce antibodies with excellent affinity and selectivity for antigen binding (Chaplin, 2006). The humoral immune response is universal and critical for mammals, including humans, to survive countless pathogenic challenges. Despite enormous efforts in characterizing antigen-antibody interactions and structural characterization of specific binary interactions (Inbar et al., 1972; Sela-Culang et al., 2013), we still do not fully appreciate the circulating antibody repertoire that responds to an antigen. The complexity of antigen-specific antibodies, the diversity of epitopes, and the mechanisms that underlie high-affinity and high-specificity antibody binding remain to be characterized. Systematic analysis of antigen-engaged antibody proteomes, including high-throughput structural characterization of antigen-antibody complexes, while still beyond the reach of current technologies (Egloff et al., 2019; Fridy et al., 2014; Sato et al., 2012; Scheid et al., 2011; Wine et al., 2013), may provide insights into the mammalian humoral immunity and the underlying disease mechanisms. In addition, the development of new tools and methods that facilitate robust and high-quality, high throughput antibody analysis will greatly help advance discoveries into disease diagnostics and therapeutics (Baran et al., 2017; Chevalier et al., 2017; Sircar et al., 2011).
Camelids (such as llama, alpaca, and camel) can produce functional, homodimeric, and heavy-chain antibodies (hcAbs), which are likely essential for their adaptive immunity (Hamers-Casterman et al., 1993). Natural antigen-binding fragments derived from hcAbs are called VHH antibodies or nanobodies (Nbs) (Muyldermans, 2013). Nbs form compact core structures that are composed of four framework regions (FR1 to FR4). Antigen engagement is primarily mediated by three complementarity-determining regions (CDR1, CDR2, and CDR3), which form unique hypervariable loop structures to selectively bind the target (Desmyter et al., 1996). Nbs are small (~ 15 kDa), highly soluble, and stable. Due to the small sizes, structural simplicity, and robustness, Nbs can be easily bioengineered. They can be rapidly produced in bulk from microbes, including Escherichia coli and yeast cells, for biophysical and structural characterizations. For these reasons, Nbs have recently emerged as promising agents for biomedical sciences and could be used as a model system to study mammalian circulating antibodies and humoral immunity.
In this study, we developed a strategy that enables global identification, classification, and high-throughput structural characterization of antigen-specific Nbs. The sensitivity and the robustness of this approach were validated using antigens that span three orders of magnitude in immune responses, including a small, weakly immunogenic antigen derived from the mitochondrial membrane. Tens of thousands of distinct, diverse, and specific Nb families were reliably identified and quantified according to their physiochemical properties such as binding affinities. A significant fraction of the identified Nbs had sub-nanomolar affinities for antigen binding, which are unusual for monomeric, single-domain antibody fragments. Using high-throughput protein docking, integrative structural proteomics, and deep learning, we have surveyed the structural landscapes of >100,000 antigen-Nb complexes to advance our understanding of the humoral immune response. Our big data has revealed a surprising efficiency, specificity, diversity, and versatility of the mammalian humoral immunity.
Results
Overview of a proteomic pipeline for high-throughout Nb discovery and characterization
A proteomic platform was developed for high-throughout Nb discovery, quantification/classification, and epitope mapping by hybrid structural characterizations of antigen-Nb complexes (Fig 1). To raise highly specific antibodies by in vivo affinity maturation, we immunize a domestic camelid with the antigens of interest. After immunization, the Nb cDNA library is prepared from the llama’s blood and bone marrow (Fig S1D-E). Next-generation genomic sequencing (NGS) is then used to sequence the whole B cell repertoire that produces hcAbs/Nbs (Fridy et al., 2014). This step creates a rich proteomic database containing millions of unique Nb sequences. Meanwhile, antigen-specific hcAbs are affinity isolated from the immunized sera and eluted using step-wise gradients of pH buffers or salt (Fig S1F-G). Fractionated hcAbs are then proteolyzed in solution to efficiently release CDR peptides for quantitative analysis by nanoflow liquid chromatography coupled to high-resolution mass spectrometric (LC-MS) analysis (Methods). Initial peptide candidates that pass the database search are annotated for CDR identifications. Critically, we develop a robust strategy to remove false-positive CDR3 peptides that otherwise dominate the identifications substantially. High-quality CDR3 peptides that pass our quality filter are quantified across biochemical fractions by label-free quantitative MS to infer Nb affinities and are assembled with other peptides into Nb proteins (Fig S1A-C). Open-source software AugurLlama was developed here to facilitate analysis of quantitative Nb proteomic data analysis. In parallel, high-throughput structural docking (Schneidman-Duhovny et al., 2005), cross-linking mass spectrometry (CXMS) (Chait et al., 2016; Leitner et al., 2016; Rout and Sali, 2019; Shi et al., 2015; Yu and Huang, 2018), and mutagenesis were integrated into this pipeline for rapid epitope mapping. Finally, to explore the potential features associated with high-affinity antigen binding, we also developed a deep-learning model and integrate it into the pipeline (Methods).
Fig 1. Schematics of a pipeline for robust and large-scale Nb analysis.

To raise matured, high-quality Nbs, a camelid is immunized with the antigens of interest. The Nb cDNA library is then prepared from the B cells of the immunized camelid and is sequenced by next-generation sequencing (NGS) (Fridy et al., 2014). In parallel, antigen-specific hcAbs are isolated from the immunized sera, stepwise eluted, and directly in-solution proteolyzed by trypsin and chymotrypsin. The resulting CDR3 fingerprint peptides are quantified by label-free quantitative proteomics, and the representative Nb families are classified based on their affinity groups. Open-source software AugurLlama is developed to facilitate high-confidence and quantitative Nb proteomic analysis. High-quality Nbs are then synthesized as recombinant DNA fragments and are rapidly produced in microbes such as E.coli or pichia pastoris. High-throughput structural docking and integrative structural proteomic methods such as cross-linking/mass spectrometry are integrated into this pipeline for rapid large-scale epitope mapping. Here a deep-learning model is also developed to facilitate data mining (e.g., the latent features that distinguish high-affinity Nb binding)
Systematic database analysis reveals the utility of chymotrypsin for Nb proteomic analysis.
To validate this pipeline, we immunized three antigens of different structures with two lama glamas. Llama A was immunized with glutathione S-transferase (GST), and PDZ domain derived from the mitochondrial outer membrane protein (OMP25) (Doyle et al., 1996), while llama B was challenged with human serum albumin (HSA). We amplified the variable domains of hcAb /Nb cDNA libraries from the B lymphocytes of animals, recovering 13.6 million unique Nb sequences in NGS databases.
To systematically explore the architecture of Nb protein sequences, we aligned half a million unique sequences determined by NGS. A sequence logo was generated in Fig 2A. As expected, the framework sequences are highly conserved and lack specificity. Of the three CDRs, CDR3 has both the largest sequence diversity and length variation, providing excellent specificity for Nb identification by bottom-up proteomics (Fig 2B).
Fig 2. In silico analysis of NGS-based Nb sequence databases reveal the superiority of chymotrypsin for Nb proteomics.

A) Logo display of amino acid occurrence of approximately 0.5 million Nb sequences from the NGS database. CDR: complementarity-determining region. FR: framework region. Arrows in blue and orange denote the dominant cleavage sites by trypsin and chymotrypsin, respectively. The proline at position 96 is bolded. The C terminal hinge sequence is shown in dark gray.
B) The length distributions of CDRs from the sequence database.
C) In silico digestion of the Nb database and cumulative plot of corresponding peptide masses.
D) The length distributions of CDR3 peptides that are released by trypsin or chymotrypsin.
E)-F) The number of unique CDR3 peptide identifications based on the percentage of CDR3 diagnostic fragment ions in the spectra. The x-axis represents the minimum % of fragmented CDR3 sequences in the MS spectra. The percentage is calculated by the number of fragment ions (both b and y ions) that cover the CDR3 sequence, divided by the CDR3 sequence length. CDR3 peptide identifications decreased by the % of CDR3 fragmentation in the spectra. Peptides were identified from database A (salmon), or from a non-specific decoy database B (grey). E) and F) show the analysis results by trypsin and chymotrypsin, respectively.
G-H) 3D plots of the normalized CDR3 peptide identifications from the target database search, the percentages of CDR3 fragmentations, and CDR3 length. FDR: false discovery rate. FDRs of CDR3 identifications are colored on the 3D plots. The color bar shows the scale of FDR. FDR < 5% is presented in gradient red. I: analysis by trypsin; J: analysis by chymotrypsin.
I-J) Representative high-quality MS/MS spectra of CDR3 peptides by K) trypsin and L) chymotrypsin.
We found that trypsin, which is the most widely used endoprotease for proteomics, appears to be suboptimal for Nb proteomic analysis. Conserved trypsin cleavage sites (lysine and arginine) are highly limited in regions (such as FR3 and FR4) close to CDR3 that fully cover the fingerprint sequence. Less than one quarter (23%) of the CDR3 residues could be covered by regular tryptic peptides of < 2.5 kDa (Fig 2C). The remaining 77% were covered by large peptides that are often refractory for sensitive proteomic analysis (Fig 2D, S2C-D). In comparison, chymotrypsin, which cleaves aromatic and hydrophobic residues and is infrequently used for proteomics, is likely more favorable for Nb proteomics. The vast majority (91%) of CDR3 residues are covered by chymotryptic peptides of < 2.5 kDa (Fig 2C-D). The high CDR3 coverage by chymotrypsin may offset its compromised protease activity leading to more identifications. In silico simulation confirmed that chymotrypsin provided better CDR3 coverage and revealed excellent complementary between chymotrypsin and trypsin for efficient Nb proteomic analysis (Fig S2E).
A peptide fragmentation filter effectively removes false-positive Nb identifications.
We found the regular proteomic database search strategy can lead to highly inflated false-positive CDR3 identifications, presumably due to the exceedingly large database (Li et al., 2016a; Savitski et al., 2015) and the unique sequence architecture (Fig S2A-B, Methods). Most false-positive CDR3 tandem MS/MS spectra have poor fragment ion coverage on the critical diagnostic CDR3 residues (Fig S2G-H). To evaluate the contribution of high-resolution CDR3 fragment ions to Nb identification, we filtered the CDR3 peptides based on the level of CDR3 sequence fragmentations. We then compared the search results from two databases: an authentic database (A) generated from a camelid that produced the Nbs being analyzed, and a decoy database (B) from an irrelevant animal, which has a similar number of Nbs yet with distinct, non-overlapping CDR3 sequences (Fig S2F). Theoretically, therefore, any Nb CDR3 peptides identified from the decoy database (B) must be false positive identifications. Using the regular search approach, surprisingly, we identified a large number of false positives from database B search. By increasing the stringency of CDR3 sequence fragmentations, a large number of such false positives can be removed and true positive CDR3s can be specifically retrained. Notably, the vast majority (95%) of the erroneous matches could be eliminated by a simple CDR3 fragmentation filter requiring a minimum coverage of 50% for tryptic peptides or 40% for chymotryptic peptides in the respective spectra (Fig 2E-F, 2I-J). This filter was further optimized based on the CDR3 length (Fig 2G-H) and was integrated into open-source software AugurLlama for reliable and high-throughput Nb identifications.
High-quality, large-scale Nb identifications
The development of sensitive Nb proteomics and reliable informatics enabled us to dissect the circulating hcAb repertoire for antigen binding systematically. To assess the sensitivity and robustness of the approach, we used antigens that varied substantially in immunogenicity including a small PDZ domain that was only weakly immunogenic and therefore posed a challenge for high-quality Nb proteomic analysis (Fig 3A).
Fig 3. High-throughput discovery and characterizations of a larger repertoire of antigen-specific Nbs.

A) Enzyme-linked immunosorbent assay (ELISA) analysis of the camelid immune responses of three different antigens.
B) Identifications of unique CDR combinations and unique CDR3 sequences for different antigens.
C) Boxplot showing the comparison between trypsin and chymotrypsin for CDR3 mapping of NbGST.CDR3 peptides identifications were from the high-ph, low-ph, and salt conditions.
D) Phylogenetic analysis and logo plots of CDR3 sequences from three antigen-specific repertoires. CDR3 length is shown in the bar plot, and the pI and hydropathy are shown in the heatmaps. Hydrophobic, negatively charged, positively charged, and hydrophilic or neutral residues are shown in olive, red, blue, and indigo, respectively.
E) The solubility of the randomly selected antigen-specific Nbs.
F) Verifications of the selected Nbs for antigen binding.
G) Comparison of antigen-specific Nbs identified by either chymotrypsin or trypsin-based method. Y-axis stands for the % of the positive hits that were randomly selected for verifications. The percentage of antigen-binding Nbs (positive hits) was calculated by the number of true binders divided by the number of soluble Nbs.
We discovered 5,969 distinct CDR3 families (3,453, 2,286, and 230 individual CDR3 families for GST, HSA, and PDZ, respectively) corresponding to 18,159 distinct CDR combinations of Nbs (~ 3% of Nb sequences in the NGS database) (Fig 3B, S3A-C). The results were highly reproducible (Fig. S3B). Each repertoire was highly specific to the antigen and presented remarkable diversity as reflected by the CDR3 length, hydrophobicity, and the isoelectric point (pI) (Fig 3D). Chymotrypsin provided more useful fingerprint information for Nb identification than trypsin (Fig 3C). A random set of 146 Nbs with distinct CDR3s was selected for production in E.coli, of which 89% were highly soluble (Fig 3E). We then selected a subset of the purified Nbs and employed complementary biochemical and biophysical assays, including immunoprecipitation, enzyme-linked immunosorbent assay (ELISA), and surface plasmon resonance (SPR) analyses to verify antigen binding (Fig S3D-E, S4C-D, Table S1-3). Overall, 86.2% (CI95%: 6.8%), and 90.5% (CI95%: 11.5%) true binders were verified for GST and HSA, respectively (Fig 3F). To confidently identify PDZ Nbs, we fused the small PDZ with a maltose-binding protein (MBP) to increase the resin coupling efficiency and used the MBP resin for control of non-specific binding Nbs. Moreover, only the high-affinity fraction was quantitatively analyzed (Methods). 100% of the resulting NbPDZ that we tested were high-affinity binders. In addition, Nbs identified by trypsin and chymotrypsin had comparable high-quality for antigen binding (Fig 3G).
Accurate Nb quantification and affinity classification.
We evaluated different methods for Nb affinity classification. Antigen-specific hcAbs were isolated from the serum and eluted by the step-wise high-salt gradients, high pH buffers, or low pH buffers (Methods, Fig S1F-G). The resulting fractions were quantified by label-free quantitative proteomics (Cox and Mann, 2008; Zhu et al., 2010). CDR3 peptides (and the corresponding Nbs) were subsequently clustered into three groups based on their relative ion intensities (Fig 4A-B, S4A-B). Our classification assigns 31% of NbGST and 47% of NbHSA into the C3 high-affinity group by the high pH method (Fig 4C). We expressed a set of NbGST with unique CDR3s from each cluster and measured the affinity by ELISA and SPR to better evaluate different fractionation methods. There was an excellent correlation between ELISA IC50 and SPR KD measurements with R2 = 0.85 (Fig 4D, Table S1). Compared with low-pH and high-salt gradient methods, we found that a step-wise, high pH-based fractionation is more accurate for affinity classification. Nbs identified from clusters 1 and 2 (C1, C2) were enriched with low affinity (micromolar, C1) and mediocre (nanomolar, C2) affinity binders, while C3 contained greater than 40% sub-nanomolar Nbs (Fig 4E, 4H, S4C).
Fig 4. Classification and characterization of antigen-specific Nb repertoires.

A) Label-free MS quantification and heat map analysis of CDR3GST fingerprints by chymotrypsin.
B) Reproducibility and precision of label-free CDR3GST peptide quantifications by chymotrypsin.
C) Percentages of different Nb affinity clusters that were classified by quantitative proteomics.
D) Correlation analysis of Nb ELISA affinity (LogIC50 of O.D. 450nm) with SPR KD.
E) Box-and-whisker plots of ELISA affinities of different Nb clusters. The p values were calculated based on the student's t test. * indicates a p value of < 0.05, ** indicates < 0.01, *** indicates < 0.001, **** indicates < 0.0001, ns indicates not significant.
F) A plot summarizing ELISA affinities of 25 NbHSA (circles). KD affinities of the top 14 ranked Nbs by ELISA were measured by SPR (red triangles).
G) A plot summarizing the ELISA affinities of 11 soluble NbPDZ.
H) The SPR kinetics measurements of representative NbGST of different affinity clusters.
I) SPR kinetics measurement of a representative NbHSA (H14).
J) The SPR kinetics measurement of NbPDZ (P10).
K) Immunoprecipitations of GST (1nM concentration) by different Nbs-coupled dynabeads and GSH resin.
L) Schematic of the PDZ domain of the mammalian mitochondrial outer membrane protein 25. Fluorescence microscopic analysis of NbPDZ P10. The Nb was conjugated by Alexa Fluor 647 for native mitochondrial immunostaining of the COS-7 cell line. Mitotracker was used for positive control.
To further verify the result, we purified twenty-five NbHSA with distinct CDR3s from C3 and ranked their affinity by ELISA (Fig 4F, Table S2). The top 14 ranked NbHSA were subsequently selected for kinetic analysis by SPR, in which 11 were confirmed with picomolar KD with diverse binding kinetics. The remaining 3 were also high-affinity Nbs with single-digit nanomolar KD’s (Fig 4I, S4D). We purified 13 NbPDZ and confirmed their high affinity by ELISA and immunoprecipitation (Fig 4G, S3E, Table S3). SPR confirmed the KD of a representative, highly soluble NbPDZ (P10) to be 4.4 pM (Fig 4J). We further positively evaluated our ultra high-affinity Nbs for immunoprecipitation (NbGST) and fluorescence imaging (NbPDZ) of native mitochondria (Fig 4K-L). Together these results suggest that our method can accurately classify a large repertoire of Nbs based on affinity.
Potential mechanisms that underlie high-affinity Nb binding.
Reliable affinity classifications of the antigen-specific Nbs prompted us to investigate the physicochemical properties that may distinguish high-affinity and low-affinity binders for antigen binding. Shorter CDR3s with distinct distributions were found for high-affinity NbHSA and NbGST (Fig 5A, S5A), likely lowering the entropy for antigen binding (Rini et al., 1992). A significant increase of pI was also observed with some differences between antigen-specific repertoires: for example, CDR3HSA was primarily responsible for the increase for NbHSA, while CDR1GST and CDR2GST contributed more to the increase of NbGST (Fig 5B, S5B). It appears that depending on the epitope properties, Nbs explore different CDR combinations to achieve specific, high-affinity binding.
Fig 5. The mechanisms that underlie antigen binding by high-affinity NbHSA.

A) Distributions of CDR3 lengths of high-affinity (brown) and low-affinity (steel) NbHSA.
B) Comparisons of the pI of low- and high- affinity Nbs and different CDRs.
C) Alignment of CDR3 sequences based on a random selection of 1,000 unique CDR3 sequences with an identical length of 15 residues.
D) Pie charts of the amino acid compositions of the CDR3 heads of low- and high- affinity NbHSA. The 6 most abundant residues are shown.
E) The relative changes of abundant amino acids on CDR3 heads of NbHSA.
F) Sequence logo of two representative convolutional CDR3 filters (Filter 14 for high-affinity NbHSA; filter 3 for low-affinity NbHSA) learned by a deep learning model.
G) Comparisons of the relative abundance of Y, G, and S on the CDR3 heads between high-affinity and low-affinity NbHSA. Their relative abundances are plotted as a function of the relative position of the individual residues. To help illustrate the data, we used an Nb structure (PDB: 5F1O) (Li et al., 2016b) where two tyrosines on the CDR3 head directly interact with the epitope on the antigen. It remains speculative how HSA Nbs use the CDR3 tyrosines for high-affinity binding.
A CDR3 fingerprint sequence can be divided into a central “head” region containing the highest sequence variability, and a lower specificity adjacent “torso” region (Finn et al., 2016; Lam et al., 2009) (Fig 5C). Specific residues, including aspartic acid and arginine (forming strong electrostatic interactions), aromatic tyrosine, small and flexible glycine, and serine, and hydrophobic alanine and leucine were enriched on the heads (Fig 5D-E, S5C-E). We identified two main features for high-affinity binders: 1) significant alterations of charged residues, likely crucial for optimizing the electrostatic complementarity between the paratopes and corresponding epitopes, and 2) an increase in the number of tyrosines on the CDR3 heads. Interestingly, for high-affinity NbHSA, tyrosine is more frequently found at the center of the CDR3 loops, presumably inserting its bulky, aromatic side-chain into the specific pocket(s) on the HSA epitopes (Desmyter et al., 1996; Li et al., 2016b; Peng et al., 2014). Glycine and serine tend to be placed away from the CDR3 center, providing additional flexibilities and facilitating the orientation of the tyrosine side chain in the pocket (Fig 5G). These results were supported by the correlation analysis between the number of these residue groups and ELISA affinities. For example, we found a significant negative correlation between the number of negatively charged residues of NbHSA and ELISA affinity (Pearson r = −0.48) and a positive association for tyrosine and glycine (Pearson r = 0.52, Fig S5F). Correlation plots of ELISA affinities and the number of specific residues revealed different slopes (−1.0 for negative charges and 0.6 for tyrosine and glycine), potentially reflecting the differences in contributions to Nb affinity between electrostatic and hydrophobic interactions. For NbGST, we found a positive correlation between CDR2 charges and the affinity (Fig S5G).
To discover additional features that distinguish high-and low-affinity Nbs, we developed a deep learning model and trained the network using the sequences of Nbs with their corresponding affinity clusters as labels for a complimentary analysis. We extracted features unique to each group of Nbs once the network learned the sequence patterns (filters) that enable affinity classification (92% accuracy, Methods). In contrast, more conventional classification approaches, such as K-means clustering based on the principal component analysis (PCA), did not result in a meaningful classification of Nbs (Fig S6). Deep learning revealed a pattern of consecutive lysine and arginine, tyrosine, and glycines as the most informative CDR3 feature for high-affinity NbHSA (Methods, Fig 5F, S5H). For low-affinity binders, the most informative filter has a preference for phenylalanine, histidine, and two consecutive aspartic acids. A quick comparison of the consensus sequences reveals a tendency for successive pairs of positive charges in the heads of high-affinity binders and consecutive pairs of negative charges in the heads of low-affinity binders. This deep learning module may be expanded to identify antigen /epitope-specific Nbs (Robbiani et al., 2020; Truck et al., 2015).
The landscapes of antigen-engaged Nb proteomes revealed by integrative structure methods.
High-throughput docking and clustering analysis of 34,972 unique NbHSA revealed three dominant, nonlinear/conformational epitopes (E1, E2, and E3) on HSA (Fig 6A). We cross-linked 23 NbHSA of high expression level with HSA using complementary cross-linkers of amine-specific disuccinimidyl suberate (DSS), and a heterobifunctional carbodiimide crosslinker (EDC) that reacts with both lysine and acidic residues (aspartic acid and glutamic acid) (Kim et al., 2018; Shi et al., 2014) and obtained converged models for 19 HSA-Nb complexes (Table S2). Cross-linking mass spectrometry confirmed the docking results (5%, 60%, 20%, E1, E2, and E3, respectively) and identified two additional minor epitopes (Fig 6B-D). 92% of cross-links were satisfied by the models with a median precision of 5.6 Å (Fig 6E-F). To further verify the cross-linking models, we introduced a single point mutation E400R on HSA with minimal impact on the overall structure as predicted by mCSM (change of stability ΔΔG=−0.1) (Pires et al., 2014). E400R potentially disrupts a salt bridge formed between the most abundant E2 epitope and arginine on the CDR3 (Fig 6G). The mutation significantly weakened 26% of the interactions that we tested using ELISA, confirming that E2 is a bona fide dominant epitope (Table S2).
Fig 6. The structural landscapes of HSA-specific Nb proteomes.

A) Heatmap analysis of the major epitope clusters identified by structural docking. HSA is presented in gray. epitope clusters of E1, E2, and E3 are presented in red, purple, and yellow, respectively.
B) The relative percentage of HSA epitope clusters based on cross-link models (E1: residues 57-62, 135-169; E2: 322-331, 335, 356-365, 395-410; E3: 29-37, 86-91, 117-123, 252- 290; E4: 566-585, 595, 598-606 and E5:188-208, 300-306, 463-468).
C) Representative cross-link models of the HSA-Nb complexes. The satisfied DSS or EDC cross-links are shown as blue sticks.
D) Representative cross-link models of the HSA-Nb complexes on the E2 epitope cluster. Three sub-epitopes (variants that share specific E2 residues but do not entirely overlap) are also shown.
E) Plot of the precision measured by average Cα RMSD (room-median-square-deviations) between all top10 models of HSA-Nb cross-link models.
F) Histograms showing the % of the GST-Nb cross-link satisfactions (EDC crosslinks <25 angstroms and DSS crosslinks < 30 angstroms).
G) Left: A putative salt bridge between glutamic acid 400 (HSA) and arginine 108 of an Nb CDR3 is presented. The local sequence alignment between HSA and camelid albumin is shown. Right: ELISA affinity screening (heatmap) of 19 different Nbs for binding to wild type HSA and the point mutant (E400R). * indicates decreased affinity.
Likewise, we identified and experimentally verified three dominant epitopes for NbGST (Fig S7A-B): E1 (18.75%) and E3 (50%) contain charged surface patches; E2 (31.25%) overlapped with the GST dimerization cavity, where the CDR3 loops of Nbs were inserted for binding (Fig S7E). 91% of cross-links were satisfied by the models with a median precision of 6 Å (Fig S7C-D). Two epitopes were identified for PDZ (Fig S8A). E2PDZ had a structured surface consisting of an α helix and two β-strands and was hypothesized to be the dominant epitope. We then produced a double mutant PDZ (R46E: K48D) that, according to our models, disrupts two important salt bridges for high-affinity interaction (Fig S8B), and evaluated the mutant binding by ELISA. The majority (8/11) of the NbPDZ that we selected exhibited significantly decreased or no affinity for the mutant, confirming that E2 is the dominant epitope (Fig S8C). To evaluate the accuracy of Nb modeling and docking, we retrieved ~ 200 high-resolution structures of Nb-antigen complexes from the PDB for benchmarks. Our results indicated that Nb modeling by comparative modeling is accurate. The average root-mean-square deviation (RMSD) of the models, based on the 200 high-resolution Nb benchmarks, is ~ 2 angstrom (Fig S8D). Docking analysis revealed that more structures can be recovered (up to 60) by the top 10 docking protocol. As expected, cross-linking restraints can significantly improve the docking results (Fig S8E).
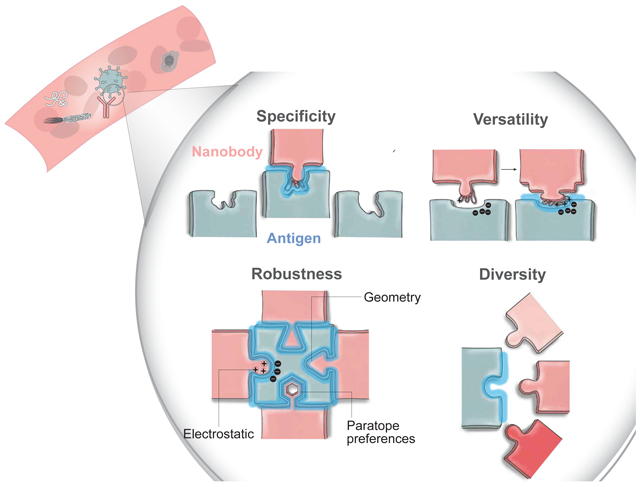
The specificity, robustness, versatility, and diversity of the circulating mammalian antibody repertoires
Our analysis revealed the specificity, robustness, versatility, and diversity of the circulating hcAb (Nb) repertoire for antigen engagement. The specificity was well exemplified in HSA binding, where Nbs evolved to specifically recognize HSA surface pockets that differ in physicochemical properties (i.e., pI and hydropathy) between “self” endogenous llama albumin and “non-self” HSA (sharing 87% sequence similarity) to avoid an autoimmune response (Fig 7A).
Fig 7: Mechanisms that underlie antigen binding by a large repertoire of high-affinity Nbs.

A) The sequence variations of pI and hydropathy between human and camelid serum albumins.
B) Surface representations showing co-localization of electrostatic potential surfaces with epitopes on three antigens.
C) Boxplots showing the net charge distributions on the Nb CDR3 heads. The median values are 1, 0, and −4 for NbHSA, NbGST, and NbPDZ , respectively.
D) Surface representations showing the shared binding region between natural peptide ligand (KQTSV, PDB:1BE9) and an NbPDZ CDR3 on PDZ. The peptide ligand was colored in salmon, and CDR3 was transparent and colored in slate.
E) Boxplots showing the relative interface curvature of different antigens based on high-throughput structural docking of antigen-Nb complexes (lower value corresponds to flatter interfaces).
F) Plot comparisons of the CDR3 lengths of different high-affinity Nbs. The curve was smoothed with a gaussian function.
G) Cartoon representations of the cross-link models of a diverse set of high-affinity NbGST that bind to the same epitope (E3) on GST. The CDR3 sequence alignment was shown.
The robustness of antigen-Nb interactions is potentially achieved by optimizing electrostatic and shape complementarity (Lawrence and Colman, 1993; McCoy et al., 1997). We found that the most abundant epitopes are generally enriched with charged residues (Fig 7B, upper panel), while complementary charges were identified on the CDR3s of the corresponding Nbs (Fig 7C, S9A, S9D). Consistently, high-affinity binders have higher numbers of charged residues compared to low-affinity ones. While Nbs appear to prefer concaveshaped epitopes, they can also bind flat surfaces (Fig 7B, lower panel). Moreover, the shape and charge complementarities are increased for high-affinity binders through enrichment and redistribution of specific groups of “hot-spot” paratope residues (charged residues, tyrosine, and small hydrophobic residues).
The versatility of the immune system was revealed by analyzing the response to the weakly immunogenic PDZ domain. Here, specific Nbs evolved unusually long CDR3 loops (with the median length of 20 amino acids, Fig 7F) enriched with aspartic acid, glycine, and serine, which account for half of the CDR3 residues (Fig S9A, S9D). The long CDR3 loops wrap around the relatively shallow (Fig 7E) yet positively charged epitope to create extensive electrostatic and hydrophobic interactions. Interestingly, this epitope overlaps with a conserved ligand-binding motif shared among numerous PDZ interacting proteins (Fig 7D) (Doyle et al., 1996; Sheng and Sala, 2001). NbPDZ are acidic with a median pI of 4.9 (Fig S9B), pushing the envelope of their physicochemical properties to achieve >100,000-fold higher affinity (Fig 4J) than the natural intracellular ligands (μM affinity) (Niethammer et al., 1998). Despite the acidic nature, NbPDZ did not seem to appreciably alter hydropathy (Fig S9C) due to the compensation of hydrophobic residues (Fig S9D). Here we took a snapshot of this fascinating rapid evolution of protein-protein interaction, revealing a convergent force that drives this process.
The exceptional diversity of high-affinity Nbs for antigen engagement was among the most significant observations. Thousands of exceptionally diverse, specific CDR3 Nb families were identified for various dominant epitopes on the antigens. Even within an epitope, there exists a large cohort of different binders (Fig 7G).
Discussion
In this study, we have developed a sensitive and high-throughput platform that integrates proteomics and structural modeling to systematically analyze Nbs Thousands of district and high-affinity Nb families were confidently identified, classified, and characterized for benchmark antigens that elicit orders of magnitude in camelid’s immune response.
Most recently, we employed this strategy to enable rapid discovery of over high-affinity 8,000 Nbs that bind the receptor-binding domain (RBD) of the Severe Acute Respiratory Syndrome coronavirus 2 (SARS-CoV-2) spike glycoprotein (Xiang et al., 2020a). This repertoire includes ultrahigh affinity Nbs that neutralize SARS-CoV-2 at sub-nanogram per milliliter concentration, which were unprecedented for monomeric antibody fragments (Jiang et al., 2020). The ultrapotent Nbs were rapidly bioengineered into multi-epitope, multivalent constructs to help suppress the virus mutational escape (Xiang et al., 2020a). The highly selected Nbs raise an exciting possibility of pulmonary delivery by aerosolization directly and deeply into the infection sites for the treatment of early virus infections (Schoof et al., 2020; Xiang et al., 2020a).As deadly pathogens continue to emerge (Morens et al., 2004; Paules et al., 2020; Woolhouse et al., 2012), this multidisciplinary platform for high-quality Nb discovery and characterization, may help curb the current pandemic and future ones that will happen with high probability.
Systematic analysis of antigen-specific Nb repertoires has provided critical insights into the humoral immune response. Like IgG antibodies, Nbs also prefer a handful of specific epitopes. Such immunodominance may help to efficiently elicit the response to bind antigens tightly (Akram and Inman, 2012). Moreover, we identified a large spectrum of high-affinity Nbs (hAbs) in circulation with diverse CDR sequences that bind the same or an overlapping epitope. This diversity, seemingly redundant, provides a glimpse into a potential mechanism by which our immune system responds to pathogens such as bacteria and viruses that are evolving to escape the immune response (Sanjuan et al., 2010; Scheid et al., 2011; Wei et al., 2003). When the variants may render some antibodies ineffective, other can still provide the necessary protection (Schmidt et al., 2015; Victora and Wilson, 2015). An extensive repertoire of antibodies that target the same epitope can be highly robust to suppress antigenic drifts. Our analysis thus sheds light on the epic landscapes of mammalian humoral immunity and potentially uncovers a robust mechanism by which the immune response has evolved to enact on this never-ending race.
We envision that this Nb platform will find broad utility in many challenging biomedical applications of cancer biology, brain research, and microbiology. The high-quality dataset and structural models as presented here may serve as a blueprint to study antibody-antigen and protein-protein interactions that orchestrate numerous biological processes.
STAR* Methods
Animal immunization
Two Llamas were respectively immunized with HSA, and a combination of GST and GST fusion PDZ domain of Mitochondrial outer membrane protein 25 (OMP25) at the primary dose of 1 mg, followed by three consecutive boosts of 0.5 mg every 3 weeks. The bleed and bone marrow aspirates were extracted from the animals 10 days after the last immuno-boost. All the above procedures were performed by Capralogics, Inc. following the IACUC protocol.
mRNA isolation and cDNA preparation
The following experiments were performed for both immunized llamas. ~ 1 - 3 x10⁹ peripheral mononuclear cells were isolated from 350 ml immunized blood and 5 - 9 x10⁷ plasma cells were isolated from 30 ml bone marrow aspirates using Ficoll gradient (Sigma). The mRNA was isolated from the respective cells using the RNeasy kit (Qiagen) and was reverse-transcribed into cDNA using Maxima™ H Minus cDNA Synthesis Master Mix (Thermo). Camelid IgG heavy chain cDNA sequences from the variable domain to the CH2 domain were specifically amplified using primers CALL001 and CH2FORTA4 (Arbabi Ghahroudi et al., 1997). The VHH genes that lack the CH1 domain were separated from conventional IgG by DNA gel electrophoresis and were subsequently re-amplified from framework 1 to framework 4 using the 2nd-Forward and 2nd-Reverse. The random 8-mers replacing adaptor sequences were added to aid in cluster identification for Illumina MiSeq. The amplicon of the second PCR (approximately 450-500 bp) was purified using Monarch PCR clean up kit. The final round of PCR with primer MiSeq-F and MiSeq-R was performed to add P5 and P7 adapters with the index before MiSeq sequencing.
Next-generation sequencing by Illumina Miseq
Sequencing was performed based on the Illumina MiSeq platform with the 300 bp paired-end model. Over 32.4 million reads were generated. Initial data processing yielded 13.6 million high-quality unique DNA sequences with a median phred score of 34, which corresponds to a ~ 0.1% false-positive rate. Read QC tool in FastQC v0.11.8 (http://www.bioinformatics.babraham.ac.uk/projects/fastqc/) was used for quality check and control of the FASTQ data. Raw Illumina reads were processed by the software tools from the BBMap project (https://github.com/BioInfoTools/BBMap/). Duplicated reads and DNA barcode sequences were removed successively before converting the nucleotide sequences into amino acid sequences. The complementary determining regions were annotated according to AbM CDR definition (Abhinandan and Martin, 2008).
Isolation and biochemical fractionation of VHH antibodies from immunized sera
Approximately 175 ml of plasma was isolated from 350 ml of immunized blood by Ficoll gradient (Sigma). Camelid single-chain VHH antibodies were isolated from the plasma supernatant by a two-step purification procedure using protein G and protein A sepharose beads (Marvelgent), acid-eluted before neutralized and diluted in 1xPBS buffer to a final concentration of 0.1- 0.3 mg/ml. To purify antigen-specific VHH antibodies, the GST or HSA-conjugated CNBr resin was incubated with the VHH mixture for 1 hr at 4°C and extensively washed with high salt buffer (1xPBS and 350 mM NaCl) to remove non-specific binders. Specific VHH antibodies were then released from the resin by using one of the following elution conditions: alkaline (1-100 mM NaOH, pH 11, 12 and 13), acidic (0.1 M glycine, pH 3, 2 and 1) or salt elution (1M – 4.5 M MgCl2 in neutral pH buffer). For purification of PDZ-specific VHH, a fusion protein of MBP-PDZ (where the maltose-binding protein/MBP was fused to the N terminus of PDZ domain to avoid steric hindrance of the small PDZ after coupling) was produced and was used as the affinity handle. MBP coupled resin was used for control (See Fig S3E). All the eluted VHHs were neutralized and dialyzed into 1x DPBS separately prior to proteomics analysis.
Proteolysis of antigen-specific Nbs and nanoflow liquid chromatography coupled to mass spectrometry (nLC/MS) analysis
For GST and HSA VHHs, each elution was processed separately according to the following protocol. For PDZ specific VHHs, only the most stringent biochemical elutes (i.e., pH 13, pH 1, MgCl2 3M, and 4.5M) and the respective nonspecific MBP binders (negative controls) from different fractions were pooled for proteolysis. For instance, For PDZ-specific VHHs that were eluted by pH13 buffer, we pooled non-specific MBP binding Nbs from pH 11, pH12, and pH13 fractions for negative control to improve the stringency of our downstream LC/MS quantification. VHHs were reduced in 8M urea buffer (with 50 mM Ammonium bicarbonate, 5 mM TCEP and DTT) at 57°C for 1hr, and alkylated in the dark with 30 mM Iodoacetamide for 30 mins at room temperature. The alkylated sample was then split into two and in-solution digested using either trypsin or chymotrypsin. For trypsin digestion samples, 1:100 (w/w) trypsin and Lys-C were added and digested at 37°C overnight, with additional 1:100 trypsin the other morning for 4 hrs at 37°C water bath. For chymotrypsin digestion samples, 1:50 (w/w) chymotrypsin was added and digested at 37 °C for 4 hrs. After proteolysis, the peptide mixtures were desalted by self-packed stage-tips or Sep-Pak C18 columns (Waters) and analyzed with a nano-LC 1200 that is coupled online with a Q Exactive™ HF-X Hybrid Quadrupole Orbitrap™ mass spectrometer (Thermo Fisher). Briefly, desalted Nb peptides were loaded onto an analytical column (C18, 1.6 μm particle size, 100 Å pore size, 75 μm × 25 cm; IonOpticks) and eluted using a 90-min liquid chromatography gradient (5% B–7% B, 0–10 min; 7% B–30% B, 10–69 min; 30% B–100% B, 69 – 77 min; 100% B, 77 - 82 min; 100% B - 5% B, 82 min - 82 min 10 sec; 5% B, 82 min 10 sec - 90 min; mobile phase A consisted of 0.1% formic acid (FA), and mobile phase B consisted of 0.1% FA in 80% acetonitrile (ACN)). The flow rate was 300 nl/min. The QE HF-X instrument was operated in the data-dependent mode, where the top 12 most abundant ions (mass range 350 – 2,000, charge state 2 - 8) were fragmented by high-energy collisional dissociation (HCD). The target resolution was 120,000 for MS and 7,500 for tandem MS (MS/MS) analyses. The quadrupole isolation window was 1.6 Th, and the maximum injection time for MS/MS was set at 80 ms.
Proteomics database search of Nb peptide candidates
Raw MS data were searched by Sequest HT embedded in the Proteome Discoverer 2.1 against an in-house generated Nb sequence database using the standard target-decoy strategy for FDR estimation. The mass accuracy was specified as 10 ppm and 0.02 Da for MS1 and MS2, respectively. Other search parameters included cysteine carbamidomethylation as a fixed modification and methionine oxidation as a variable modification. A maximum of one or two missed-cleavage sites was allowed for trypsin and chymotrypsin-processed samples, respectively. Pre-processing of spectra such as deisotoping and post-processing such Percolator(Kall et al., 2007) were included in the Proteome Discoverer workflow. We used the standard “target-decoy” strategy, including the reverse database as the decoy database during database search and false-positive estimations. The initial search results were filtered with the FDR of 0.01 (strict) based on the q-value. After the database search, the peptide-spectrum matches(PSMs) were exported, processed, and analyzed by Augur Llama with the following steps:
a. Nanobody Identification
i). Quality assessment of CDR3 fingerprints
Peptide candidates were first annotated as either CDR or FR peptides. To confidently identify CDR3 fingerprint peptides, we implemented a filter/algorithm requiring sufficient coverage of high-resolution CDR3 fragment ions in the PSMs (See illustration in Fig S1B). The filter was evaluated using a target sequence database containing approximately 0.5 million unique Nb sequences and a non-overlapping decoy database of similar size. Target and decoy Nb sequence databases herein used were obtained from different llamas. Any peptide identification from the decoy database was considered as a false positive. The FDR was defined based on the % of peptide identifications from the decoy database compared with those from the target database. CDR3 length was also considered to enable the development of a sensitive CDR3 peptide filter. The CDR3 fragmentation coverage was defined as the percentage of the CDR3 residues that were matched by fragment ions (either b ions or y ions) within the mass accuracy window. Spectra of the same peptide were combined for assessment. Only CDR3 peptides that passed this filter (5% FDR) were selected for the downstream Nb assembly.
ii). Nb sequence assembly
CDR peptides including the confident CDR3 peptides were used for Nb protein assemblies. Two additional criteria must be matched before an Nb could be identified. These include 1) both CDR1 and CDR2 peptides must be available for an Nb assembly. 2) for any Nb identification, a minimum of 50% combined CDR coverage was mandated.
b. Quantification and classification of antigen-specific Nb repertoires
MS raw data was accessed by MSFileReader 3.1 SP4(ThermoFisher), and a python library of pymsfilereader (https://github.com/frallain/pymsfilereader). Reliable CDR3 peptides that passed the quality filter were quantified by label-free LC/MS.
i). CDR3 peptide quantification
To enable accurate label-free quantification of a CDR3 peptide identification across different LC runs, different retention time windows for peptide peak extraction were specified. For peptides that could be directly identified by the search engine based on the MS/MS spectra, a small quantification window of +/− 0.5 minutes retention time (RT) shift was used for peak extractions. For peptides that were not directly identified from a particular LC run (due to the complexity of peptides and stochastic ion sampling), their RTs were predicted based on the RT of the adjacent LC and were adjusted using the median RT difference of the commonly identified peptides between the two LC runs. Here a relaxed RT window of +/− 2.0 minutes (for a typical 90 min LC gradient) was applied to facilitate extraction of the peptide peaks. Approximately 95% of peptide identifications can be matched between the LC runs. Both m/z and z of a peptide were used for peak extractions with a mass accuracy window of +/− 10 ppm. The peptide peaks were extracted and smoothed using a Gaussian function. Their AUCs (area under the curve) were calculated and AUCs from the replicated LC runs were averaged to infer the CDR3 peptide intensities.
ii). Classifications of Nbs
To enable accurate classifications, the relative ion intensities (AUCs) of CDR3 fingerprint peptides among three different biochemically fractionated Nb samples (F1, F2, and F3) were quantified as I1, I2, and I3. Based on the quantification results, CDR3 peptides were arbitrarily classified into three clusters (C1, C2, and C3) using the following criteria:
For C3 (high-affinity) cluster: I3 > I1+I2 (indicating Nbs were more specific to F3)
For C2 (mediocre-affinity) cluster: I2 > I1+I3 (indicating Nbs were more specific to F2)
For C1 (low-affinity) cluster: I1> I2+I3 (indicating Nbs were either more specific to F1 or likely nonspecific binders), alternatively, if I1 < I2+I3 and I2 < I1+I3 and I3 < I1+I2, these Nb identifications were likely nonspecifically identified and were grouped into C1 as well. See illustration in Fig S1C. The above method was used to classify HSA and GST Nbs.
For the analysis of high-affinity PDZ Nbs, an MBP control “F_control” (whose AUC is defined as I_control below) for non-specific MBP binding Nbs was included. If the sum intensity of I2 and I3 of a CDR3 peptide (PDZ Nb) were 20 fold higher than I_control (i.e., 20*I_control < I2+I3), Nbs that share the peptide were considered as high-affinity, specific PDZ binders.
For Nbs where multiple unique CDR3 peptides were mapped, only those with consistent peptide classifications were reported in the final dataset.
Heatmap analysis of the relative intensities of CDR3 peptides
The identified CDR3 peptides were quantified based on their relative MS1 ion intensities and were subsequently clustered using scripts in Augur Llama. Z-scores were calculated based on the relative ion intensities and were used to generate a heatmap in Fig 4A and Fig S4A for visualization.
Nb DNA synthesis and cloning
Nb genes were codon-optimized for expression in Escherichia coli and the nucleotides were in vitro synthesized (Synbiotech). After verification by Sanger sequencing, the Nb genes were cloned into a pET-21b (+) vector at BamHI and XhoI (for NbGST), or EcoRI and NotI restriction sites (NbPDZ and NbHSA ).
Purification of recombinant Proteins
DNA constructs were transformed into BL21(DE3) competent cells according to the manufacturer's instructions and plated on Agar with 50 μg/ml ampicillin at 37 °C overnight. A single colony was inoculated in LB medium with ampicillin for overnight culture at 37 °C. The culture was then inoculated at 1:100 (v/v) in fresh LB medium and shook at 37 °C until the O.D.600 nm reached 0.4-0.6. GST, GST-PDZ, and Nbs were induced with 0.5 mM of IPTG while MBP and MBP-PDZ were induced with 0.1 mM of IPTG. The inductions were performed at 16°C overnight. Cells were then harvested, briefly sonicated, and lysed on ice with a lysis buffer (1xPBS, 150 mM NaCl, 0.2% TX-100 with protease inhibitor). After lysis, soluble protein extract was collected at 15,000 x g for 10 mins. GST and GST-PDZ were purified using GSH resin and eluted by glutathione. MBP (maltose-binding protein) and MBP-PDZ fusion protein were purified by using Amylose resin and were eluted by maltose according to the manufacturer's instructions. Nbs were purified by His-Cobalt resin and were eluted using imidazole. The eluted proteins were subsequently dialyzed in the dialysis buffer (e.g., 1x DPBS, pH 7.4) and stored at −80 °C before use.
Nb immunoprecipitation assay
After Nb induction and cell lysis, the cell lysates were run on SDS-PAGE to estimate Nb expression levels. Recombinant Nbs in the cell lysis were diluted in 1x DPBS (pH 7.4) to a final concentration of ~ five μM (for NbGST) and ~ 50 nM (for NbPDZ). Antigens were coupled to the CNBr resin. Inactivated or MBP-conjugated CNBr resin was used for control. Antigen coupled resins or control resins were incubated with Nb lysates at four °C for 30 mins. The resins were then washed three times with a washing buffer (1x DPBS with 150 mM NaCl and 0.05% Tween 20) to remove nonspecific bindings. Specific antigen bound Nbs were then eluted from the resins by a hot LDS buffer containing 20 mM DTT and ran on SDS-PAGE. The intensities of Nbs on the gel were compared between antigen-specific signals and control signals to derive the false positive binding.
ELISA (enzyme-linked immunosorbent assay)
Indirect ELISA was carried out to evaluate the camelid immune response of an antigen and to quantify the relative affinities of antigen-specific Nbs. An antigen was coated onto a 96-well ELISA plate (R&D system) at an amount of approximately 1-10 ng per well in a coating buffer (15 mM sodium carbonate, 35 mM sodium bicarbonate, pH 9.6) overnight at 4°C. The well surface was then blocked with a blocking buffer (DPBS, 0.05% Tween 20, 5% milk) at room temperature for 2 hours. To test an immune response, the immunized serum was serially 5-fold diluted in the blocking buffer. The diluted sera were incubated with the antigen-coated wells at room temperature for 2 hours. HRP-conjugated secondary antibodies against llama Fc were diluted 1:10,000 in the blocking buffer and incubated with each well for 1 hour at room temperature. For Nb affinity tests, scramble Nbs that do not bind the antigen of interest were used for negative controls. Nbs of both specific binders for test and scramble negative controls were serially 10-fold diluted from 10 μM to 1 pM in the blocking buffer. HRP-conjugated secondary antibodies against His-tag or T7-tag were diluted 1:5,000 or 1:10,000 in the blocking buffer and incubated for 1 hour at room temperature. Three washes with 1x PBST (DPBS, 0.05% Tween 20) were carried out to remove nonspecific absorbances between each incubation. After the final wash, the samples were further incubated under dark with freshly prepared w3,3′,5,5′-Tetramethylbenzidine (TMB) substrate for 10 mins at room temperature to develop the signals. After the STOP solution (R&D system), the plates were read at multiple wavelengths (450 nm and 550 nm) on a plate reader (Multiskan GO, Thermo Fisher). A false positive Nb binder was defined if any of the following two criteria were met: i) the ELISA signal could only be detected at a concentration of 10 μM and was under detected at 1 μM concentration. ii ) at 1 μM concentration, a pronounced signal decrease (by more than 10 fold) was detected compared to the signal at 10 μM, while there were no signals could be detected at lower concentrations. The raw data was processed by Prism 7 (GraphPad) to fit into a 4PL curve and to calculate logIC50.
Nb affinity measurement by SPR
Surface plasmon resonance (SPR, Biacore 3000 system, GE Healthcare) was used to measure Nb affinities. Antigen proteins immobilized on the activated CM5 sensor-chip. Protein analytes were diluted to 10-30 μg/ml in 10 mM sodium acetate, pH 4.5, and were injected into the SPR system at 5 μl/min for 420 s. The surface of the sensor was blocked by 1 M ethanolamine-HCl (pH 8.5). For each Nb analyte, a series of dilution (spanning three orders of magnitude) was injected in HBS-EP+ running buffer (GE-Healthcare) containing 2 mM DTT, at a flow rate of 20- 30 μl/min for 120- 180 s, followed by a dissociation time of 5 - 20 mins based on dissociation rate. Between each injection, the sensor chip surface was regenerated with the low pH buffer containing 10 mM glycine-HCl (pH 1.5 - 2.5), or high pH buffer of 20 - 40 mM NaOH (pH 12 - 13). The regeneration was performed with a flow rate of 40-50 μl/min for 30 s. The measurements were duplicated and only highly reproducible data was used for analysis. Binding sensorgrams for each Nb were processed and analyzed using BIAevaluation by fitting with the 1:1 Langmuir model or the 1:1 Langmuir model with mass transfer.
Cross-linking and mass spectrometric analysis of antigen-nanobody complex
Different Nbs were incubated with the antigen of interest with equal molarity in an amine-free buffer (such as 1x DPBS with 2 mM DTT) at 4°C for 1 - 2 hours before cross-linking. The amine-specific disuccinimidyl suberate (DSS) or heterobifunctional linker 1-ethyl-3-(3-dimethylaminopropyl) carbodiimide hydrochloride (EDC) was added to the antigen-Nb complex at 1 mM or 2 mM final concentration, respectively. For DSS cross-linking, the reaction was performed at 23°C for 25 mins with constant agitation. For EDC cross-linking, the reaction was performed at 23°C for 60 mins. The reactions were quenched by 50 mM Tris-HCl (pH 8.0) for 10 mins at room temperature. After protein reduction and alkylation, the cross-linked samples were separated by a 4–12% SDS-PAGE gel (NuPAGE, Thermo Fisher). The regions corresponding to the cross-linked species were cut and in-gel digested with trypsin and Lys-C as previously described (Shi et al., 2014; Shi et al., 2015). After proteolysis, the peptide mixtures were desalted and analyzed with a nano-LC 1200 (Thermo Fisher) coupled to a Q Exactive™ HF-X Hybrid Quadrupole-Orbitrap™ mass spectrometer (Thermo Fisher). The cross-linked peptides were loaded onto a picochip column (C18, 3 μm particle size, 300 Å pore size, 50 μm × 10.5 cm; New Objective) and eluted using a 60 min LC gradient : 5% B–8% B, 0 – 5 min; 8% B – 32% B, 5 – 45 min; 32% B–100% B, 45 – 49 min; 100% B, 49 - 54 min; 100% B - 5 % B, 54 min - 54 min 10 sec; 5% B, 54 min 10 sec - 60 min 10 sec; mobile phase A consisted of 0.1% formic acid (FA), and mobile phase B consisted of 0.1% FA in 80% acetonitrile. The QE HF-X instrument was operated in the data-dependent mode, where the top 8 most abundant ions (mass range 380–2,000, charge state 3 - 7) were fragmented by high-energy collisional dissociation (normalized collision energy 27). The target resolution was 120,000 for MS and 15,000 for MS/MS analyses. The quadrupole isolation window was 1.8 Th and the maximum injection time for MS/MS was set at 120 ms. After the MS analysis, the data was searched by pLink for the identification of cross-linked peptides. The mass accuracy was specified as 10 and 20 p.p.m. for MS and MS/MS, respectively. Other search parameters included cysteine carbamidomethylation as a fixed modification and methionine oxidation as a variable modification. A maximum of three trypsin missed-cleavage sites was allowed. The initial search results were obtained using the default 5% false discovery rate, estimated using a target-decoy search strategy. The crosslink spectra were then manually checked to remove potential false-positive identifications essentially as previously described (Shi et al., 2014; Shi et al., 2015; Xiang et al., 2020b).
Structural modeling of antigen-Nb complexes
Structural models for Nbs were obtained using a multi-template comparative modeling protocol of MODELLER(Webb and Sali, 2014) with 10 best scoring blast hits against PDB as templates. Next, we refined the CDR3 loop, generated 100 loop models, and selected the top 5 scoring loop conformations for the downstream docking. This resulted in at least one Nb model with RMSD below 2.5 Å when tested on a benchmark of 190 experimentally solved Nb structures from PDB (Fig S8D). Each Nb model was then docked to the respective antigen by an antibody-antigen docking protocol of PatchDock software that focuses the search to the CDRs (Schneidman-Duhovny et al., 2005). The models were then re-scored by a statistical potential SOAP (Dong et al., 2013).
Antigen-Nb complexes were modeled by using the PatchDock protocol that optimizes cross-link restraints satisfaction (Schneidman-Duhovny and Wolfson, 2020). A restraint was considered satisfied if the Cα-Cα distance between the cross-linked residues was within 25Å and 20Å for DSS and EDC cross-linkers, respectively (Shi et al., 2014). In the case of ambiguous restraints, such as the GST dimer, we require that one of the possible cross-links is satisfied. The accuracy of docking significantly improved when cross-links were available (Schneidman-Duhovny et al., 2012) (Fig S8E).
Epitope identification based on the structural models
The antigen interface residues (distance <6Å from Nb atoms) among the 10 best scoring models according to the SOAP score were used to determine the epitopes. Once the epitopes were defined, we clustered the Nbs based on the epitope similarity using k-means clustering. The number of clusters was adjusted to identify a small number of large clusters confidently. The clusters reveal the most immunogenic surface patches on the antigens. The NC (not converged) clusters are a combination of other minor clusters where the epitope is not resolved with sufficient accuracy. Therefore, this analysis, based on top10 best scoring models, provides a lower bound on the number of epitopes.
Site-directed mutagenesis
Mammalian expression plasmid of HSA was obtained from Addgene. An E400R point mutation was introduced to the HSA sequence by the Q5 site-directed mutagenesis kit using the primer HSA-F and HSA-R. After sequence verification by Sanger Sequencing, plasmids bearing wild type HSA and the mutant were transfected to HeLa cells using Lipofectamine 3000 transfection kit (Invitrogen) and Opti-MEM (Gibco) according to the manufacturer's protocol. The cells were cultured overnight before the change of medium to DMEM without FBS supplements to remove BSA. After a 48 h culture at 37°C, 5% CO2, the media expressing HSA were collected and stored at −20°C. The media were analyzed by SDS-PAGE and Western Blotting to confirm protein expression. The PDZ domain (in the pGEX6p-1 vector) was obtained from the General Biosystems. A double point mutant of PDZ (i.e., R46E: K48D) was introduced by the Q5 Site-directed mutagenesis kit using specific primers of PDZ-F and PDZ-R. After verification by Sanger Sequencing, the mutant vector was transformed into BL21(DE3) cells (Thermo Scientific) for expression. The GST fusion PDZ mutant protein was purified by GSH resin as previously described.
Fluorescence Microscopy
COS-7 cells were plated onto the glass bottom dish at an initial confluence of 60-70% and cultured overnight to let the cells attach to the dish. Cells were stained with MitoTracker Orange CMTMRos (1:4000) at 37 ° for 30 minutes, washed once with PBS, and fixed with pre-cold methanol/ethanol (1:1) for 10 minutes. After being washed with PBS, the cells were blocked with 5% BSA for 1 hour. Alexa Fluor™ 647-conjugated Nb (1:100) was then added to the cells, incubated for 15 minutes at room temperature. Two-color wide-field fluorescence images were acquired using our custom-built system on an Olympus IX71 inverted microscope frame with 561 nm and 642 nm excitation lasers (MPB Communications, Pointe-Claire, Quebec, Canada) and a 100X oil immersion objective (NA=1.4, UPLSAPO 100XO; Olympus).
The cleavage rules for in silico digestion of Nbs by different proteases:
Trypsin: C-terminal to K/R, not followed by P
Chymotrypsin: C-terminal to W/F/L/Y, not followed by P
GluC: C-terminal to D/E, not followed by P
AspN: N-terminal to D
LysC: C-terminal to K
Sequence alignment of Nb database
Nb sequences were numbered using the software ANARCI according to Martin’s numbering scheme (MacCallum et al., 1996). CDRs (CDR1-CDR3) and Framework sequences (FR1-FR4) were colored based on the AbM definition. Alignments below the threshold e-value of 100 or introducing gaps with a frequency of > 0.999 were removed. The remaining sequences were then plotted by WebLogo to generate Fig 2A. No consensus tryptic site is identified on FR4. The closest lysine on FR3 (at position 95) is preceded by an N-terminal proline at position 96, rendering efficient proteolysis by trypsin difficult (Olsen et al., 2004; Rodriguez et al., 2008)(Fig S2A-B). Notably, compared to human and murine IgGs, this lysine-proline tag is more unique for Nbs.
In silico digestion of Nb database by different proteases and analysis of Nb CDR3 mapping
A high-quality database containing approximately 0.5 million unique Nb sequences was in silico digested using different enzymes including trypsin, chymotrypsin, LysC, GluC, and AspN according to the above cleavage rules. CDR3 containing peptides were obtained to calculate the sequence coverages. The CDR3 coverages were then summed to generate Fig 2E, Fig S2B, and S2D. The CDR3 peptide length distributions (by trypsin and chymotrypsin) were plotted to generate Fig 2D.
Simulation of trypsin and chymotrypsin-aided MS mapping of Nbs
10,000 Nb sequences with unique CDR3 fingerprint sequences were randomly selected from the database. The selected Nbs were then in silico digested by either trypsin or chymotrypsin (with no-miscleavage sites allowed) to generate CDR3 peptides. The following criteria were applied to these peptides to better simulate Nb identifications by MS: 1) peptides of favorable sizes for bottom-up proteomics (between 850- 3,000 Da) were first selected. 2) Peptides containing the highly conserved C-terminal FR4 motif of WGQGQVTS were further discarded. Based on our observations, such peptides are often dominated by C terminal y ion fragmentations, while having poorly fragmented ions on the CDR3 sequence which are essential for unambiguous CDR3 peptide identifications. 3) CDR3 peptides with limited Nb fingerprint information (containing less than 30% CDR3 sequence coverage) were removed. As a result, 2,111 unique tryptic peptides and 5,154 unique chymotryptic peptides were obtained. These peptides were then used to map Nb proteins. After protein assembly, only Nb identifications with sufficiently high CDR3 fingerprint sequence coverages ( ≥ 60%) were used to generate the Venn diagram in Fig S2E. Provided the same proteolysis efficiency of the two enzymes, this simulation indicated that significantly higher CDR3 sequence coverage can be expected by using chymotrypsin. Moreover, there was a small overlap (~9%) of CDR3 sequences identified by the two enzymes, indicating their good complementarity for efficient proteomic analysis.
Phylogenetic analysis of Nb CDR3 sequences
Phylogenetic trees were generated by Clustal Omega with the input of unique Nb CDR3 sequences and the additional flanking sequences (i.e., YYCAA to the N-term and WGQG to the C-term of CDR3 sequences) to assist alignments. The data was plotted by ITol (Interactive Tree of Life). Isoelectric points and hydrophobicities of Nb CDR3s were calculated using the BioPython library.
Evaluation of the reproducibility of Nb peptide quantification
Shared peptide identifications among different LC runs were used to evaluate the reproducibility of the label-free quantification method. For a typical 90 min LC gradient, the peptide peak width or full width at half maximum (FWHM) in general was less than 5s. The differences in peptide retention time among different LC runs were calculated to generate the kernel density estimation plots in Fig 4B. Peptide retention times from different LC runs were used to calculate Pearson correlation and were plotted in Fig S4B.
Analysis of relative abundance of amino acids on Nb CDRs
The amino acid frequencies at each CDR (including CDR1, CDR2, and CDR3 head) were calculated and normalized to generate the bar plots and the pie plots in Figs 5, S5, and S9. CDR3 head sequences were obtained by removing the semi-conserved C terminal four residues of CDR3s. The CDR residue frequencies of both high-affinity and low-affinity Nbs were normalized based on the sum of the CDR residues of each affinity group.
Analysis of amino acid positions on CDR3 heads
The relative position of a residue on a CDR3 head was calculated where a value of 0 indicates the very N terminus of a CDR3 head while 1.0 indicates the last residue. The CDR3 head sequences were then sliced into 20 bins with a bin width of 0.05. Within each bin, the occurrence of a specific type of amino acid (such as tyrosine, glycine, or serine) was counted and normalized to the sum of residues on CDR3 heads. The distributions of different amino acids including their relative positions and abundances were plotted in Fig 5G and Fig S5E.
Measurement of the interface curvature
The interface curvature was calculated as the average of the shape function of the interface atoms of the antigen or the Nb. For this purpose, a sphere of radius R (6Å) is placed at a surface point of the interface atom. The fraction of the sphere inside the solvent-excluded volume of the protein is the shape function at the corresponding atom (Connolly, 1986).
Machine learning analysis of Nb repertoires
We trained a deep neural network to distinguish between low- and high- affinity Nbs that were characterized by the accurate high-pH fractionation method and quantitative proteomics. Our model consists of one convolutional layer (L.1) with batch normalization and ReLU activation function, followed by a max-pooling layer (L.2) ending with a fully connected layer (L.3) to integrate the features extracted into the logits layer that leads to the classifier prediction. The convolutional layer consists of 20 1D filters, representing local receptive fields with a window size of 7 amino acids, long enough to capture the relevant CDRs and short enough to avoid data overfitting. A filter is a 20x7 matrix of weights for each amino acid in each of the 7 positions that can be represented by a sequence logo (Fig 5F). During the forward pass, each filter slides along the protein sequence with a fixed stride performing an element-wise multiplication with the current sequence window, followed by summing it up to generate a filter response. The classification accuracy of the model was 92%.
Representative filters that distinguish high-affinity from low-affinity Nbs were examined to understand better the physicochemical features that were learned by deep-learning. We selected the representative filters with the largest contribution to the final classification as follows. We analyzed the activation path from L.1 activation to end labeling on each example from the test dataset. Similarly to the backpropagation algorithm, we iterated backward from L.3, selecting the highest peaks of the element-wise multiplication of L.3 and the output of L.2 (contribute the most weight to the classification - above the upper 10 percentile). In the same way, we calculated upstream (L.2 then L.1) the contribution of each filter to those peaks. The result of this analysis is a list of the most important filters for each sequence classification. In addition, we analyzed the filter activity per CDR to get region-specific dominant filters. In conclusion, a representative filter is a pattern in the sequence that the networks learned as the most informative for a specific classification (high/low affinity) at a specific CDR region.
Quantification and Statistical Analysis
Quantification of MS samples was performed by AugurLlama and details can be found in Methods.
Statistical analysis was performed by Prism GraphPad(Version 7) and Scientific Computing in Python(SciPy 1.3.0). Details of the statistical analysis performed, exact values of n and what they represent, definitions of the summary statistics used, definitions of significance, and participant inclusion and exclusion criteria can be found in the Methods of the manuscript.
RESOURCE AVAILABILITY
Lead Contact:
Further information and requests for resources should be directed to and will be fulfilled by the Lead Contact, Yi Shi (yi.shi@pitt.edu).
Materials Availability:
Plasmids are being deposited at Addgene and are available from Yi Shi in the interim.
Data and Code Availability:
The proteomics data of chemical crosslink and mass spectrometric analysis (CX-MS) analysis was deposited at MassIVE data repository and are publicly available under the accession numbers: MSV000085117.
The proteomics data of Nb identifications and the Nb sequence database was deposited at the MassIVE data repository and are publicly available under the accession numbers: MSV000086055.
Codes for AugurLlama is publicly available at https://github.com/yishi-lab/AugurLlama.
Codes for deep learning analysis of Nb repertoires are publicly available at https://github.com/yishi-lab/nanobodies_dla.
Scripts used to generate the figures reported in this paper are available at https://github.com/yishi-lab/NbTechFigrueScripts.
Supplementary Material
Movie S1: Movie of Nbs binding to HSA. Related to Figure 6.
Movie S2: Movie of Nbs binding to GST. Related to Figure S7.
KEY RESOURCES TABLE
| REAGENT or RESOURCE | SOURCE | IDENTIFIER |
|---|---|---|
| Antibodies | ||
| THE™ His-Tag Antibody [HRP], mAb, Mouse | Genscript | A00612 |
| Llama IgG-H+L Antibody [HRP], pAb, Goat | Bethyl | A160-100P |
| T7 Tag Polyclonal Antibody, HRP | Thermo Fisher | PA1-31449 |
| Bacterial and Virus Strains | ||
| One Shot™ BL21(DE3) Chemically Competent E. coli | Invitrogen | C600003 |
| HeLa Cell | ATCC | N/A |
| COS-7 | ATCC | CRL-1651™ |
| Biological Samples | ||
| Llama #6503 & 7168 bleed, 10 days after the 4th boost | Caprologics, Inc. | N/A |
| Llama #6503 & 7168 bone marrow, 10 days after the 4th boost | Caprologics, Inc. | N/A |
| Chemicals, Peptides, and Recombinant Proteins | ||
| Human serum albumin | Prospec | PRO-354 |
| Pierce™ Lys-C Protease, MS Grade | Thermo Fisher | 90051 |
| Chymotrypsin, Sequencing Grade | Promega | V1061 |
| Sequencing Grade Modified Trypsin | Promega | V5111 |
| Formic Acid, 99+% | Thermo Fisher | PI28905 |
| Water, Optima™ LC/MS Grade | Fisher Scientific | W6-1 |
| Water with 0.1% Formic Acid (v/v), Optima™ LC/MS Grade | Fisher Scientific | LS118-1 |
| Pierce™ Acetonitrile (ACN), LC/MS Grade | Thermo Fisher | 85188 |
| Pierce™ 0.1% Formic Acid (v/v) in Acetonitrile (ACN), LC/MS Grade | Thermo Fisher | 85175 |
| LB Miller Broth | IBI Scientific | 49030 |
| Ampicillin, sodium salt, irradiated | Gibco | 11593027 |
| LB Miller’s Agar Powder | Growcells.com | MBPE-3020 |
| Dulbecco’s phosphate buffer saline no Ca 2+, Mg 2+ | Thermo Fisher | 14190250 |
| Pierce™ Protease Inhibitor Tablets, EDTA-free | Thermo Fisher | A32965 |
| Tween® 20 | Sigma | P9416-100ml |
| Histopaque® - 1077, sterile-filtered, 1.077g/ml | Sigma | 10771-500 ml |
| Critical Commercial Assays | ||
| RNeasy® Mini & Maxi Kit | Qiagen | 74106; 75142 |
| Monarch® PCR & DNA Cleanup Kit | NEB | T1030L |
| Monarch® DNA Gel Extraction Kit | NEB | T1020S |
| Maxima™ H Minus cDNA Synthesis kit | Thermo Fisher | K1682 |
| Platinum™ SuperFi™ PCR Master Mix | Thermo Fisher | 12358050 |
| ELISA kit | R & D system | DY990-999 |
| Biacore 3000 kits | GE Healthcare | Multiple |
| Q5® Site-Directed Mutagenesis Kit | NEB | E0554S |
| Lipofectamine® 3000 Transfection Reagents | Thermo Fisher | L3000008 |
| Deposited Data | ||
| MS raw data (cross-link) | MassIVE | MSV000085117 |
| MS raw data and NGS database (for Nb discovery) | MassIVE | MSV000086055 |
| Oligonucleotides | ||
| CALL001: 5’-GTCCTGGCTGCTCTTCTACAAGG-3’ | (Conrath et al., 2001) | N/A |
| CH2FORTA4: 5′-CGCCATCAAGGTACCAGTTGA-3′ | (Arbabi Ghahroudi et al., 1997) | N/A |
| 2nd-Forward: 5’-ATCTACACTCTTTCCCTACACGACGCTCTTCCGATCTNNNNNNNNATGGCT[C/G]A[G/T]GTGCAGCTGGTGGAGTCTGG-3’ | This paper | N/A |
| 2nd-Reverse: 5’-GTGACTGGAGTTCAGACGTGTGCTCTTCCGATCTNNNNNNNNGGAGACGGTGACCTGGGT-3’ | This paper | N/A |
| MiSeq-F: 5’-AATGATACGGCGACCACCGAGATCTACACTCTTTCCCTA-3’ | This paper | N/A |
| MiSeq-R: 5’-CAAGCAGAAGACGGCATACGAGATTTCTGAATGTGACTGGAGTTCA-3’ | This paper | N/A |
| HSA-F: 5’-GGTGTTCGACCGGTTCAAGCCTCTGG-3’ | This paper | N/A |
| HSA-R: 5’-TTGGCGTAGCACTCGTGA-3’ | This paper | N/A |
| PDZ-F: 5’-TGATGAAAATGGCGCAGCCGCC-3’ | This paper | N/A |
| PDZ-R: 5’-ATTTCACTCACATAGATACCACTATCATTACTAACATAC-3’ | This paper | N/A |
| Recombinant DNA | ||
| pGEX6p-1 vector (GST) | General Biosystems | N/A |
| pMAL-c5x vector (MBP) | General Biosystems | N/A |
| PDZ domain (1-100 aa of SYNJ2BP gene) in pGEX6p-1 vector | General Biosystems | N/A |
| PDZ domain in pMAL-c5x vector (NotI, EcoRI) | General Biosystems | N/A |
| ALB-bio-His (HSA) plasmid | Addgene | 52176 |
| Multiple Nanobodies in pET-21b(+) vector | Synbio | N/A |
| Software and Algorithms | ||
| Proteome Discoverer 1.2 | Thermo Fisher | |
| Pymsfilereader | N/A | https://github.com/frallain/pymsfilereader |
| Prism Version 7 | GraphPad Software | https://www.graphpad.com/scientific-software/prism/ |
| Web Logo | (Crooks et al., 2004) | http://weblogo.threeplusone.com/ |
| ANARCI | (Dunbar and Deane, 2016) | http://opig.stats.ox.ac.uk/webapps/newsabdab/sabpred/anarci/ |
| Clustal Omega | (Sievers et al., 2011) | http://www.clustal.org/omega/ |
| Jalview | (Waterhouse et al., 2009) | https://www.jalview.org/ |
| iTOL | (Letunic and Bork, 2007) | https://itol.embl.de/ |
| pLink 2 | (Chen et al., 2019) | http://pfind.ict.ac.cn/software/pLink/ |
| BioPython | N/A | https://biopython.org/ |
| MODELLER | (Webb and Sali, 2014) | salilab.org/modeller |
| PatchDock | (Schneidman-Duhovny et al., 2005) | http://bioinfo3d.cs.tau.ac.il/PatchDock/ |
| Integrative Modeling Platform (IMP) | (Russel et al., 2012) | salilab.org/imp |
| AugurLlama | This paper | https://github.com/yishi-lab/AugurLlama |
| Nb deep learning analysis | This paper | https://github.com/yishi-lab/nanobodies_dla |
| Others | ||
| Sep-Pak C18 1cc Vac Cartridge, 55 – 105 μm, 50 mg | Waters | WAT054955 |
| EmporeTM SPE Disks C18, Diam. 47 mm | Sigma | 66883-U |
| PierceTM Glutathione (GSH) Agarose | Thermo Fisher | 16100 |
| Amylose resin (MBP fusion protein purification) | NEB | E8021S |
| PROTEINDEXTM rProtein G Agarose 4 Fast Flow | Marvelgent Biosciences, Inc. | 11-0206-025 |
| PROTEINDEXTM rProtein A Agarose 4 Fast Flow | Marvelgent Biosciences, Inc. | 11-0203-025 |
| CNBr - Activated SepharoseTM 4 Fast Flow Affinity Media | GE Healthcare | 17098101 |
| HisPurTM Cobalt Resin | Thermo Fisher | 89966 |
| Dynabeads® M-270 Epoxy | Thermo Fisher | 14302D |
| Alexa FluorTM 647 C2 Maleimide | Invitrogen | A20347 |
| MitoTracker™ Orange CMTMRos | Thermo Fisher | M7510 |
Highlights:
Proteomic pipeline for identification and quantification of camelid nanobody repertoires
Discovery of thousands of distinct and high-affinity antigen-specific nanobody families
Global epitope mapping by integrative structural proteomics
Mechanisms underlying high-affinity antigen-nanobody binding
Acknowledgments
We thank J.L.Jia and Y.Jiao for the NGS experiments, Z.Shen and Z.Y.Xiao for assistance in the mutagenesis experiments, J.W. Ahn for the help on the biophysics experiments, P.W. Duplex for access to the SPR device, J.J.Wang (Rockefeller University) for providing a script for the preliminary database analysis, and Y.Liu, H.Maayan and D.Groebe for comments of the manuscript. This work was supported by the University of Pittsburgh School of Medicine (Y.S.) and a UPMC Aging Institute pilot fund (Y.S.), NIH grant 1R35GM137905-01 (Y.S.), and ISF 1466/18, Israel ministry of Science and Technology and HUJI-CIDR (D.S.).
Footnotes
Publisher's Disclaimer: This is a PDF file of an unedited manuscript that has been accepted for publication. As a service to our customers we are providing this early version of the manuscript. The manuscript will undergo copyediting, typesetting, and review of the resulting proof before it is published in its final form. Please note that during the production process errors may be discovered which could affect the content, and all legal disclaimers that apply to the journal pertain.
Reference
- Abhinandan KR, and Martin AC (2008). Analysis and improvements to Kabat and structurally correct numbering of antibody variable domains. Mol Immunol 45, 3832–3839. [DOI] [PubMed] [Google Scholar]
- Akram A, and Inman RD (2012). Immunodominance: A pivotal principle in host response to viral infections. Clin Immunol 143, 99–115. [DOI] [PubMed] [Google Scholar]
- Arbabi Ghahroudi M, Desmyter A, Wyns L, Hamers R, and Muyldermans S (1997). Selection and identification of single domain antibody fragments from camel heavy-chain antibodies. fEbS Lett 414, 521–526. [DOI] [PubMed] [Google Scholar]
- Baran D, Pszolla MG, Lapidoth GD, Norn C, Dym O, Unger T, Albeck S, Tyka MD, and Fleishman SJ (2017). Principles for computational design of binding antibodies. Proc Natl Acad Sci U S A 114, 10900–10905. [DOI] [PMC free article] [PubMed] [Google Scholar]
- Chait BT, Cadene M, Olinares PD, Rout MP, and Shi Y (2016). Revealing Higher Order Protein Structure Using Mass Spectrometry. J Am Soc Mass Spectr 27, 952–965. [DOI] [PMC free article] [PubMed] [Google Scholar]
- Chaplin DD (2006). 1. Overview of the human immune response. J Allergy Clin Immunol 117, S430–435. [DOI] [PubMed] [Google Scholar]
- Chevalier A, Silva DA, Rocklin GJ, Hicks DR, Vergara R, Murapa P, Bernard SM, Zhang L, Lam KH, Yao G, et al. (2017). Massively parallel de novo protein design for targeted therapeutics. Nature 550, 74–79. [DOI] [PMC free article] [PubMed] [Google Scholar]
- Connolly ML (1986). Shape Complementarity at the Hemoglobin Alpha-1-Beta-1-Subunit Interface. Biopolymers 25, 1229–1247. [DOI] [PubMed] [Google Scholar]
- Cox J, and Mann M (2008). MaxQuant enables high peptide identification rates, individualized p.p.b.-range mass accuracies and proteome-wide protein quantification. Nat Biotechnol 26, 1367–1372. [DOI] [PubMed] [Google Scholar]
- Desmyter A, Transue TR, Ghahroudi MA, Thi MH, Poortmans F, Hamers R, Muyldermans S, and Wyns L (1996). Crystal structure of a camel single-domain VH antibody fragment in complex with lysozyme. Nat Struct Biol 3, 803–811. [DOI] [PubMed] [Google Scholar]
- Dong GQ, Fan H, Schneidman-Duhovny D, Webb B, and Sali A (2013). Optimized atomic statistical potentials: assessment of protein interfaces and loops. Bioinformatics 29, 3158–3166. [DOI] [PMC free article] [PubMed] [Google Scholar]
- Doyle DA, Lee A, Lewis J, Kim E, Sheng M, and MacKinnon R (1996). Crystal structures of a complexed and peptide-free membrane protein-binding domain: molecular basis of peptide recognition by PDZ. Cell 85, 1067–1076. [DOI] [PubMed] [Google Scholar]
- Egloff P, Zimmermann I, Arnold FM, Hutter CAJ, Morger D, Opitz L, Poveda L, Keserue HA, Panse C, Roschitzki B, et al. (2019). Engineered peptide barcodes for in-depth analyses of binding protein libraries. Nat Methods 16, 421–428. [DOI] [PMC free article] [PubMed] [Google Scholar]
- Finn JA, Leman JK, Willis JR, Cisneros A, Crowe JE, and Meiler J (2016). Improving Loop Modeling of the Antibody Complementarity-Determining Region 3 Using Knowledge-Based Restraints. Plos One 11. [DOI] [PMC free article] [PubMed] [Google Scholar]
- Fridy PC, Li Y, Keegan S, Thompson MK, Nudelman I, Scheid JF, Oeffinger M, Nussenzweig MC, Fenyo D, Chait BT, et al. (2014). A robust pipeline for rapid production of versatile nanobody repertoires. Nat Methods 11, 1253–1260. [DOI] [PMC free article] [PubMed] [Google Scholar]
- Hamers-Casterman C, Atarhouch T, Muyldermans S, Robinson G, Hamers C, Songa EB, Bendahman N, and Hamers R (1993). Naturally occurring antibodies devoid of light chains. Nature 363, 446–448. [DOI] [PubMed] [Google Scholar]
- Inbar D, Hochman J, and Givol D (1972). Localization of antibody-combining sites within the variable portions of heavy and light chains. Proc Natl Acad Sci U S A 69, 2659–2662. [DOI] [PMC free article] [PubMed] [Google Scholar]
- Jiang S, Zhang X, Yang Y, Hotez PJ, and Du L (2020). Neutralizing antibodies for the treatment of COVID-19. Nat Biomed Eng 4, 1134–1139. [DOI] [PMC free article] [PubMed] [Google Scholar]
- Kall L, Canterbury JD, Weston J, Noble WS, and MacCoss MJ (2007). Semi-supervised learning for peptide identification from shotgun proteomics datasets. Nat Methods 4, 923–925. [DOI] [PubMed] [Google Scholar]
- Kim SJ, Fernandez-Martinez J, Nudelman I, Shi Y, Zhang W, Raveh B, Herricks T, Slaughter BD, Hogan JA, Upla P, et al. (2018). Integrative structure and functional anatomy of a nuclear pore complex. Nature 555, 475–482. [DOI] [PMC free article] [PubMed] [Google Scholar]
- Lam AY, Pardon E, Korotkov KV, Hol WGJ, and Steyaert J (2009). Nanobody-aided structure determination of the EpsI:EpsJ pseudopilin heterodimer from Vibrio vulnificus. J Struct Biol 166, 8–15. [DOI] [PMC free article] [PubMed] [Google Scholar]
- Lawrence MC, and Colman PM (1993). Shape Complementarity at Protein-Protein Interfaces. J Mol Biol 234, 946–950. [DOI] [PubMed] [Google Scholar]
- Leitner A, Faini M, Stengel F, and Aebersold R (2016). Crosslinking and Mass Spectrometry: An Integrated Technology to Understand the Structure and Function of Molecular Machines. Trends Biochem Sci 41, 20–32. [DOI] [PubMed] [Google Scholar]
- Li H, Joh YS, Kim H, Paek E, Lee SW, and Hwang KB (2016a). Evaluating the effect of database inflation in proteogenomic search on sensitive and reliable peptide identification. BMC Genomics 17, 1031. [DOI] [PMC free article] [PubMed] [Google Scholar]
- Li T, Qi SL, Unger M, Hou YN, Deng QW, Liu J, Lam CMC, Wang XW, Xin D, Zhang P, et al. (2016b). Immuno-targeting the multifunctional CD38 using nanobody. Sci Rep-Uk 6. [DOI] [PMC free article] [PubMed] [Google Scholar]
- MacCallum RM, Martin ACR, and Thornton JM (1996). Antibody-antigen interactions: Contact analysis and binding site topography. J Mol Biol 262, 732–745. [DOI] [PubMed] [Google Scholar]
- McCoy AJ, Epa VC, and Colman PM (1997). Electrostatic complementarity at protein/protein interfaces. J Mol Biol 268, 570–584. [DOI] [PubMed] [Google Scholar]
- Morens DM, Folkers GK, and Fauci AS (2004). The challenge of emerging and re-emerging infectious diseases. Nature 430, 242–249. [DOI] [PMC free article] [PubMed] [Google Scholar]
- Muyldermans S (2013). Nanobodies: natural single-domain antibodies. Annu Rev Biochem 82, 775–797. [DOI] [PubMed] [Google Scholar]
- Niethammer M, Valtschanoff JG, Kapoor TM, Allison DW, Weinberg RJ, Craig AM, and Sheng M (1998). CRIPT, a novel postsynaptic protein that binds to the third PDZ domain of PSD-95/SAP90. Neuron 20, 693–707. [DOI] [PubMed] [Google Scholar]
- Olsen JV, Ong SE, and Mann M (2004). Trypsin cleaves exclusively C-terminal to arginine and lysine residues. Mol Cell Proteomics 3, 608–614. [DOI] [PubMed] [Google Scholar]
- Paules CI, Marston HD, and Fauci AS (2020). Coronavirus Infections-More Than Just the Common Cold. JAMA 323, 707–708. [DOI] [PubMed] [Google Scholar]
- Peng HP, Lee KH, Jian JW, and Yang AS (2014). Origins of specificity and affinity in antibody-protein interactions. Proc Natl Acad Sci U S A 111, E2656–2665. [DOI] [PMC free article] [PubMed] [Google Scholar]
- Pires DEV, Ascher DB, and Blundell TL (2014). mCSM: predicting the effects of mutations in proteins using graph-based signatures. Bioinformatics 30, 335–342. [DOI] [PMC free article] [PubMed] [Google Scholar]
- Rini JM, Schulzegahmen U, and Wilson IA (1992). Structural Evidence for Induced Fit as a Mechanism for Antibody-Antigen Recognition. Science 255, 959–965. [DOI] [PubMed] [Google Scholar]
- Robbiani DF, Gaebler C, Muecksch F, Lorenzi JCC, Wang Z, Cho A, Agudelo M, Barnes CO, Gazumyan A, Finkin S, et al. (2020). Convergent antibody responses to SARS-CoV-2 in convalescent individuals. Nature 584, 437–442. [DOI] [PMC free article] [PubMed] [Google Scholar]
- Rodriguez J, Gupta N, Smith RD, and Pevzner PA (2008). Does trypsin cut before proline? J Proteome Res 7, 300–305. [DOI] [PubMed] [Google Scholar]
- Rout MP, and Sali A (2019). Principles for Integrative Structural Biology Studies. Cell 177, 1384–1403. [DOI] [PMC free article] [PubMed] [Google Scholar]
- Sanjuan R, Nebot MR, Chirico N, Mansky LM, and Belshaw R (2010). Viral Mutation Rates. J Virol 84, 9733–9748. [DOI] [PMC free article] [PubMed] [Google Scholar]
- Sato S, Beausoleil SA, Popova L, Beaudet JG, Ramenani RK, Zhang X, Wieler JS, Schieferl SM, Cheung WC, and Polakiewicz RD (2012). Proteomics-directed cloning of circulating antiviral human monoclonal antibodies. Nat Biotechnol 30, 1039–1043. [DOI] [PubMed] [Google Scholar]
- Savitski MM, Wilhelm M, Hahne H, Kuster B, and Bantscheff M (2015). A Scalable Approach for Protein False Discovery Rate Estimation in Large Proteomic Data Sets. Mol Cell Proteomics 14, 2394–2404. [DOI] [PMC free article] [PubMed] [Google Scholar]
- Scheid JF, Mouquet H, Ueberheide B, Diskin R, Klein F, Oliveira TYK, Pietzsch J, Fenyo D, Abadir A, Velinzon K, et al. (2011). Sequence and Structural Convergence of Broad and Potent HIV Antibodies That Mimic CD4 Binding. Science 333, 1633–1637. [DOI] [PMC free article] [PubMed] [Google Scholar]
- Schmidt AG, Therkelsen MD, Stewart S, Kepler TB, Liao HX, Moody MA, Haynes BF, and Harrison SC (2015). Viral receptor-binding site antibodies with diverse germline origins. Cell 161, 1026–1034. [DOI] [PMC free article] [PubMed] [Google Scholar]
- Schneidman-Duhovny D, Inbar Y, Nussinov R, and Wolfson HJ (2005). PatchDock and SymmDock: servers for rigid and symmetric docking. Nucleic Acids Res 33, W363–367. [DOI] [PMC free article] [PubMed] [Google Scholar]
- Schneidman-Duhovny D, Rossi A, Avila-Sakar A, Kim SJ, Velazquez-Muriel J, Strop P, Liang H, Krukenberg KA, Liao M, Kim HM, et al. (2012). A method for integrative structure determination of protein-protein complexes. Bioinformatics 28, 3282–3289. [DOI] [PMC free article] [PubMed] [Google Scholar]
- Schneidman-Duhovny D, and Wolfson HJ (2020). Modeling of Multimolecular Complexes. Methods Mol Biol 2112, 163–174. [DOI] [PubMed] [Google Scholar]
- Schoof M, Faust B, Saunders RA, Sangwan S, Rezelj V, Hoppe N, Boone M, Billesbolle CB, Puchades C, Azumaya CM, et al. (2020). An ultrapotent synthetic nanobody neutralizes SARS-CoV-2 by stabilizing inactive Spike. Science 370, 1473–1479. [DOI] [PMC free article] [PubMed] [Google Scholar]
- Sela-Culang I, Kunik V, and Ofran Y (2013). The structural basis of antibody-antigen recognition. Front Immunol 4, 302. [DOI] [PMC free article] [PubMed] [Google Scholar]
- Sheng M, and Sala C (2001). PDZ domains and the organization of supramolecular complexes. Annu Rev Neurosci 24, 1–29. [DOI] [PubMed] [Google Scholar]
- Shi Y, Fernandez-Martinez J, Tjioe E, Pellarin R, Kim SJ, Williams R, Schneidman-Duhovny D, Sali A, Rout MP, and Chait BT (2014). Structural characterization by cross-linking reveals the detailed architecture of a coatomer-related heptameric module from the nuclear pore complex. Mol Cell Proteomics 13, 2927–2943. [DOI] [PMC free article] [PubMed] [Google Scholar]
- Shi Y, Pellarin R, Fridy PC, Fernandez-Martinez J, Thompson MK, Li Y, Wang QJ, Sali A, Rout MP, and Chait BT (2015). A strategy for dissecting the architectures of native macromolecular assemblies. Nat Methods 12, 1135–1138. [DOI] [PMC free article] [PubMed] [Google Scholar]
- Sircar A, Sanni KA, Shi J, and Gray JJ (2011). Analysis and modeling of the variable region of camelid single-domain antibodies. J Immunol 186, 6357–6367. [DOI] [PMC free article] [PubMed] [Google Scholar]
- Truck J, Ramasamy MN, Galson JD, Rance R, Parkhill J, Lunter G, Pollard AJ, and Kelly DF (2015). Identification of antigen-specific B cell receptor sequences using public repertoire analysis. J Immunol 194, 252–261. [DOI] [PMC free article] [PubMed] [Google Scholar]
- Victora GD, and Wilson PC (2015). Germinal center selection and the antibody response to influenza. Cell 163, 545–548. [DOI] [PMC free article] [PubMed] [Google Scholar]
- Webb B, and Sali A (2014). Protein structure modeling with MODELLER. Methods Mol Biol 1137, 1–15. [DOI] [PubMed] [Google Scholar]
- Wei XP, Decker JM, Wang SY, Hui HX, Kappes JC, Wu XY, Salazar-Gonzalez JF, Salazar MG, Kilby JM, Saag MS, et al. (2003). Antibody neutralization and escape by HIV-1. Nature 422, 307–312. [DOI] [PubMed] [Google Scholar]
- Wine Y, Boutz DR, Lavinder JJ, Miklos AE, Hughes RA, Hoi KH, Jung ST, Horton AP, Murrin EM, Ellington AD, et al. (2013). Molecular deconvolution of the monoclonal antibodies that comprise the polyclonal serum response. Proc Natl Acad Sci U S A 110, 2993–2998. [DOI] [PMC free article] [PubMed] [Google Scholar]
- Woolhouse M, Scott F, Hudson Z, Howey R, and Chase-Topping M (2012). Human viruses: discovery and emergence. Philos T R Soc B 367, 2864–2871. [DOI] [PMC free article] [PubMed] [Google Scholar]
- Xiang Y, Nambulli S, Xiao Z, Liu H, Sang Z, Duprex WP, Schneidman-Duhovny D, Zhang C, and Shi Y (2020a). Versatile and multivalent nanobodies efficiently neutralize SARS-CoV-2. Science 370, 1479–1484. [DOI] [PMC free article] [PubMed] [Google Scholar]
- Xiang Y, Shen Z, and Shi Y (2020b). Chemical Cross-Linking and Mass Spectrometric Analysis of the Endogenous Yeast Exosome Complexes. Methods Mol Biol 2062, 383–400. [DOI] [PubMed] [Google Scholar]
- Yu C, and Huang L (2018). Cross-Linking Mass Spectrometry: An Emerging Technology for Interactomics and Structural Biology. Anal Chem 90, 144–165. [DOI] [PMC free article] [PubMed] [Google Scholar]
- Zhu W, Smith JW, and Huang CM (2010). Mass spectrometry-based label-free quantitative proteomics. J Biomed Biotechnol 2010, 840518. [DOI] [PMC free article] [PubMed] [Google Scholar]
Associated Data
This section collects any data citations, data availability statements, or supplementary materials included in this article.
Supplementary Materials
Movie S1: Movie of Nbs binding to HSA. Related to Figure 6.
Movie S2: Movie of Nbs binding to GST. Related to Figure S7.
Data Availability Statement
The proteomics data of chemical crosslink and mass spectrometric analysis (CX-MS) analysis was deposited at MassIVE data repository and are publicly available under the accession numbers: MSV000085117.
The proteomics data of Nb identifications and the Nb sequence database was deposited at the MassIVE data repository and are publicly available under the accession numbers: MSV000086055.
Codes for AugurLlama is publicly available at https://github.com/yishi-lab/AugurLlama.
Codes for deep learning analysis of Nb repertoires are publicly available at https://github.com/yishi-lab/nanobodies_dla.
Scripts used to generate the figures reported in this paper are available at https://github.com/yishi-lab/NbTechFigrueScripts.